The Lurie Group
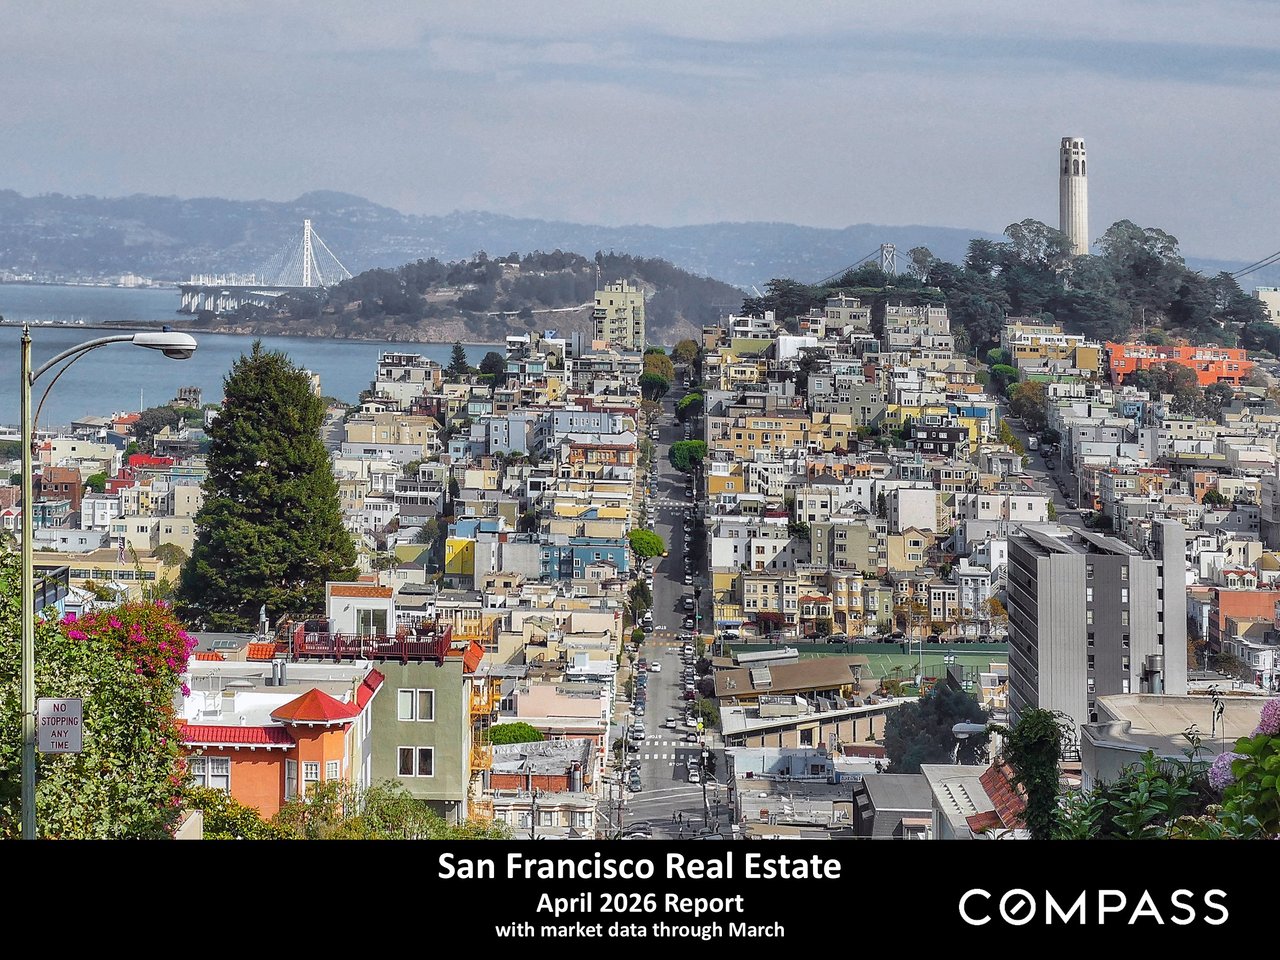
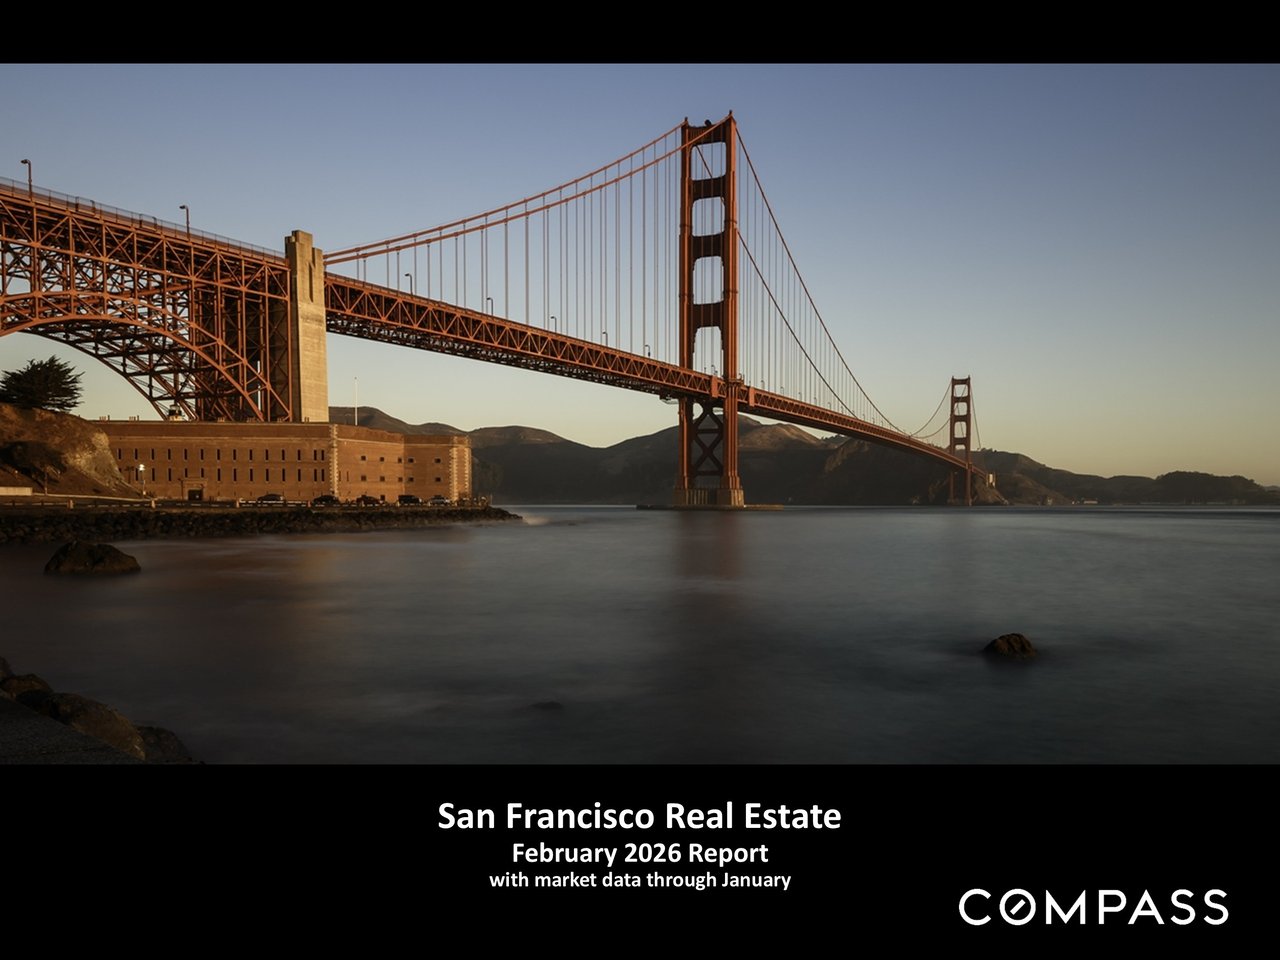
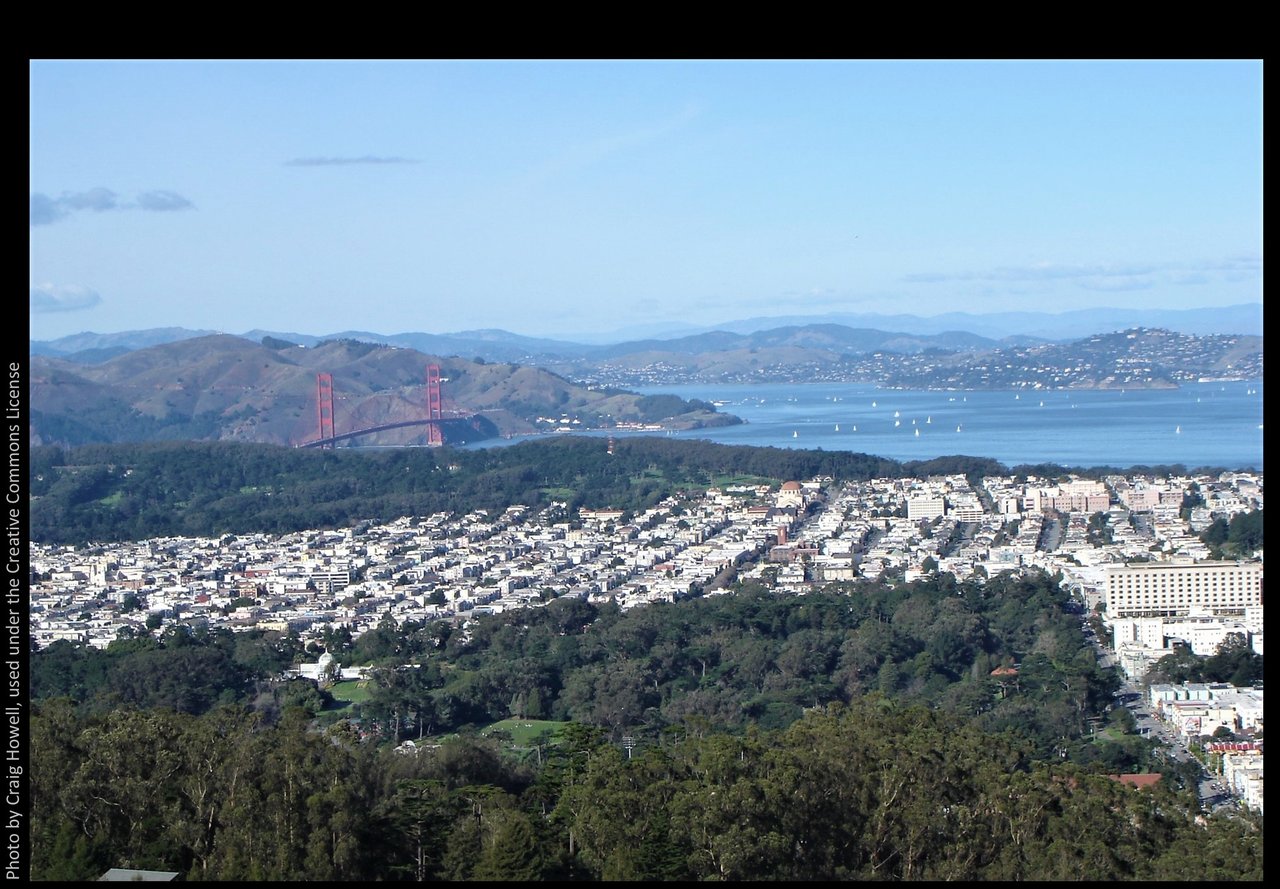
San Francisco real estate March 2026 report cover, featuring the Golden Gate Bridge and COMPASS branding.

San Francisco 2026 March Real Estate Report

  • Alexander Lurie
  • March 18, 2026

San Francisco Real Estate
March 2026 Report

The Market Continues to Accelerate in
Possibly the Hottest Market in the Country

Moving into spring, soaring buyer demand vs. an extremely inadequate supply of
homes for sale continues to foster ferocious buyer competition, faster sales,
more overbidding and rapidly rising home prices. Luxury home sales rose over
200% year over year to hit their highest month-of-February count ever.

The upcoming months are typically among the most active of the year and
median home sales prices often hit their calendar-year highs in spring – though
that did not happen in 2025 due to autumn’s enormous AI-driven market boom.

As has been the case in recent years, houses are seeing stronger market
conditions than condos, but SF’s condo market is also rebounding dramatically.
More affluent buyers continue to play an outsized role in demand and home-
price appreciation.

The wild card in coming months is what sustained effects, if any, the Iran war
may have on inflation, interest rates, financial markets and consumer confidence.
Barring an extreme decline in economic conditions, we currently consider a
significant negative impact on the city’s housing market unlikely.

This analysis and data were compiled by our friend Patrick Carlisle at Compass.

San Francisco real estate market report highlighting strong buyer demand, rising prices, and luxury sales growth.

Chart of San Francisco median house prices from 1990 to February 2026, with market-event annotations and a $1.75 million rolling median.

San Francisco condo price chart, 2005–February 2026, showing a $1,137,500 three-month median.

Chart of San Francisco house and condo median price per square foot trends, 2005–February 2026.

Bar chart comparing San Francisco 2024 and 2025 dollar-per-square-foot values by home size, with year-over-year changes.

Bar chart of San Francisco luxury home sales over $5 million, January 2020–January 2026.

Chart compares median 3-bedroom and 4-bedroom home sale prices across eleven Greater Bay Area counties.

Bar chart compares median price per square foot for two house sizes across 11 Greater Bay Area counties.

Chart of San Francisco new listings from 2021 to February 2026, showing recurring September peaks and December declines.

Bar chart of San Francisco active and coming-soon listings, showing monthly counts from February 2022 to March 2026.

San Francisco housing supply and demand chart comparing listings, monthly sales, and inventory months by property type.

Chart of San Francisco listings going into contract, showing seasonal trends and a February 2026 rebound.

San Francisco monthly absorption-rate chart, with green bars showing listings accepting offers from April 2022 to February 2026.

San Francisco overbidding chart showing monthly shares of home sales closing above list price, January 2020–January 2026.

San Francisco home sale prices compared with original list prices, shown in an annotated monthly bar chart through February 2026.

Chart of San Francisco average days on market from 2021 to 2026, highlighting seasonal sales patterns.

Chart of San Francisco active-listing price reductions from 2020 to 2026, with seasonal peaks and a 59% year-over-year decline in February 2026.

Chart of San Francisco monthly home sales, January 2021–January 2026, with seasonal trends and February 2026 market notes.

Selected Economic & Demographic Data

San Francisco population breakdown pie chart, showing race and ancestry estimates from 2024 U.S. Census data.

The weekly average 30-year rate rose to 6.22% as of March 19th, but the daily average rate has risen to 6.43% based on 3/19 reading. 

Chart of 30-year fixed mortgage rates from 2022 to 2026, with annotations for the tariff shock and Iran war.

Amid regular ups and downs, stock markets have been generally trending down, and have fallen 4% to 5% since 2026 began.

Chart comparing Nasdaq and S&P 500 changes from January 2025 to March 2026, with a marked tariff shock.

Oil prices:  The huge wildcard for the world economy. 

Chart of crude oil prices from February 2 to March 19, 2026, showing a sharp rise in March.

Chart of U.S. gas prices, falling to about $2.78 before surging to $3.80 by March 2026.

Last month's inflation reading was subdued (first chart), but the Producer Price Index, often a forward indicator for consumer inflation, rose to its highest reading in 12 months (second chart). Any effects of the Iran war, should they occur, will not yet appear in either of these charts. 

CPI bar chart shows inflation peaking at 8.9% in 2022 before falling to 2.4% in February 2026.

The Fed left its benchmark rate unchanged at its March meeting. The board currently projects 1 rate reduction in 2026 (but that can change quickly).

Chart tracks federal funds rates since 1981, highlighting major economic events and rate changes through 2025.

Q4 GDP was revised significantly downward.

Bar chart of U.S. real GDP growth by quarter from 2022 through 2025, with two quarters of contraction.
 
Bar chart of the Producer Price Index from 2020 to 2026, peaking above 11% in 2022 and at 3.4% in February 2026.

VIX volatility chart from 2025 to February 2026, highlighting the April tariff-shock spike and March 2026 rise.

Chart of the S&P 500 CAPE ratio from 1985 to 2026, with historical average and major market events marked.

Economic Policy Uncertainty Index chart, with a red line from 2000 to February 2026 and a spike at the April 2025 tariff shock.

Chart of monthly U.S. job changes, with green positive bars and red negative bars; updated March 6, 2026.
Bitcoin price chart from March 2024 to March 2026, with a peak above $120,000 in October 2025.

Consumer confidence remains very low, and we do not yet have a reading reflecting the reaction to the war.

Real estate report notes defining market statistics and outlining data limitations, licensing, and legal disclaimers.


Alexander Lurie smiling in a dark blazer and striped shirt.

Meet Alexander

Meet Alexander Lurie

Alexander Fromm Lurie is a highly accomplished San Francisco real estate professional and the leader of The Lurie Group, a top-performing team recognized among the top 1% of agents in the city. With over a decade of experience in the real estate industry and California DRE License #01952347, Alexander has built a reputation for delivering exceptional results, with hundreds of homes sold and over $1 billion in total sales volume. Born and raised in San Francisco, he brings deep local expertise, generational knowledge of the Bay Area, and a strong connection to the community into every client relationship. His approach goes beyond transactions—focusing on helping clients build meaningful connections to neighborhoods, schools, and local culture while navigating the buying or selling process with confidence.

Alexander’s background in management consulting and entrepreneurship further strengthens his strategic approach to real estate, allowing him to provide clients with a competitive edge in pricing, negotiation, and marketing. Known for his integrity, discretion, and client-first mindset, he continues to be a trusted advisor for buyers, sellers, and investors across San Francisco’s dynamic real estate market.

Alexander Lurie

Founder | Real Estate Advisor
LICENSE NUMBER
01952347
ADDRESS
629 Divisadero Ave, San Francisco, CA 94117

Let's Work Together

Our passion is supporting clients who value exceptional results and client care. We look forward to the opportunity to work together.
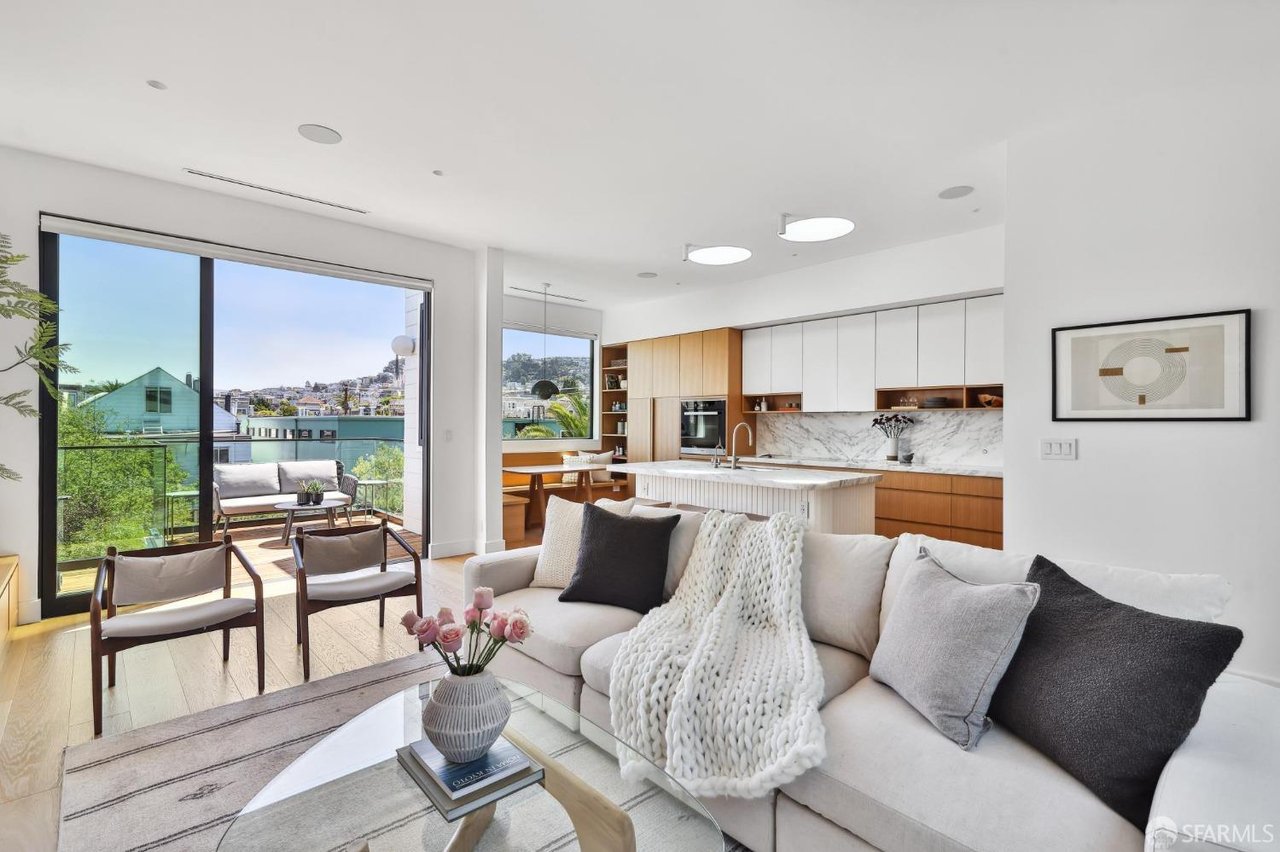
Modern condo living and dining area with a geometric chandelier and Bay Bridge views through large windows.
link
Follow Us