
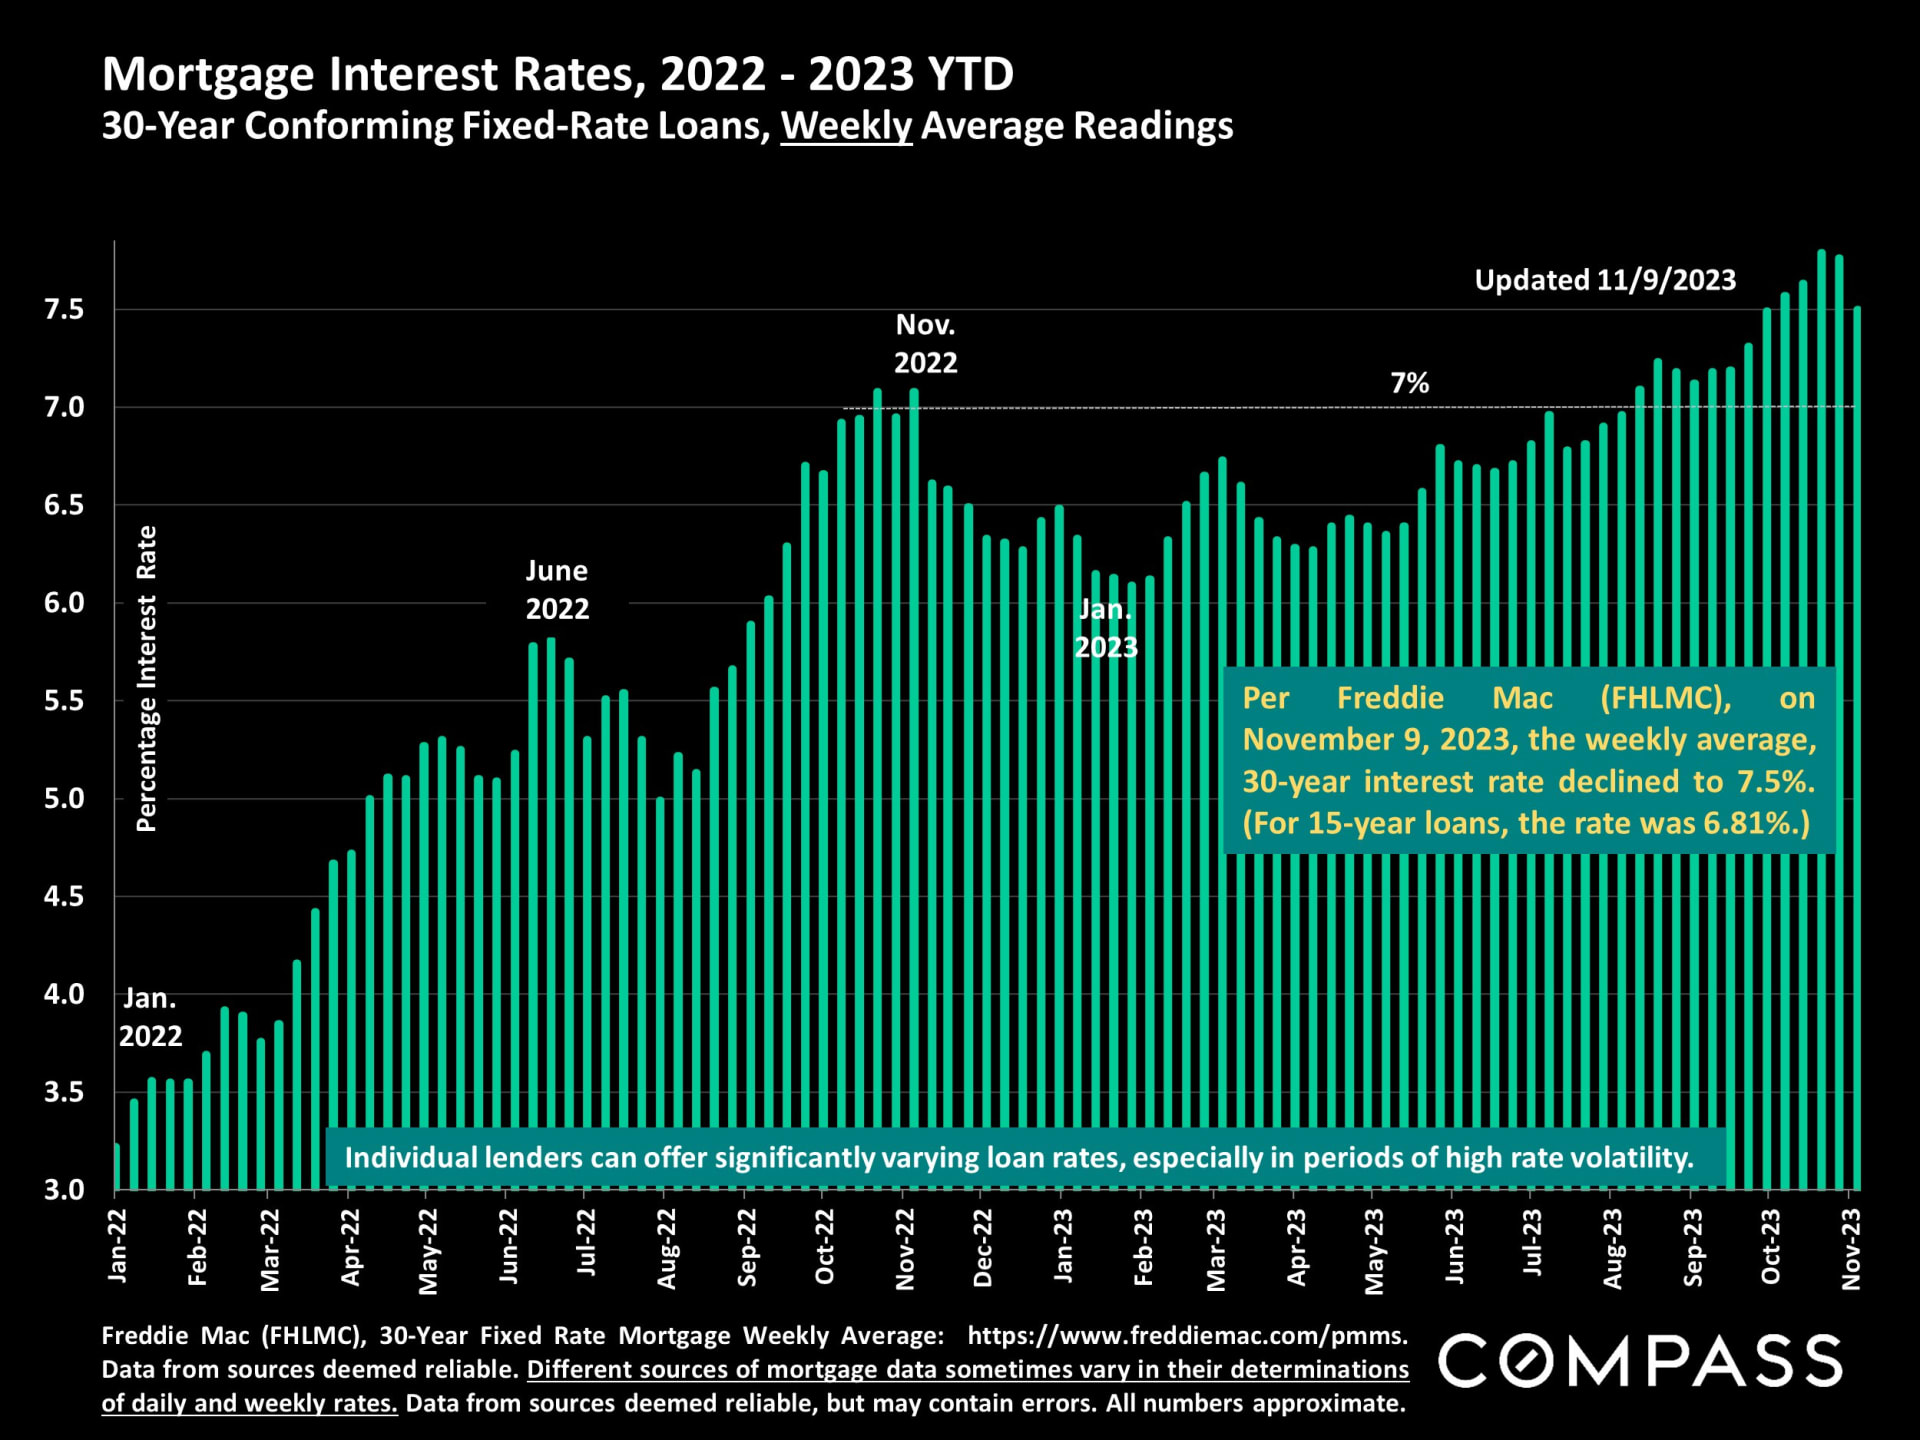
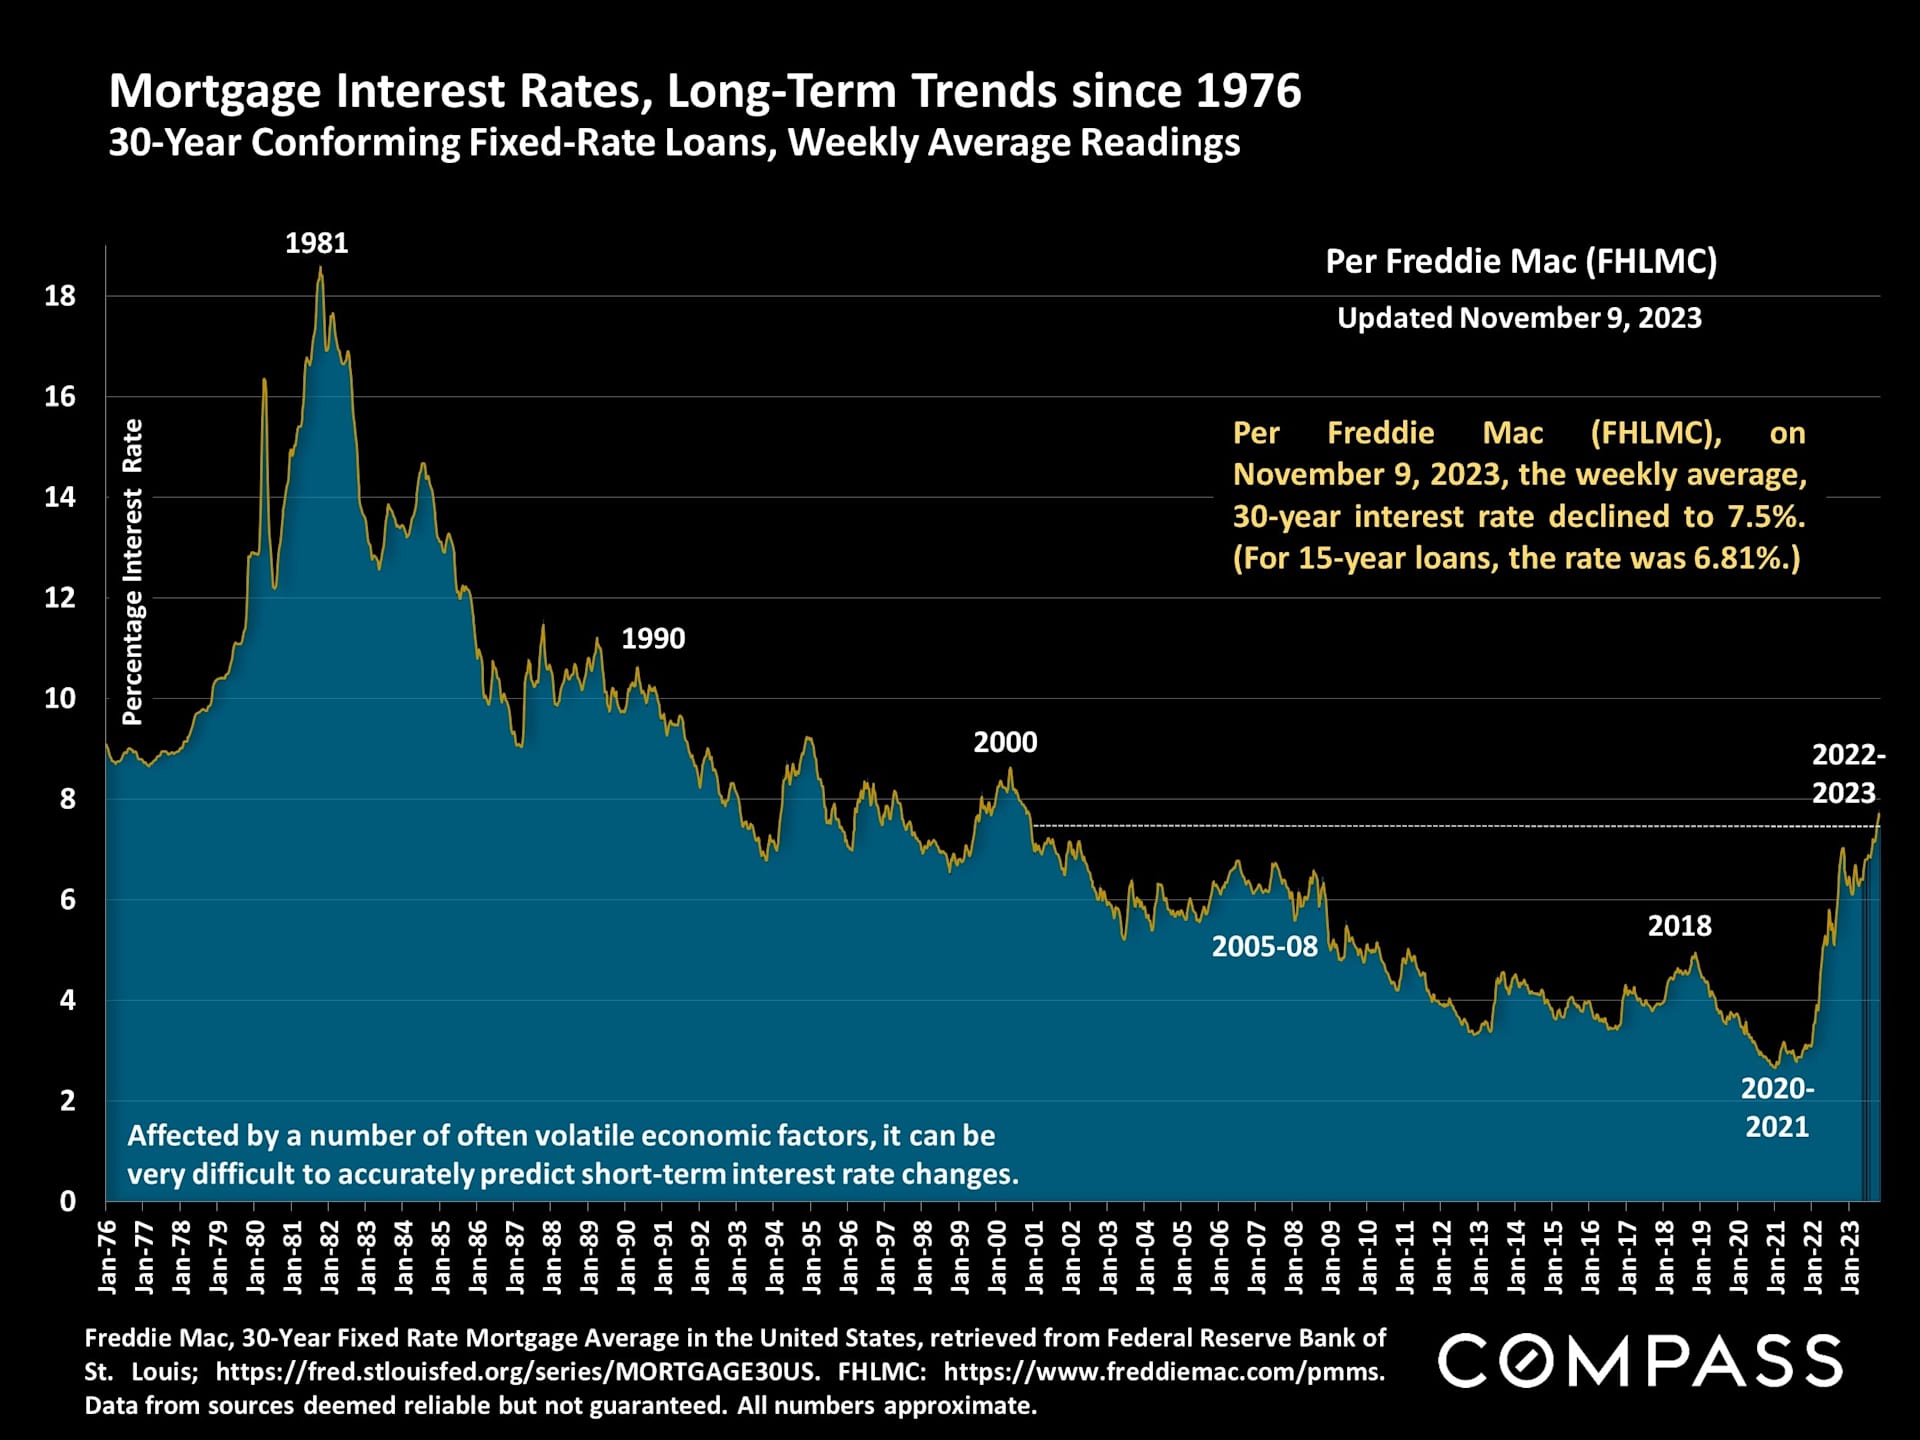
In the first 3 days of November, daily average 30-year interest rates suddenly plunged to 7.38% after hovering about 8%, but as of the daily reading on Nov. 9th (7.41% per Mortgage News Daily), they've barely changed since. Below are 2 charts - short-term and long-term - based on the weekly average rate published by Freddie Mac. (The daily rate chart through 11/3 was included in the November Bay Area newsletters announced on Tuesday.)
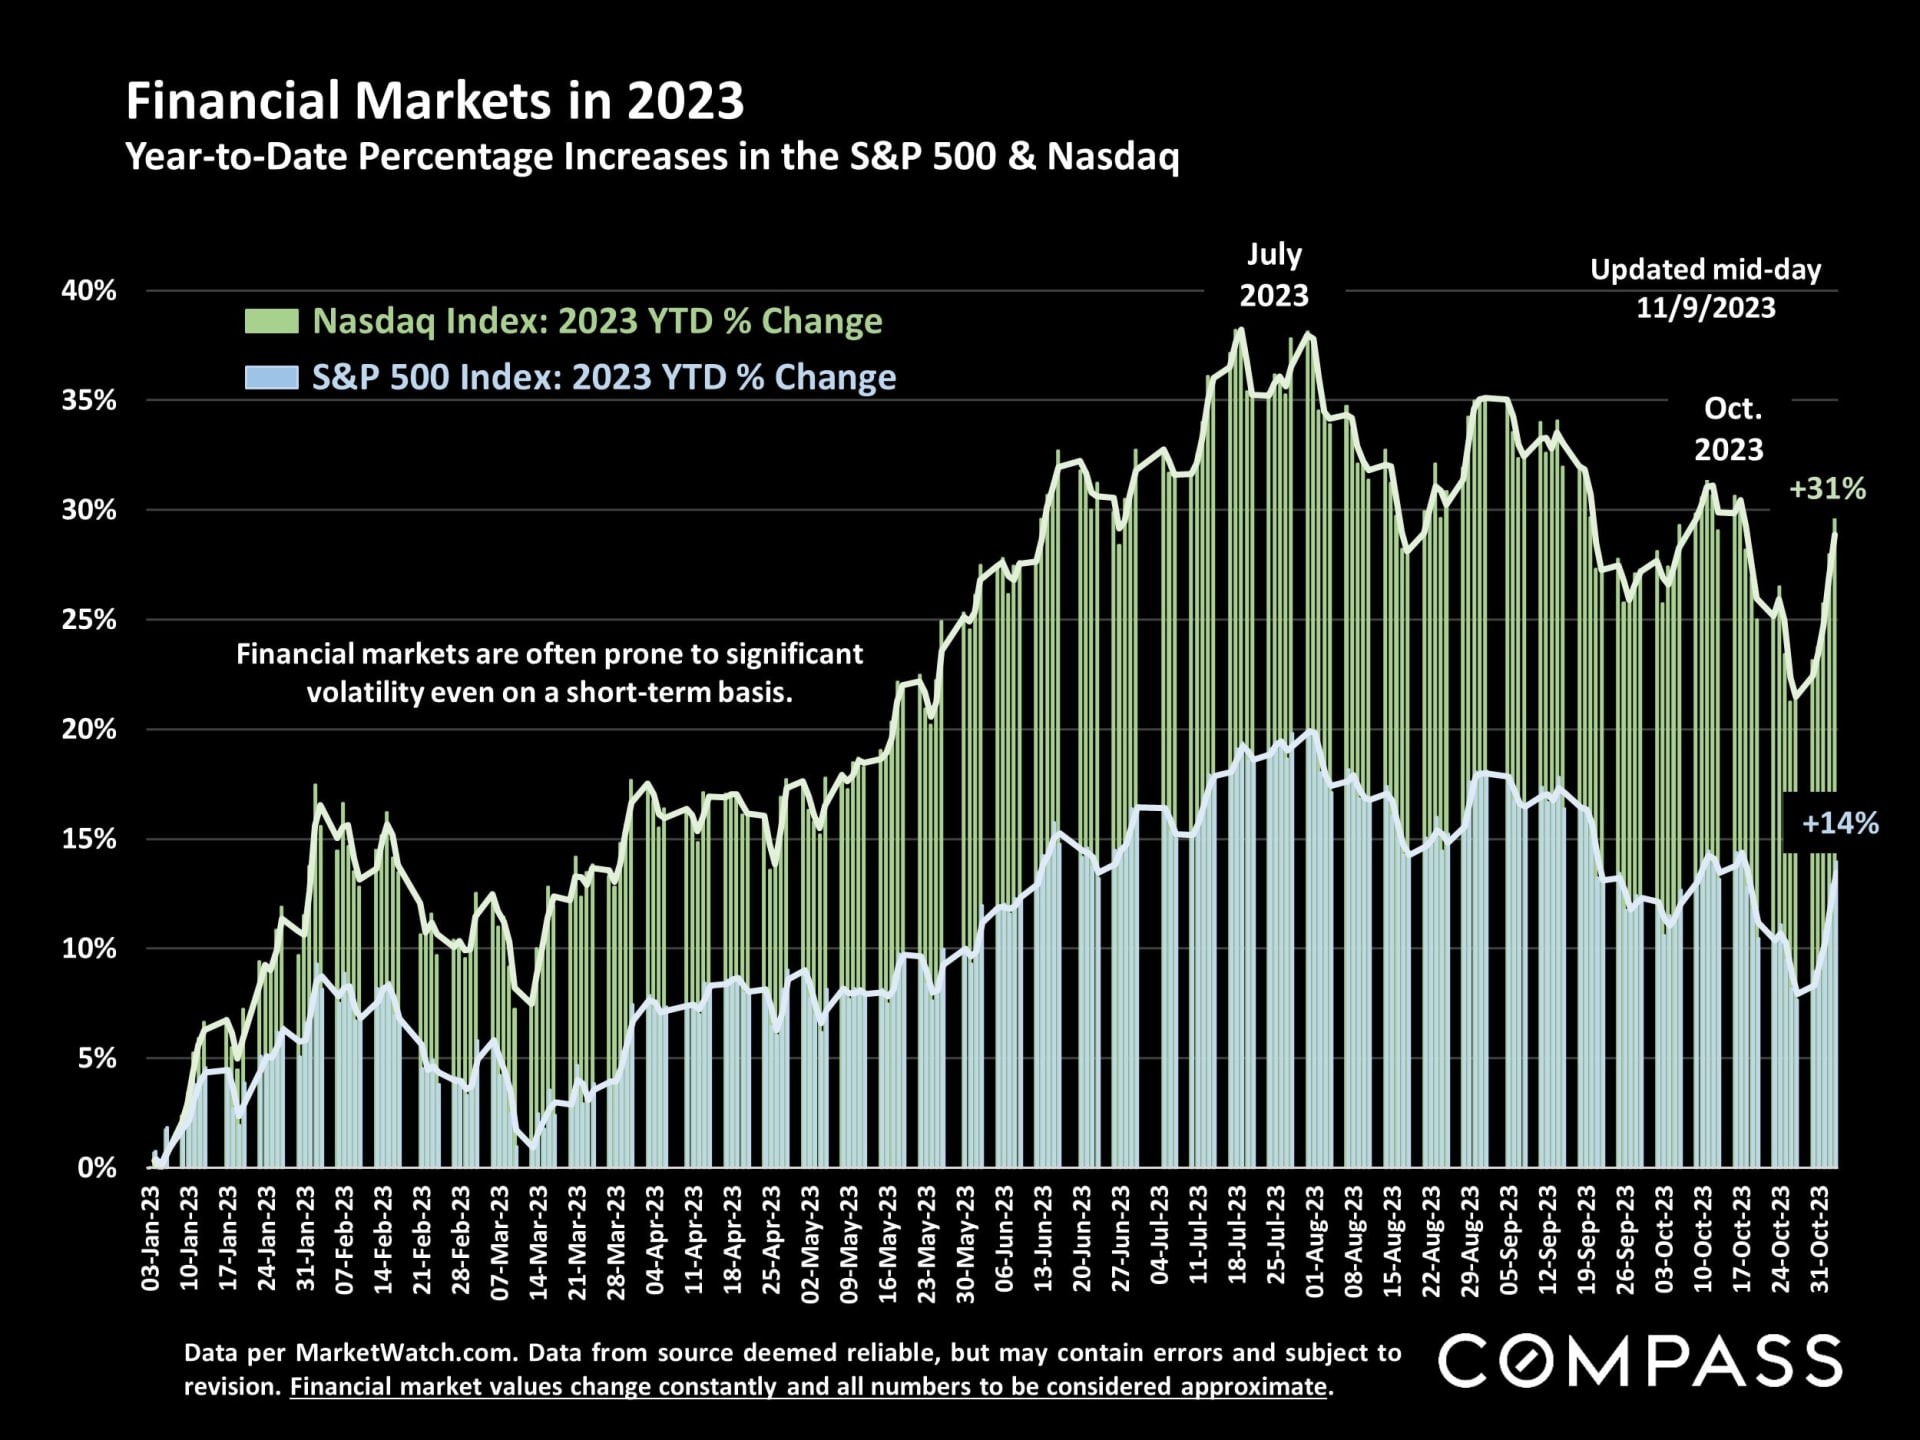
Though a little down so far yesterday, stock markets have seen a big rebound since late October after their big decline in most of that month. Note that the percentages highlighted refer to year-to-date changes.
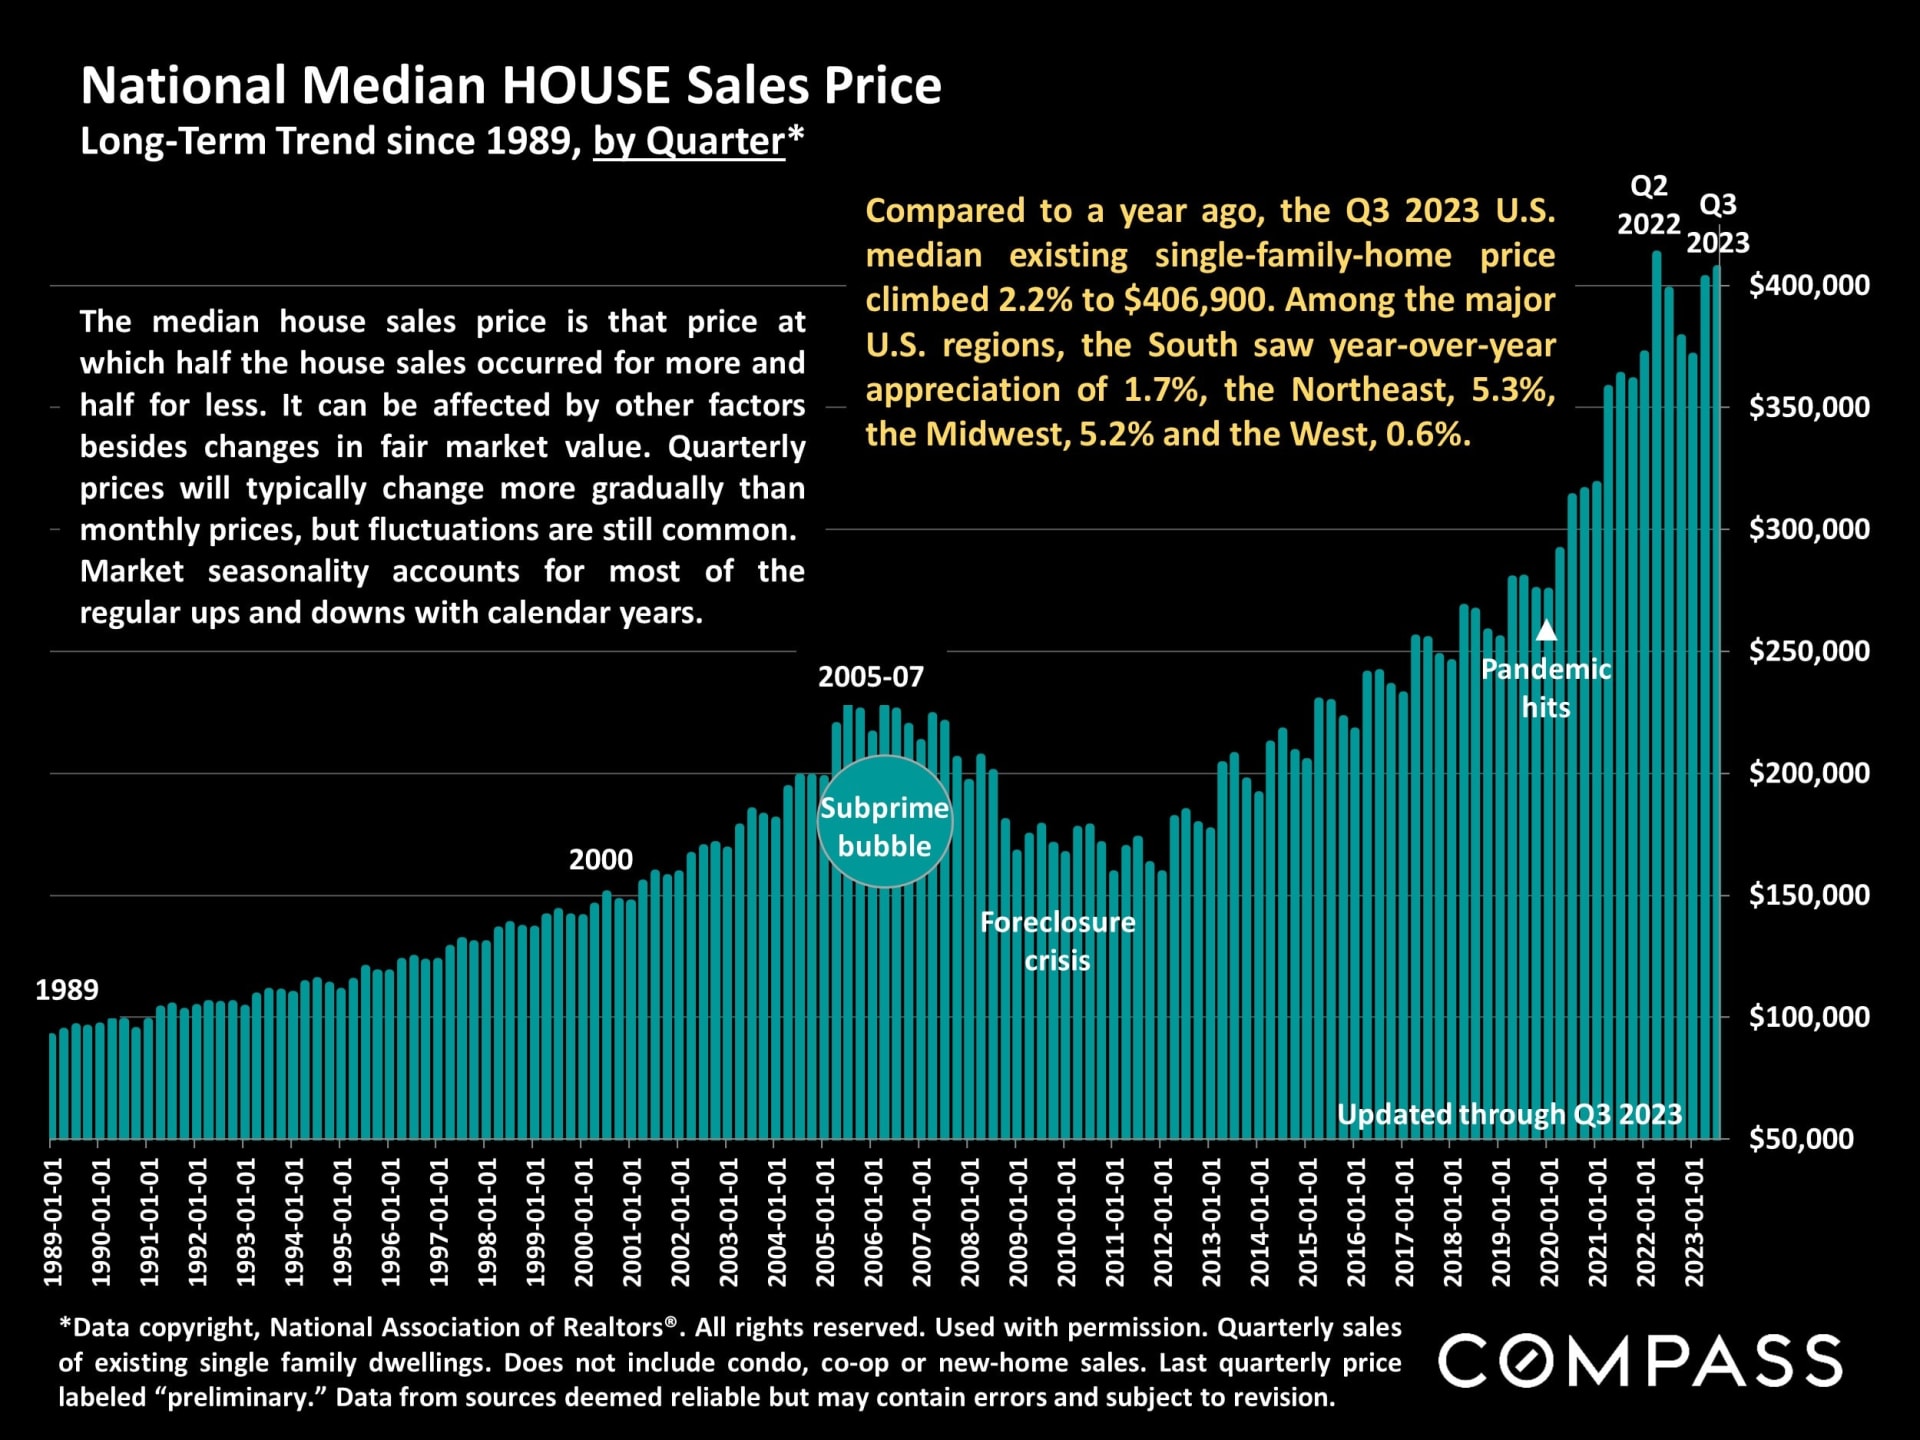
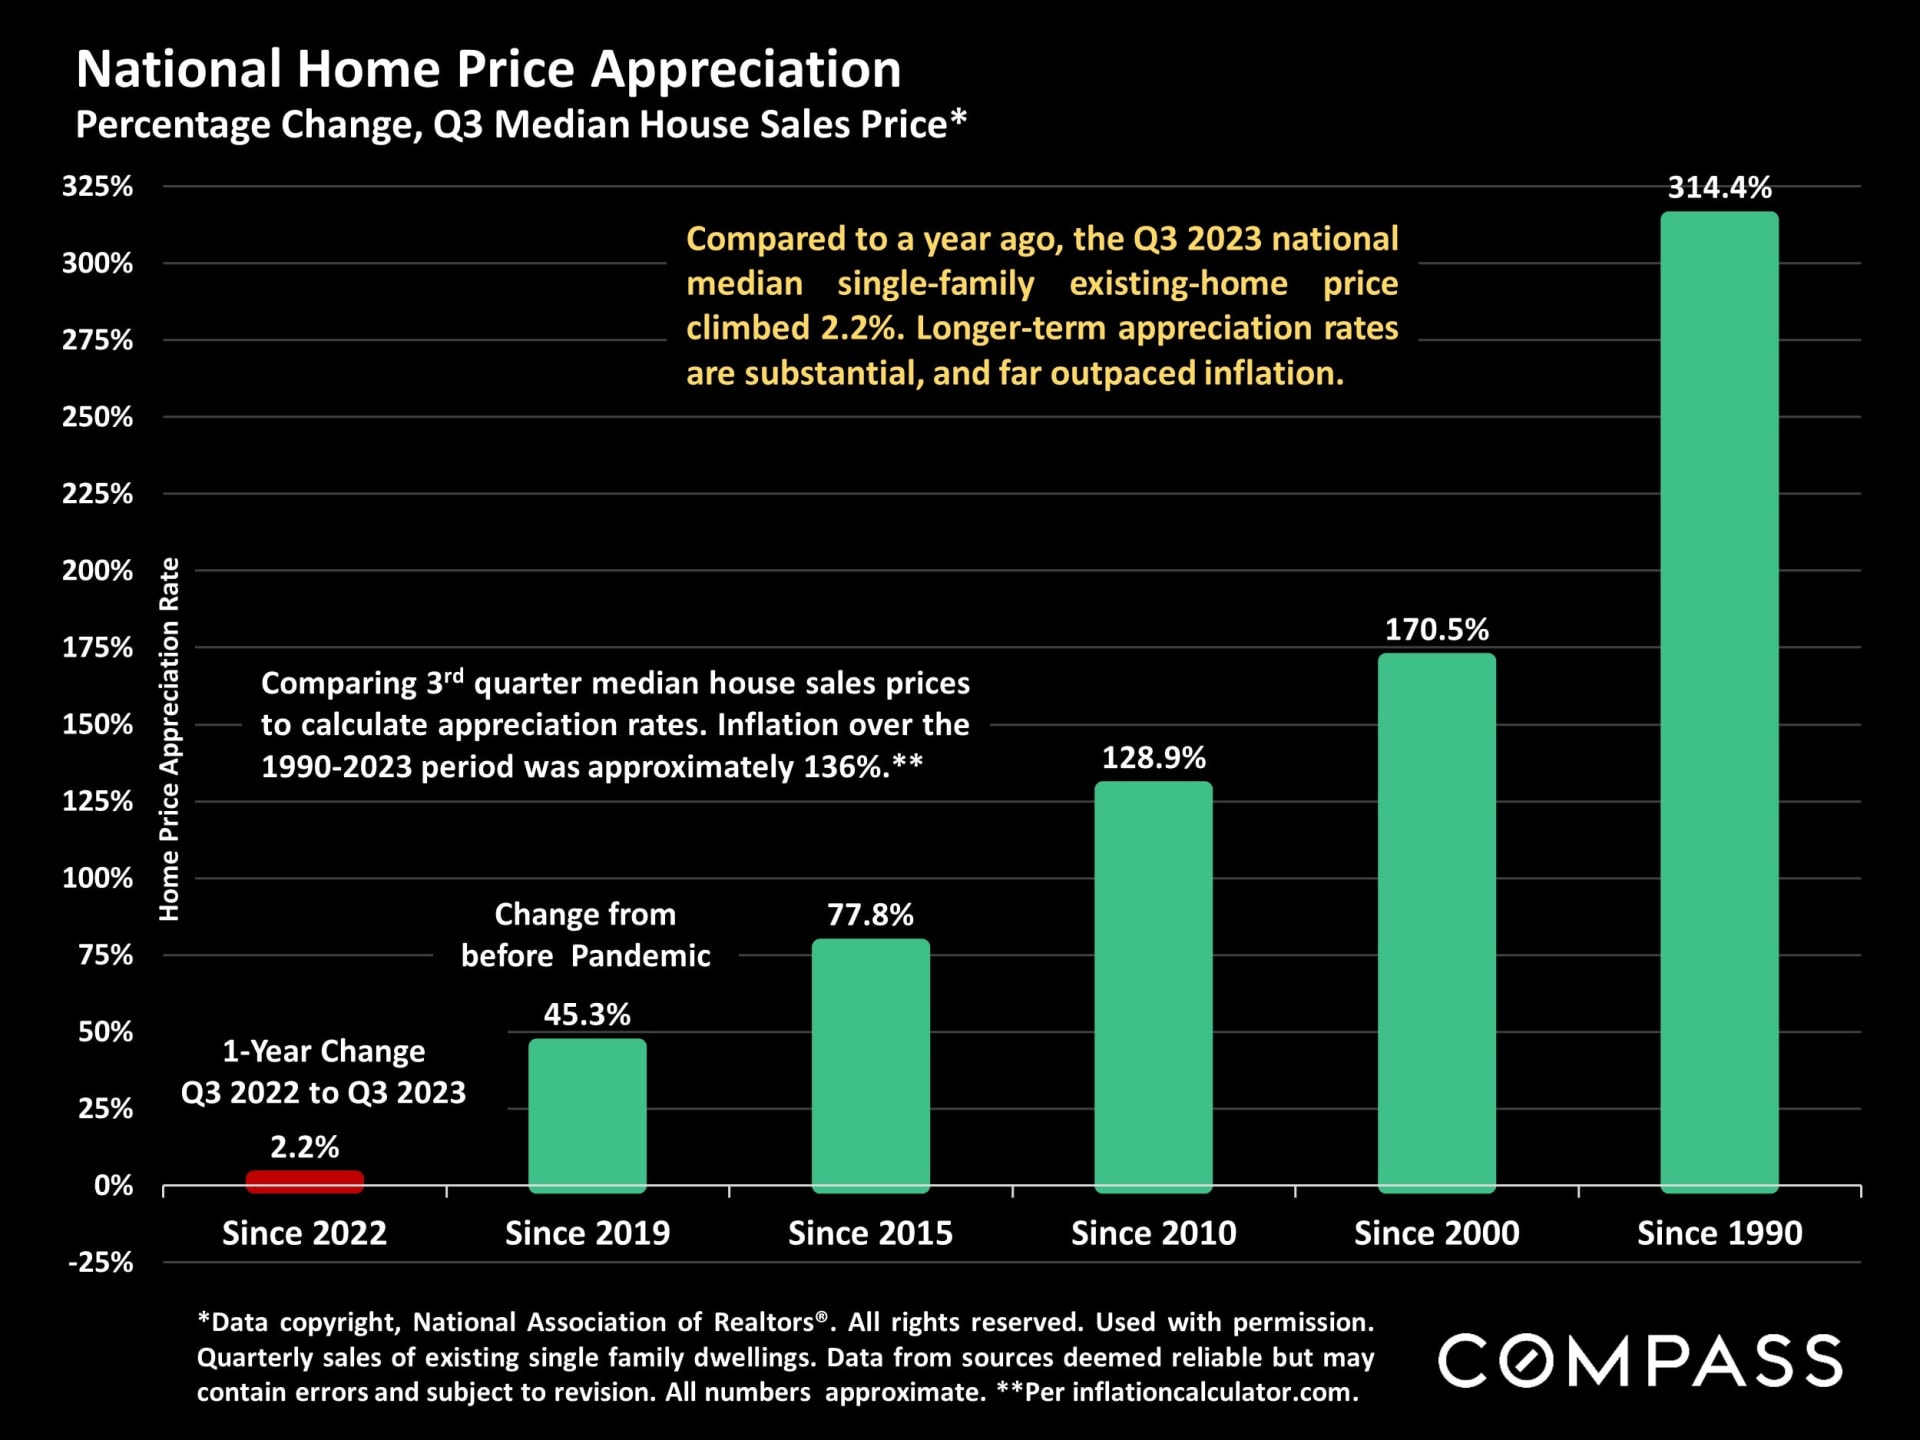
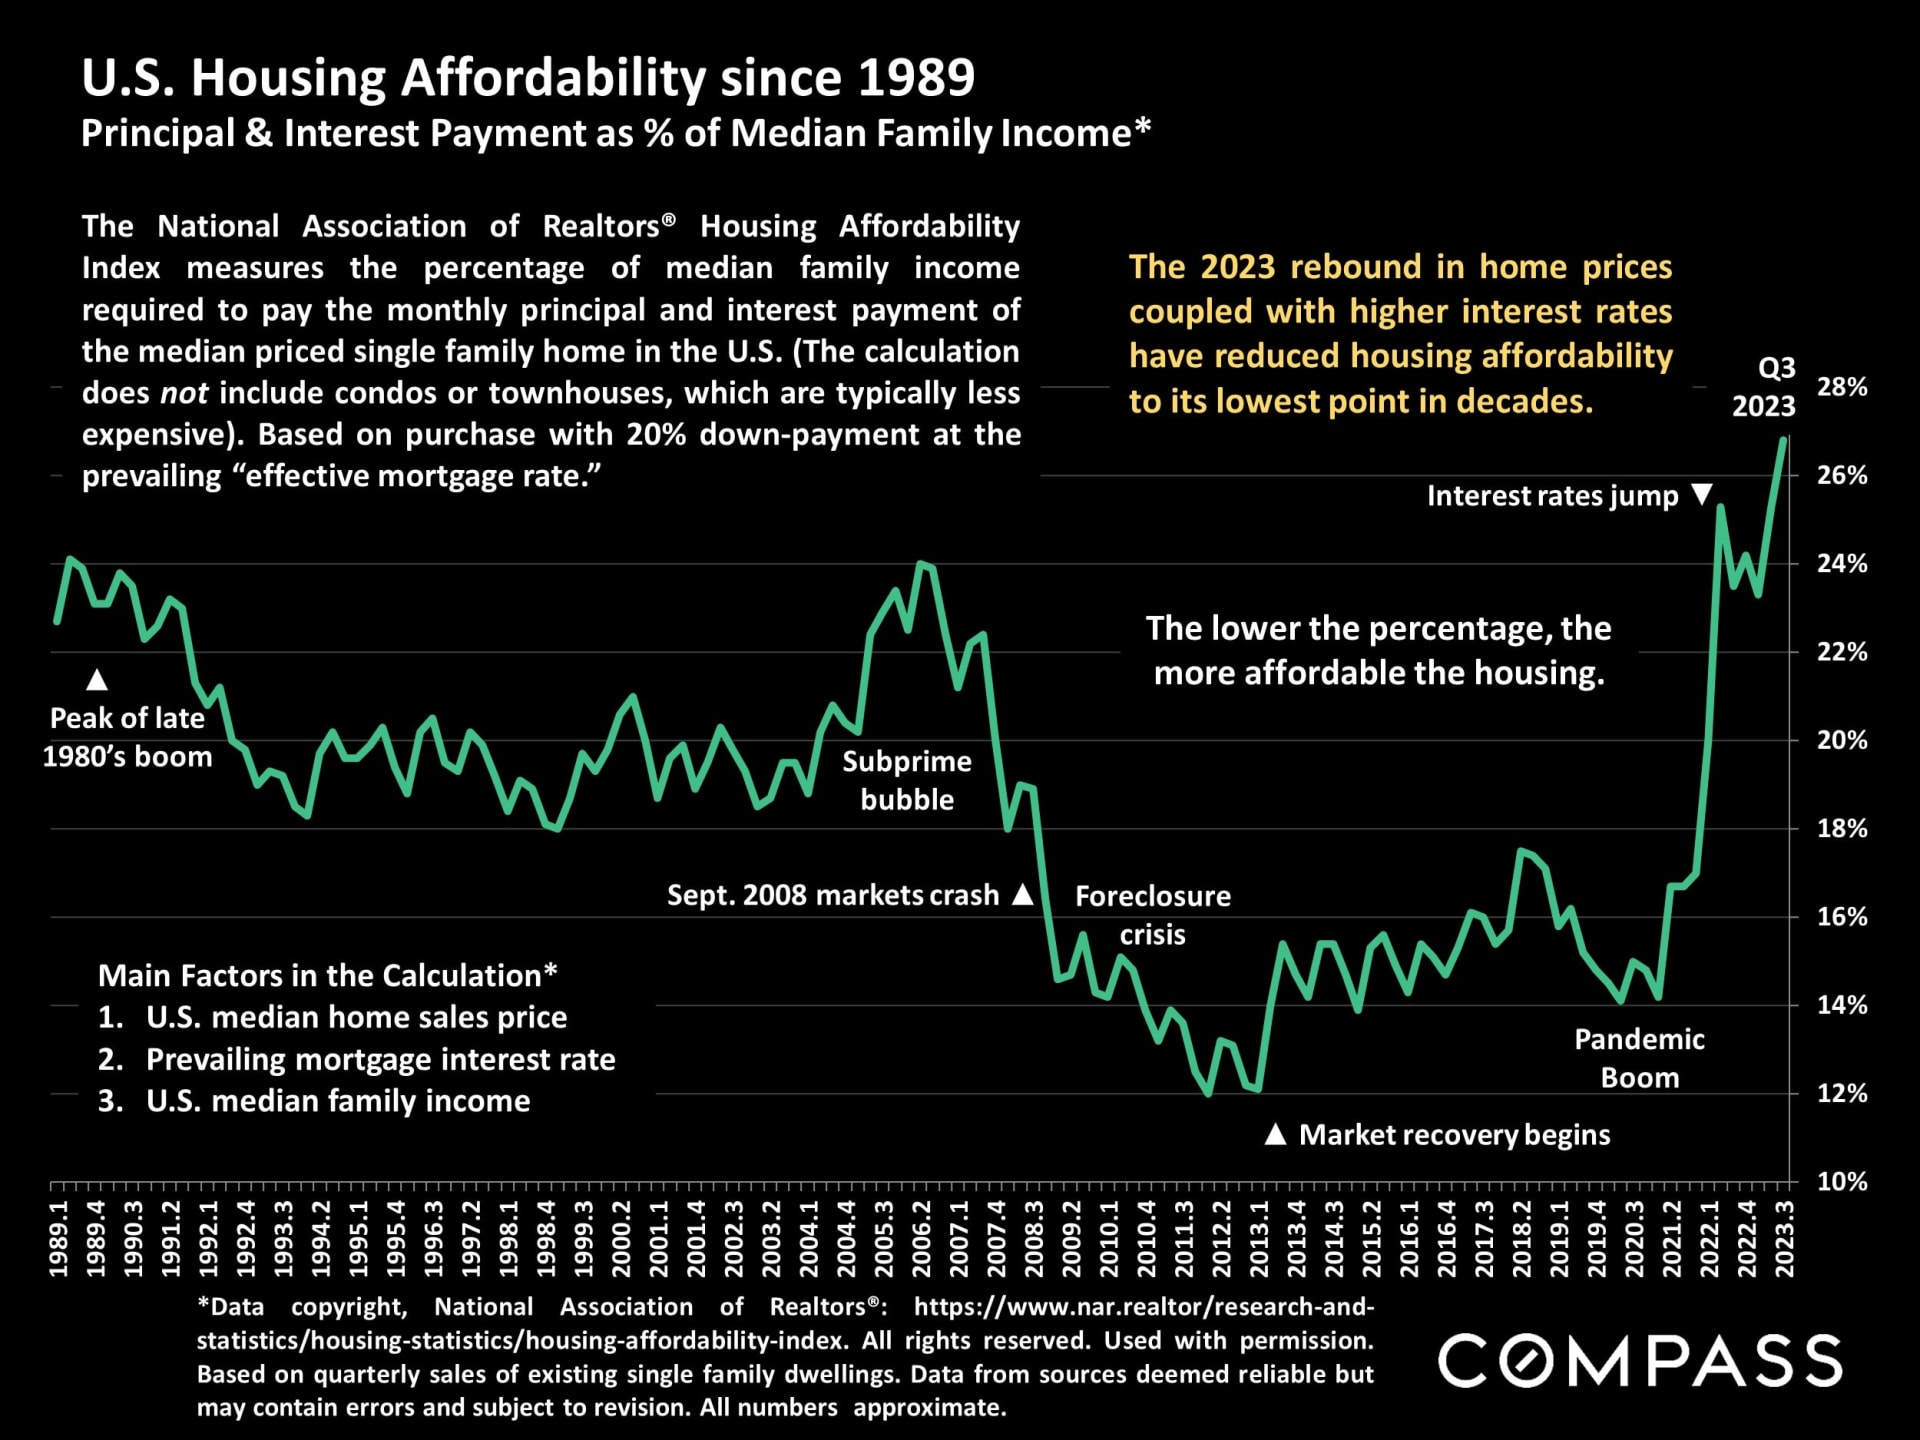
NAR published Q3 national statistics yesterday morning. Below is the national existing single-family-dwelling median sales price since 1989, which is up 2.2% year over year, and then appreciation rates over various periods of time.
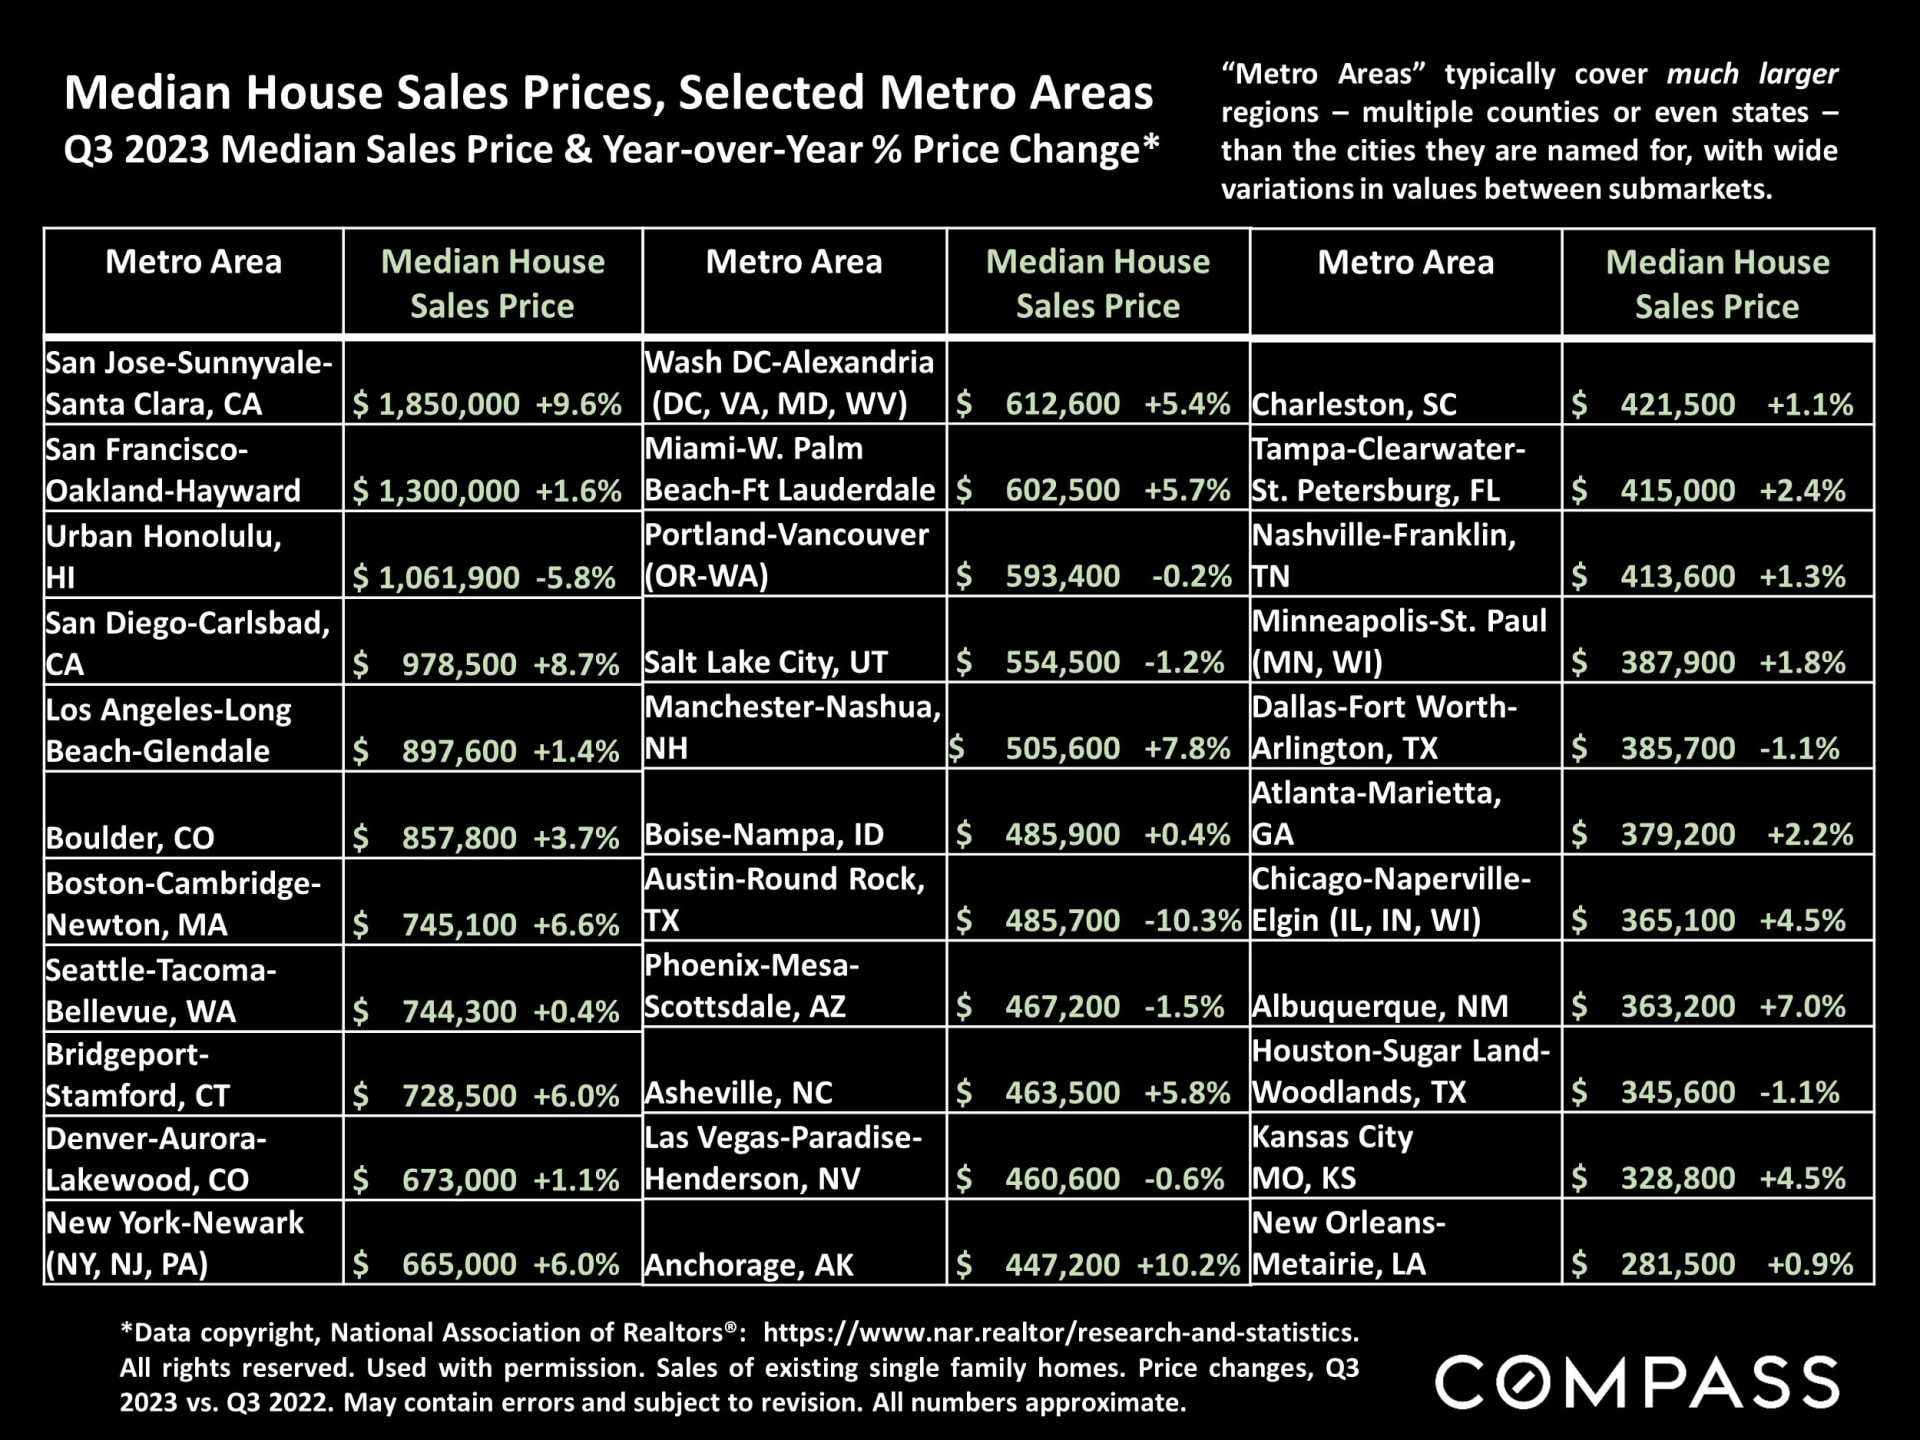
Metro-Area prices and year-over-year appreciation rates: "More than 80% of metro markets (182 out of 221) posted [year-over-year] home price gains in the third quarter of 2023...Year-over-year prices in the third quarter retreated by 10.3% in Austin, 1.5% in Phoenix, 1.2% in Salt Lake City and 1.1% in both Dallas and Houston. However, prices rose by 9.6% in San Jose, 8.7% in both Anaheim and San Diego, 6.6% in Boston and 5.7% in Miami." Note that metro areas typically cover much wider regions than just the cities they are named for - for example the San Francisco-Oakland-Hayward metro area includes SF, Alameda, Contra Costa, Marin & San Mateo Counties (with the 2 east bay counties dominating sales volumes). The San Jose metro includes Santa Clara and San Benito Counties (and is utterly dominated by Santa Clara sales).
Eight of the top 10 most expensive markets in the U.S. were in California, though not all are included on this table.
U.S. Housing affordability: "Housing affordability worsened in the third quarter because of increasing home prices and mortgage rates. Families typically spent 26.8% of their income on mortgage payments, up from 25.3% in the prior quarter and 23.5% one year ago."
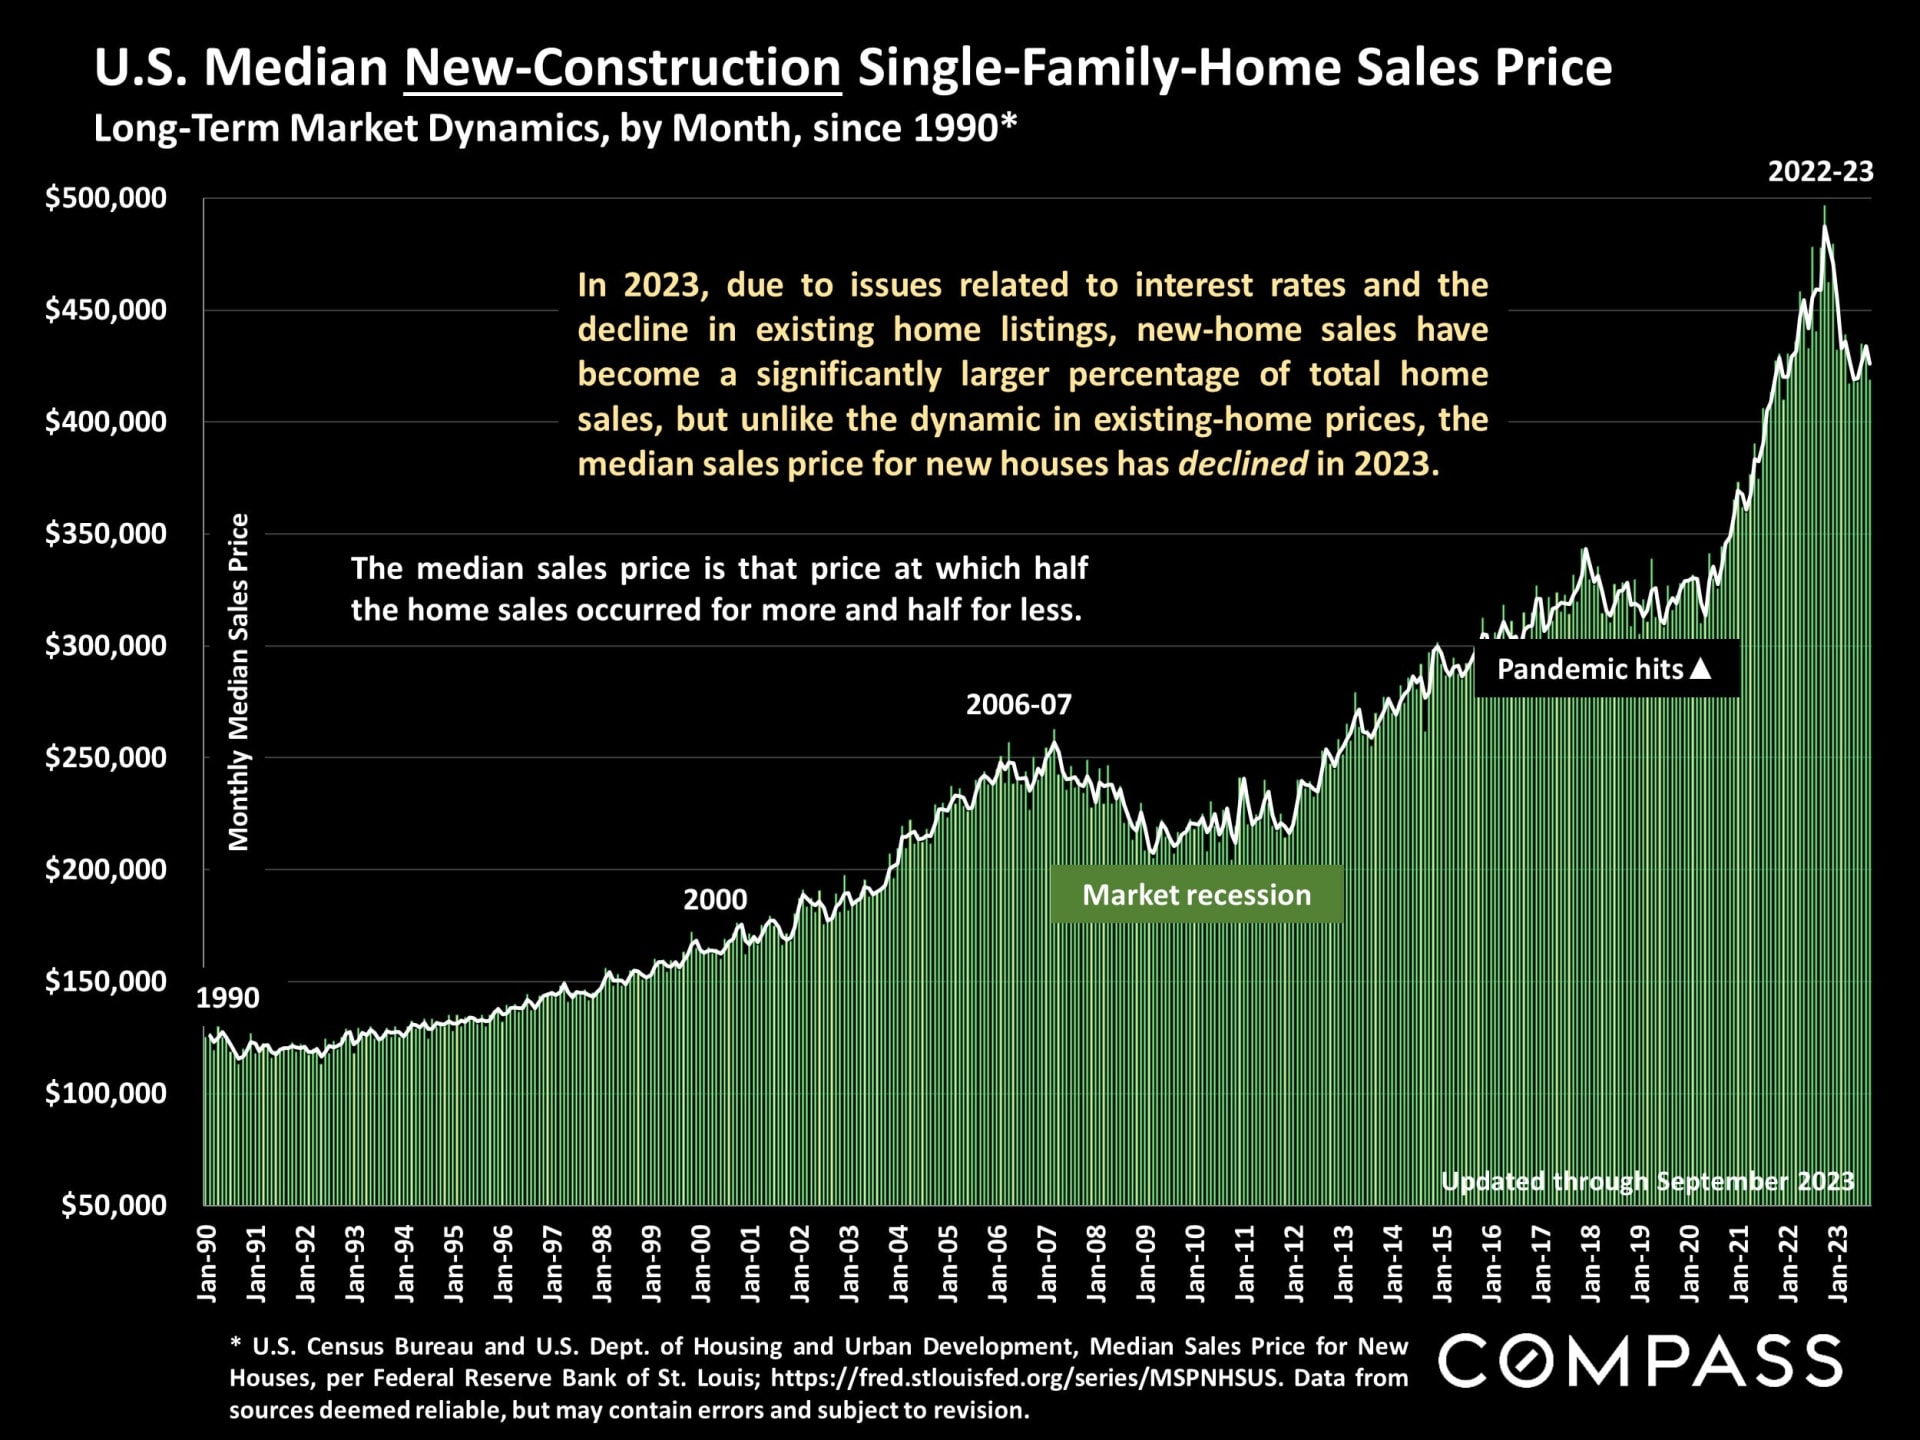
New-home prices: Median prices for new-construction homes have fallen in 2023, even as their percentage of total national sales has increased due to the huge drop in resale listings. Part of this may be a change in either 1) where most of the new homes are being constructed and sold, and 2) the median size of homes being built. Or it may simply have to do with builders dealing with the increase in interest rates by reducing their prices.