The Lurie Group
San Francisco 2022 October Real Estate Report

San Francisco 2022 October Real Estate Report

  • Alexander Lurie
  • October 17, 2022

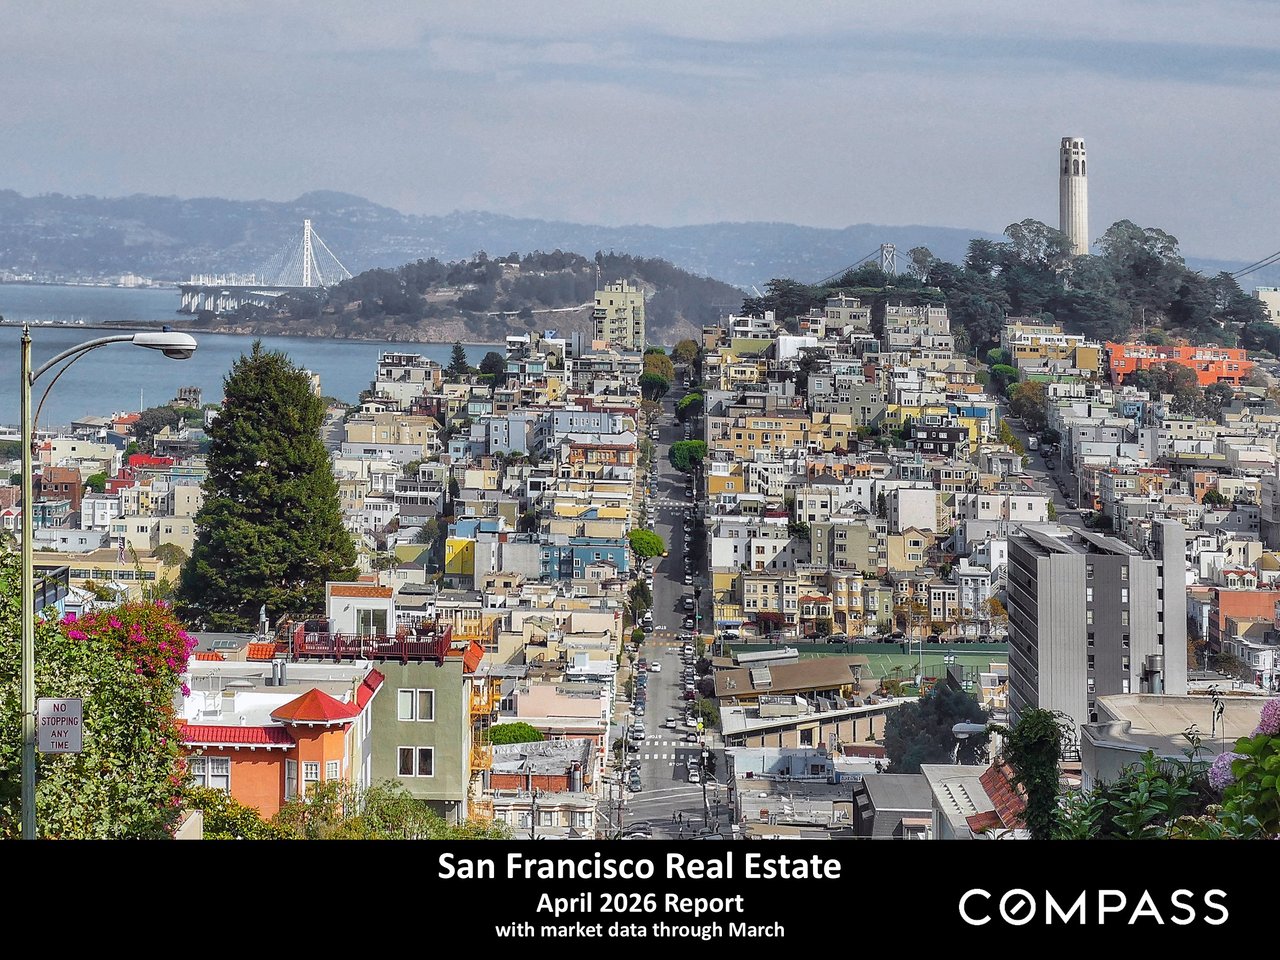
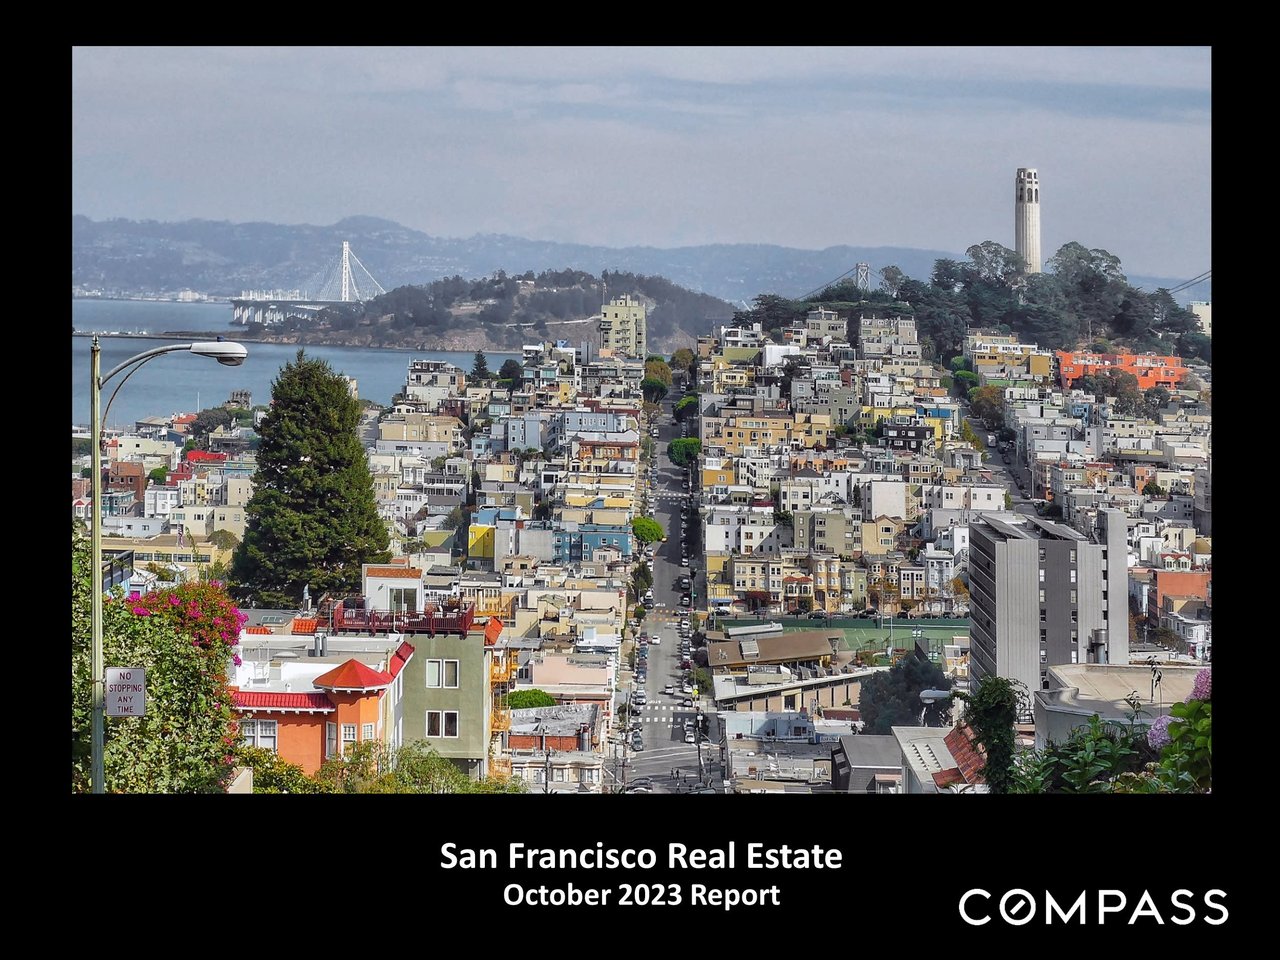
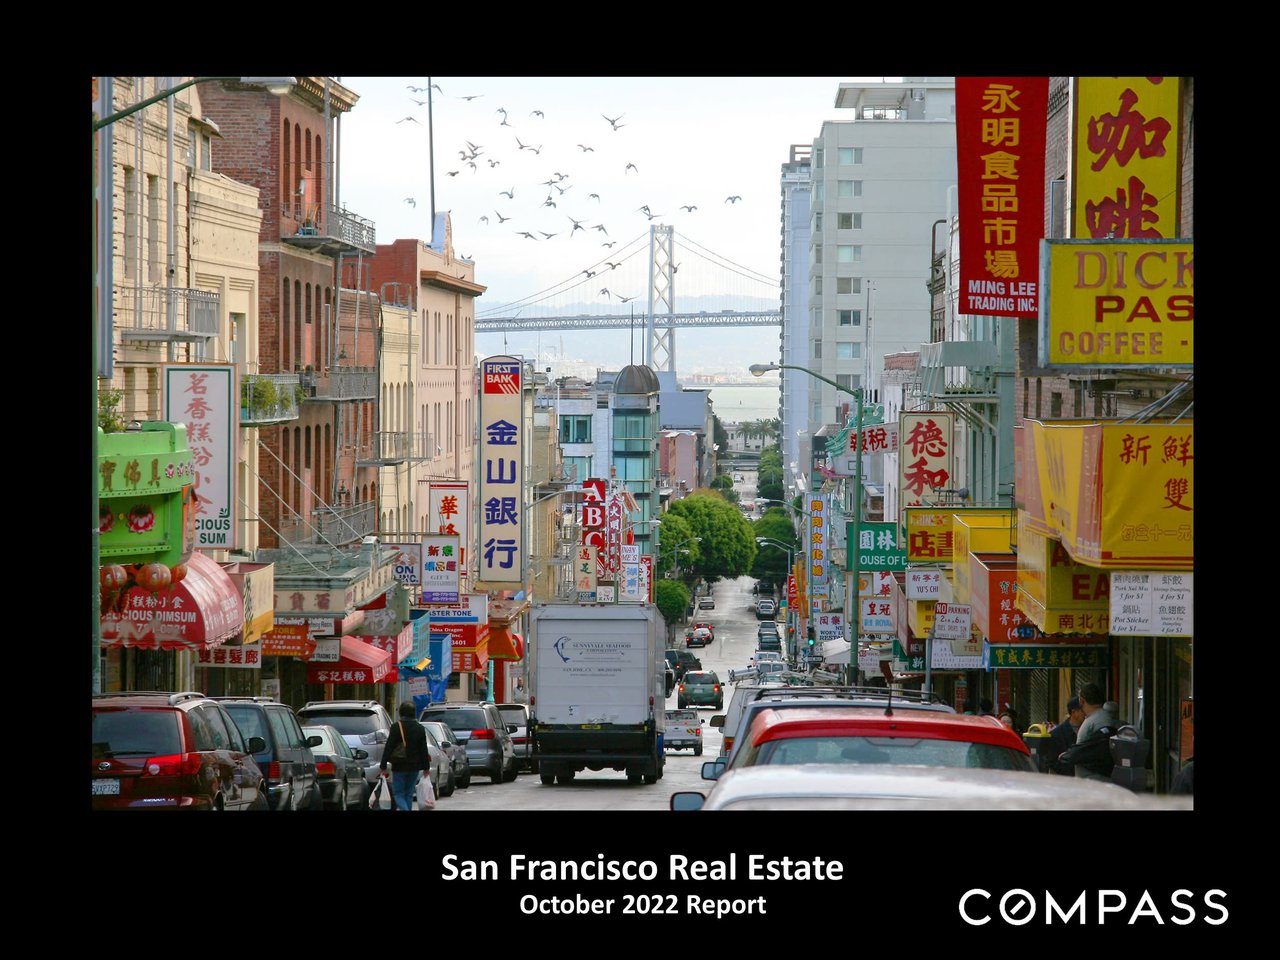
San Francisco Real Estate
October 2022 Report


Virtually across the Bay Area, Q3 median sales prices retreated dramatically from their spring peaks, and SF was hit harder than most area markets. Part of this was due to seasonal trends – median sales prices often peak for the calendar year in Q2, then drop in summer – but part of the decline was clearly due to changing market conditions prompted by shifts in interest rates, inflation, stock markets, and consumer confidence. In this report, home prices will be reviewed from a variety of angles to provide greater context. On the supply and demand side, it appears that after the big drop in demand in early-mid summer, conditions have mostly stabilized: Generally speaking, sales numbers are no longer appreciably dropping, though overbidding statistics continue to decline and days on market to climb.

When looking at recent market changes, it is important to remember how overheated the market was in 2021 and early 2022 – many quarter-to-quarter, and year-over-year comparisons are distorted by the unusual (sometimes frenzied) conditions that prevailed then. It is also wise not to jump to definitive conclusions based upon a single quarter’s data: The economy and real estate market are still in a period of adjustment.

Comparisons with the crash of 2008 continue to be made, but the precipitating factor in the 2008 crash – tens of millions of households talked into home loans they could never afford, forcing a tsunami of frantic sales during the great recession – simply does not apply today. Mortgage payments as a percentage of income, and loan delinquency rates are both close to all-time lows; most homeowners’ mortgages are held at historically low rates. There has been no surge of desperate sellers: New listing numbers are actually down from last year. Stock market declines, though substantial, cannot compare with those seen in 2008-2009, and employment remains very strong. This is not to minimize the correction the market is going through: There are certainly major economic and demographic challenges at play right now, but a market correction is not a crash, being more like a slow leak in an over-pressurized tire than a blowout on the highway at high speed.

The relatively short autumn selling season began after Labor Day and runs through mid-November. The mid-
winter holiday slowdown then runs through mid-January. Though sales continue in every month of the year,
listing and sale activity drops dramatically as we near Thanksgiving. Slower markets can offer opportunities to buyers, but the selection of homes for sale usually tumbles.

Our reports are not intended to convince you regarding a course of action or to predict the
future, but to provide, to the best of our ability, straightforward information and good-faith
analysis to assist you in making your own informed decisions. Statistics should be considered
very general indicators, and all numbers should be considered approximate. How they apply to
any particular property is unknown without a specific comparative market analysis.

San Francisco Real Estate October 2022 Report

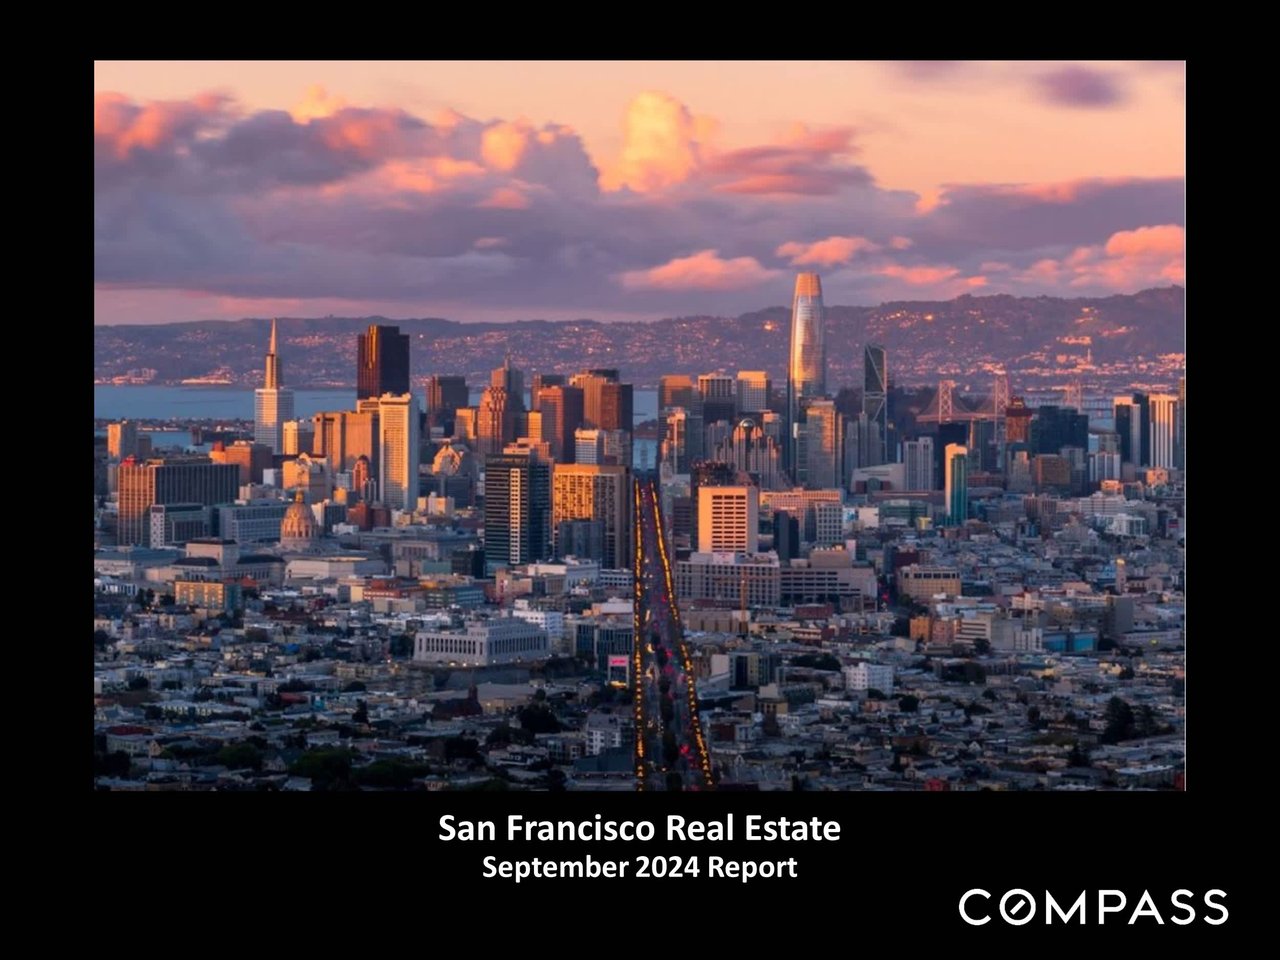
San Francisco real estate report discussing Q3 price declines, market conditions, and seasonal sales trends.
Bar chart of U.S. single-family mortgage delinquency rates, 1991–Q2 2022, with the 2008–2012 crisis highlighted.

San Francisco quarterly median house prices, shown in a rising green bar chart from 2012 through Q3 2022.

Bar chart of San Francisco quarterly house price changes, falling to -9% in Q3 2022.

Chart of San Francisco median condo prices by quarter, 2012–2022, with Q3 bars highlighted.

Chart of San Francisco quarterly condo price changes from 2020 to 2022, peaking at 11% in Q4 2021.

Chart of quarterly median home sale prices from Q1 2020 to Q3 2022 across five San Francisco district markets.
San Francisco quarterly median home sale price chart for three district groups, Q1 2020 through Q3 2022.

Chart of San Francisco quarterly median house prices by bedroom count, with Q3 2022 year-over-year declines.

Chart of San Francisco condo median prices by bedroom count, showing Q3 2022 year-over-year declines.

Chart comparing San Francisco new listings in 2021 and 2022, with September totals of 1,074 and 900.

Bar chart of San Francisco active and coming-soon listings, rising to 1,558 in October 2022.

San Francisco active house and condo listings, monthly from 2018 to 2022, with inventory trends and pandemic annotations.

San Francisco chart compares monthly listings going into contract in 2021 and 2022, showing a 27% year-over-year September decline.

Chart comparing quarterly San Francisco condo, co-op, TIC, and house sales volumes from 2018 through Q3 2022.

Chart of San Francisco monthly home sales, 2019–2022, showing seasonal trends and a spring 2021 peak.

Chart comparing price-reduced San Francisco condo and house sales from January to September 2022.

Chart of San Francisco active-listing price reductions, showing monthly counts from January 2018 to September 2022.

Chart of quarterly San Francisco high-priced house and condo sales from 2018 to Q3 2022.

Chart of San Francisco luxury home sales by district and price range, with Pacific Heights, Cow Hollow and Marina leading.

San Francisco luxury condo sales by district and price segment, autumn 2022.

Chart compares quarterly San Francisco home and condo absorption rates from 2019 to 2022, with both trends declining in 2022.

Chart compares the percentages of San Francisco houses and condos selling over list price by quarter, 2018–2022.

San Francisco quarterly house and condo sale-to-list percentages, 2018–2022, with a sharp decline in Q3 2022.

San Francisco quarterly average days on market chart comparing houses and condos from 2019 through Q3 2022.

Real estate statistics explanations and Compass report disclaimer.


Alexander Lurie smiling in a dark blazer and striped shirt.

Meet Alexander

Meet Alexander Lurie

Alexander Fromm Lurie is a highly accomplished San Francisco real estate professional and the leader of The Lurie Group, a top-performing team recognized among the top 1% of agents in the city. With over a decade of experience in the real estate industry and California DRE License #01952347, Alexander has built a reputation for delivering exceptional results, with hundreds of homes sold and over $1 billion in total sales volume. Born and raised in San Francisco, he brings deep local expertise, generational knowledge of the Bay Area, and a strong connection to the community into every client relationship. His approach goes beyond transactions—focusing on helping clients build meaningful connections to neighborhoods, schools, and local culture while navigating the buying or selling process with confidence.

Alexander’s background in management consulting and entrepreneurship further strengthens his strategic approach to real estate, allowing him to provide clients with a competitive edge in pricing, negotiation, and marketing. Known for his integrity, discretion, and client-first mindset, he continues to be a trusted advisor for buyers, sellers, and investors across San Francisco’s dynamic real estate market.

Alexander Lurie

Founder | Real Estate Advisor
LICENSE NUMBER
01952347
ADDRESS
629 Divisadero Ave, San Francisco, CA 94117

Let's Work Together

Our passion is supporting clients who value exceptional results and client care. We look forward to the opportunity to work together.
Modern condo living and dining area with a geometric chandelier and Bay Bridge views through large windows.
link
Follow Us