The Lurie Group
San Francisco 2024 April Real Estate Report

San Francisco 2024 April Real Estate Report

  • Alexander Lurie
  • April 13, 2024

San Francisco Real Estate
April 2024 Report

Q2 May See the Hottest Market
Since the Peak of the Pandemic Boom

Ever since the beginning of the year, and now moving into the spring selling season, striking
shifts in supply and demand have occurred and continued to accelerate, resulting in a
dramatic leap in the heat and competitiveness of market conditions. Based on current
indicators, and what is being experienced on the ground as new listings arrive on the
market, deals are negotiated, and homes go into contract, it appears almost certain that
significant home price increases will continue in Q2 2024.

Macroeconomic Conditions

In the 8 weeks through early April, the weekly average, 30-year conforming-loan interest
rate has oscillated between 6.74% and 6.94%: Up from January, but still well down from last
fall. In the last month, the S&P 500 & Nasdaq stock market indices continued to hit new all-
time highs, with substantial effects on household wealth. After the big jump in December-
January, consumer confidence is at its highest point in almost 3 years. Monthly inflation
rates have remained stable since October, ranging from 3.1% to 3.3%: Higher than the Fed’s
2% goal, but reductions in its benchmark rate later this year are still commonly expected.
Both the latest national and San Francisco unemployment readings, at 3.8%, remain close to
historic lows.

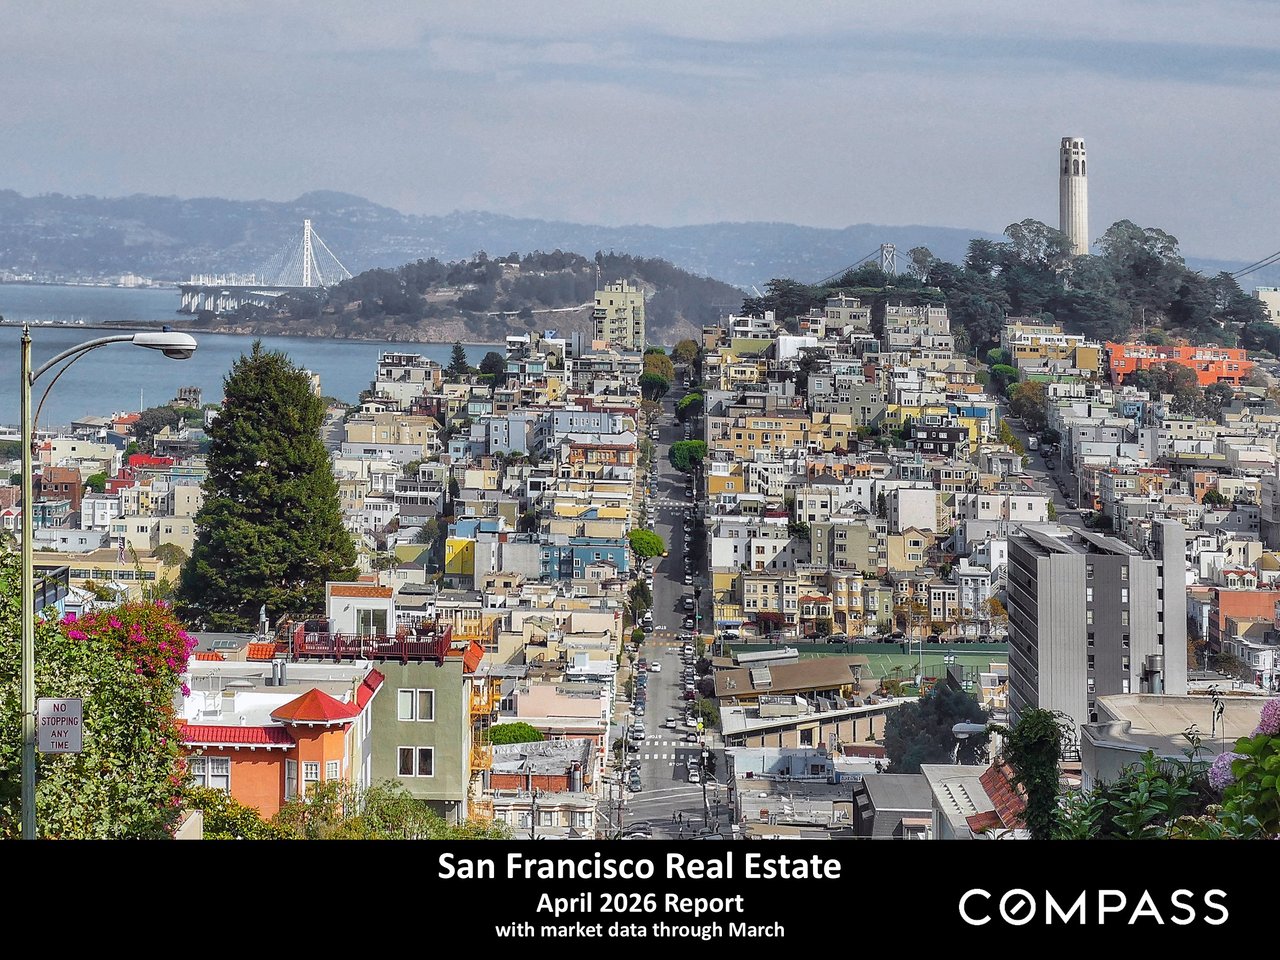
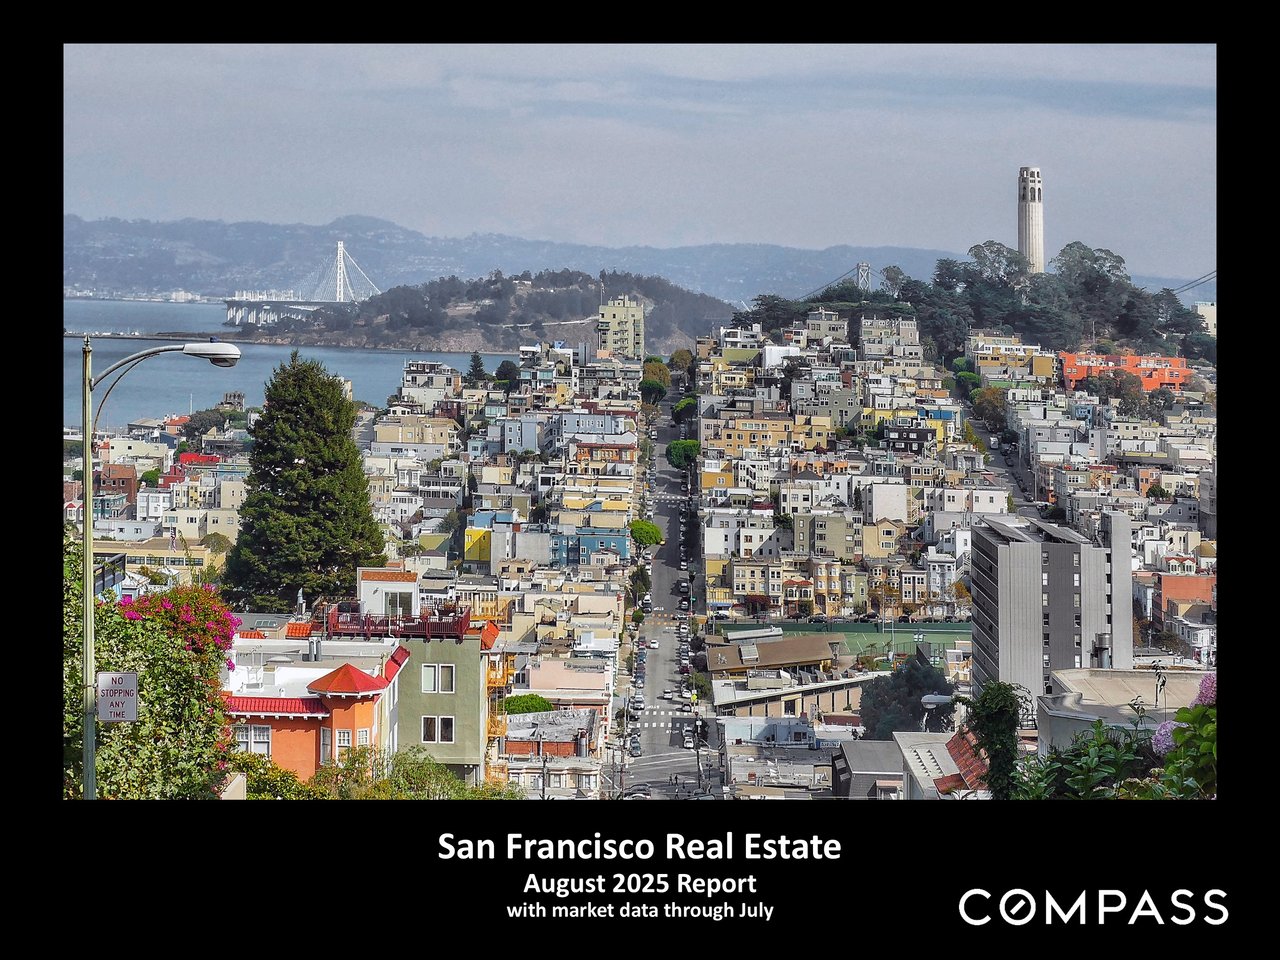
San Francisco market report discussing Q2 2024 home prices and macroeconomic conditions.

Chart of San Francisco listings going into contract, showing a sharp increase to about 470 in March 2024.

San Francisco monthly housing absorption chart, with house listings in yellow and condo and co-op rates in brown.

Chart of San Francisco quarterly median house prices from 2012 to Q1 2024, peaking in Q2 2022.

Chart of San Francisco condo prices by quarter, 2012–2024, with Q1 2024 prices up 3.5% year over year.

Chart of San Francisco condo prices from 2005 to March 2024, comparing downtown/SoMa with non-downtown areas.

Chart comparing San Francisco condo and house values per square foot from 2005 through March 2024.

Bay Area median house values by county, with the San Francisco row highlighted in a spring 2024 table.

Bay Area county home values by bedroom and bathroom count, early spring 2024.

Bay Area county table comparing early spring 2024 median condo and townhouse prices, square footage, and price per square foot.

Chart of San Francisco new listings from December 2019 to March 2024, showing seasonal peaks and a March 2024 increase.

Bar chart compares San Francisco active and coming-soon home listings from February 2022 through April 2024.

San Francisco residential market table comparing activity by price range and property type, with a note about heated second-quarter conditions.

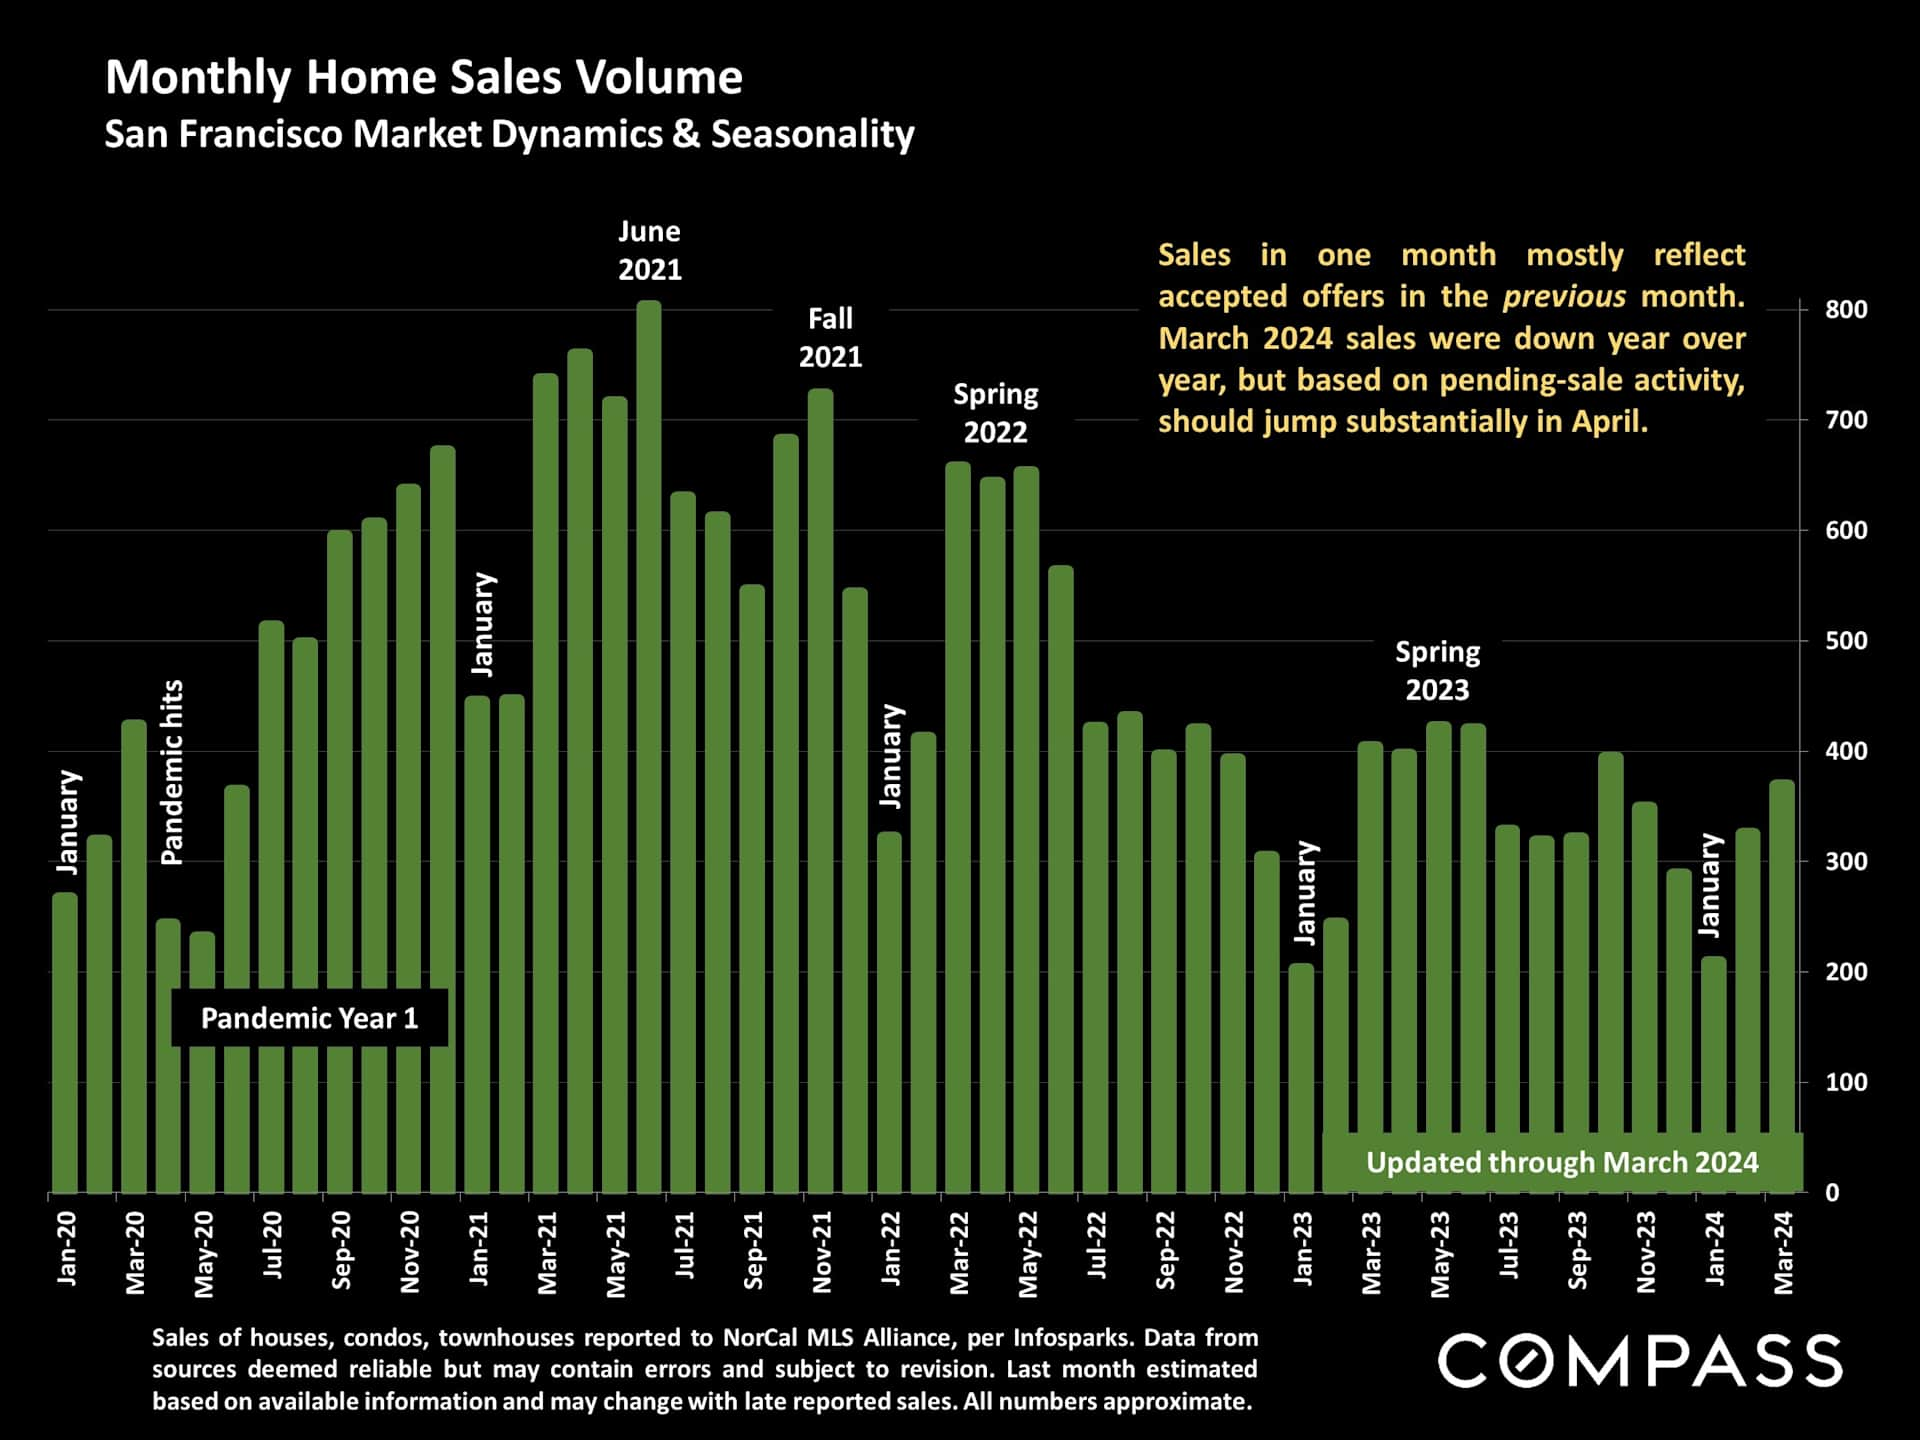
San Francisco monthly home sales chart from January 2020 to March 2024, with green bars and seasonal annotations.

Chart of San Francisco home sales over $3 million, showing monthly counts from 2020 through March 2024.

San Francisco days-on-market chart, 2020–March 2024: condos usually take longer to sell than houses, especially in spring.

Chart of San Francisco home sales over list price, showing seasonal fluctuations from 2020 to March 2024.

San Francisco chart compares house and condo sale prices with original list prices, January 2020–March 2024.

Bar chart of San Francisco active listing price reductions from January 2018 to March 2024, with October peaks highlighted.

Bar chart of San Francisco County median household income, rising from $55,761 in 2000 to $135,366 in 2022.

Chart of San Francisco population from 2010 to 2023, peaking in 2018 before declining after the pandemic.

Chart of San Francisco’s year-over-year population change, showing a sharp 2021 decline and a slight return to growth in 2023.

Chart of San Francisco employment from 2000 to February 2024, showing a sharp pandemic-era drop and subsequent recovery.

Chart of San Francisco residential rents from 1994 to 2024, with annotated market peaks, downturns, and recovery.

Real estate market statistics definitions and Compass report disclaimers.


Alexander Lurie smiling in a dark blazer and striped shirt.

Meet Alexander

Meet Alexander Lurie

Alexander Fromm Lurie is a highly accomplished San Francisco real estate professional and the leader of The Lurie Group, a top-performing team recognized among the top 1% of agents in the city. With over a decade of experience in the real estate industry and California DRE License #01952347, Alexander has built a reputation for delivering exceptional results, with hundreds of homes sold and over $1 billion in total sales volume. Born and raised in San Francisco, he brings deep local expertise, generational knowledge of the Bay Area, and a strong connection to the community into every client relationship. His approach goes beyond transactions—focusing on helping clients build meaningful connections to neighborhoods, schools, and local culture while navigating the buying or selling process with confidence.

Alexander’s background in management consulting and entrepreneurship further strengthens his strategic approach to real estate, allowing him to provide clients with a competitive edge in pricing, negotiation, and marketing. Known for his integrity, discretion, and client-first mindset, he continues to be a trusted advisor for buyers, sellers, and investors across San Francisco’s dynamic real estate market.

Alexander Lurie

Founder | Real Estate Advisor
LICENSE NUMBER
01952347
ADDRESS
629 Divisadero Ave, San Francisco, CA 94117

Let's Work Together

Our passion is supporting clients who value exceptional results and client care. We look forward to the opportunity to work together.
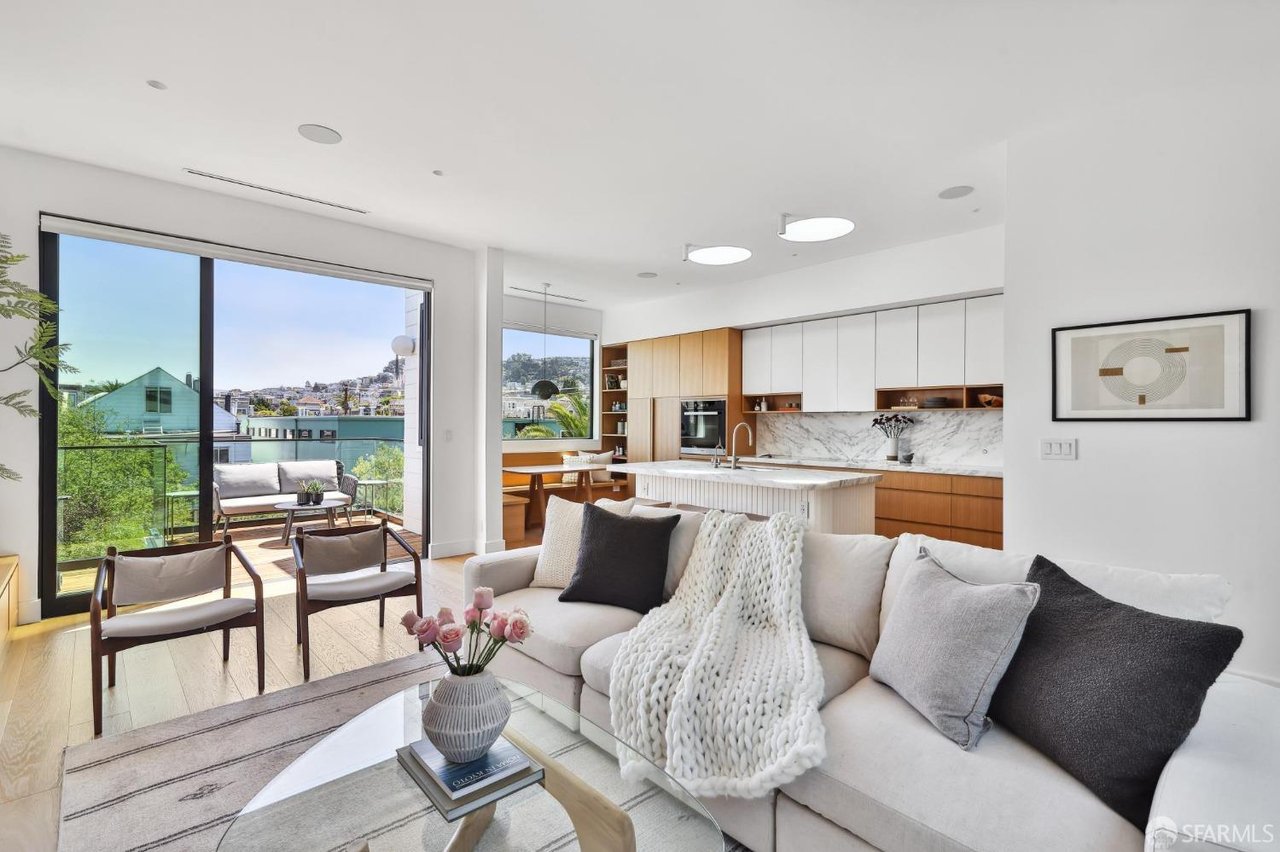
Modern condo living and dining area with a geometric chandelier and Bay Bridge views through large windows.

link
Follow Us