The Lurie Group
San Francisco 2023 April Real Estate Report

San Francisco 2023 April Real Estate Report

  • Alexander Lurie
  • April 14, 2023

The Market Continues to Recover, But with Many Dynamics at Play

Buyer demand continued to rebound from the depths of the mid-winter slowdown: The number
and percentage of listings going into contract, and overbidding percentages continued to climb,
and days-on-market to drop as the spring selling season gained traction. Buyers generally
shrugged off the local banking crisis, the main effect of which, so far, has been a significant drop in
interest rates in the 4 weeks after SVB collapsed and First Republic first came under pressure.

But though conditions have improved considerably, the market remains significantly weaker on a
year-over-year basis, and across the Bay Area, median home sales prices have declined. However,
it’s worth remembering that the market in Q1 2022 was severely overheated, and approaching the
peak of a historic, 10-year boom. This will distort many year-over-year comparisons.

The number of new listings coming on market continues to be extremely low, as many potential
sellers hold off from listing their homes due to the doubling of interest rates since early 2022: This
constitutes a huge factor in market dynamics and is undoubtedly holding back sales activity.

Across the Bay Area, year-over-year sales declines in the highest price segments have outpaced
drops for less expensive homes, and their demand-to-supply ratio – the number of sales compared
to the number of listings for sale – is much weaker. Luxury home sales have been hit harder since
the market correction began in mid-2022, though they too have been rebounding in 2023.

April, May & June sales volumes are commonly among the highest of the year, and this is
especially true for luxury home sales.

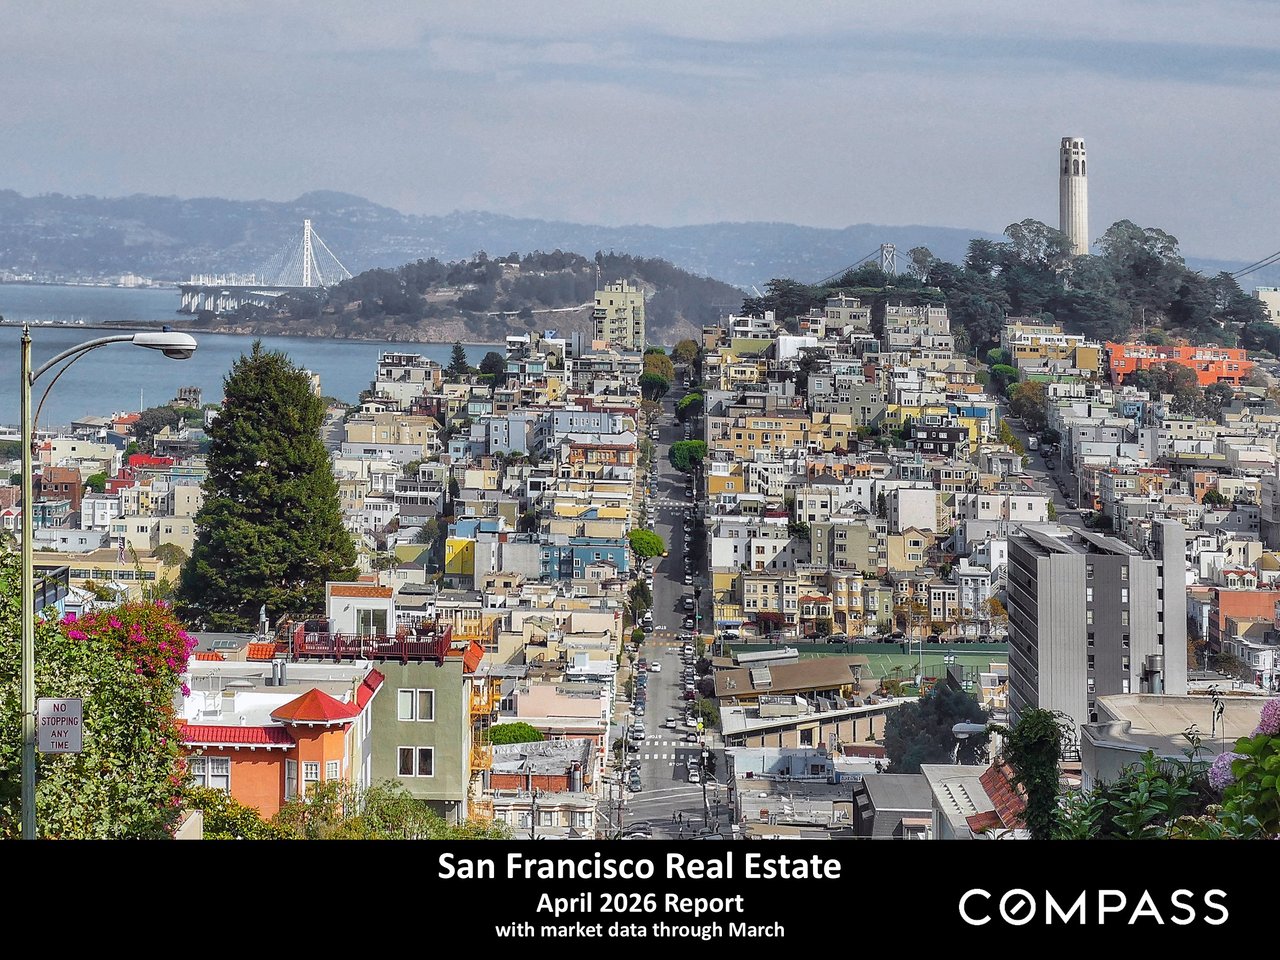
San Francisco real estate market update discussing recovering demand, declining prices, low listings, and luxury sales.

Bar chart of San Francisco median house prices by quarter, 2012–2023, showing an 18% year-over-year decline.

San Francisco condo prices by quarter, 2012–Q1 2023, in an orange bar chart.

San Francisco condo and house values per square foot, charted from 2012 to 2023 with a pandemic marker.

Chart of 30-year mortgage rates from January 2022 to April 2023, peaking above 7% in November 2022.

San Francisco monthly new-listing bar chart, December 2019–March 2023, with March columns highlighted for comparison.

Chart of San Francisco active and coming-soon listings, with monthly counts from February 2022 through April 2023.

San Francisco April 2023 real estate supply and demand table by price segment and property type.

Chart of San Francisco active listings from 2019 to March 2023, highlighting March counts and seasonal trends.

Bar chart of monthly San Francisco pending home listings, January 2019 to March 2023, with March columns highlighted.

Chart of San Francisco listings accepting offers, comparing houses with condos and co-ops from 2020 to 2023.

Bar chart of San Francisco monthly home sales volume from January 2019 through March 2023.

Bar chart of San Francisco $3 million-plus home sales, with monthly totals from 2019 to March 2023.

Line chart of Bay Area ultra-luxury home sales from January 2021 to March 2023, peaking at 155 in June 2021.

Bay Area large-home values by county infographic, comparing sale prices and property details in an early spring 2023 table.

Bay Area median house values by county, comparing three-bedroom, two-bath and four-bedroom, three-bath homes.

Bay Area median home values by county, comparing early spring 2023 condo and townhouse prices, sizes, and price per square foot.

Bar chart of San Francisco listing price reductions, with October peaks from 2018 to 2022 and a pandemic marker.

Chart of San Francisco home sales over list price, January 2018 to March 2023, with seasonal trends and pandemic marker.

Chart comparing San Francisco house and condo sale prices to original list prices from 2019 to 2023.

San Francisco average days on market chart comparing condos and houses from January 2019 to March 2023.

U.S. county map of 2021–2022 net domestic migration, with gains in blue and losses in orange.

Real estate report notes on statistics, valuation measures, and Compass disclaimers.
Alexander Lurie smiling in a dark blazer and striped shirt.
Meet Alexander

Meet Alexander Lurie

Alexander Fromm Lurie is a highly accomplished San Francisco real estate professional and the leader of The Lurie Group, a top-performing team recognized among the top 1% of agents in the city. With over a decade of experience in the real estate industry and California DRE License #01952347, Alexander has built a reputation for delivering exceptional results, with hundreds of homes sold and over $1 billion in total sales volume. Born and raised in San Francisco, he brings deep local expertise, generational knowledge of the Bay Area, and a strong connection to the community into every client relationship. His approach goes beyond transactions—focusing on helping clients build meaningful connections to neighborhoods, schools, and local culture while navigating the buying or selling process with confidence.

Alexander’s background in management consulting and entrepreneurship further strengthens his strategic approach to real estate, allowing him to provide clients with a competitive edge in pricing, negotiation, and marketing. Known for his integrity, discretion, and client-first mindset, he continues to be a trusted advisor for buyers, sellers, and investors across San Francisco’s dynamic real estate market.

Alexander Lurie

Founder | Real Estate Advisor
LICENSE NUMBER
01952347
ADDRESS
629 Divisadero Ave, San Francisco, CA 94117
San Francisco 2023 April Real Estate Report

Let's Work Together

Our passion is supporting clients who value exceptional results and client care. We look forward to the opportunity to work together.
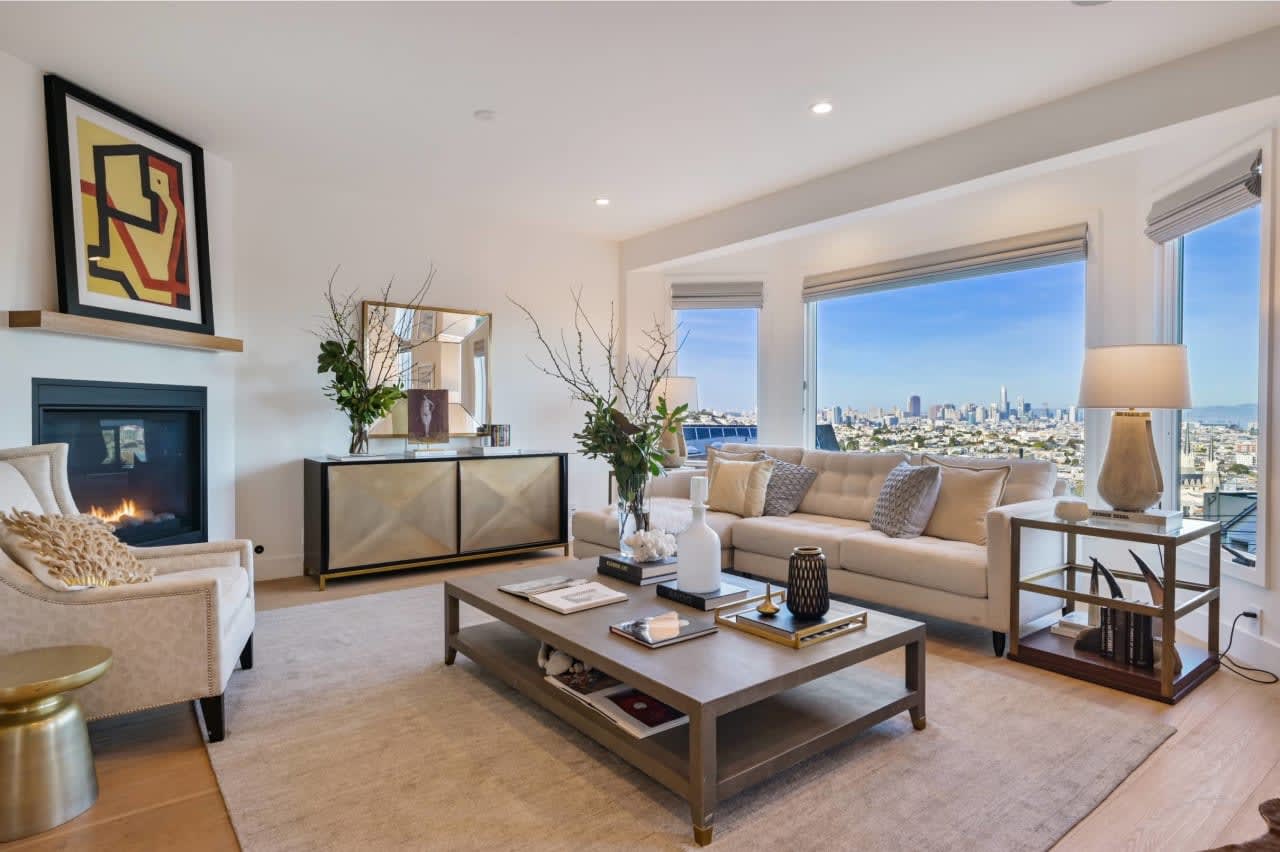
Modern condo living and dining area with a geometric chandelier and Bay Bridge views through large windows.
link
Follow Us