The Lurie Group
New National Report - Real Estate & Economic Indicators

New National Report - Real Estate & Economic Indicators

  • Alexander Lurie
  • April 15, 2023

Selected Market & Economic Indicators for the National Real Estate Market

New listings, active listings, price reductions, listings pending sale, sales
volumes, home prices, appreciation, interest rates, financial markets,
inflation, population migration, and other factors and indicators

Mid-April 2023

Buyer demand and market activity continued to rebound in early 2023 from the late 2022
low point, but the number of new listings coming on market remains very low, a situation
with wide ramifications for supply and demand dynamics, and for home prices. Many
important economic factors at play – such as interest rates, inflation, financial markets,
the stability of the banking industry, federal debt limit negotiations, and so on – continue
to be uncertain and/or volatile.

This report is divided into two parts: The first looks at home prices, and supply and
demand conditions and trends in the overall national market. The second part reviews
selected macroeconomic factors and indicators that often impact real estate. A national
report is necessarily a huge generalization of broad trends across an enormous range of
regional submarkets, whose dynamics often vary. How the data in this report applies to
any particular property is unknown without a specific comparative market analysis.

As of the date of this report, depending on the source of data, some data points for
March 2023 and Q1 2023 may not be available for several weeks or longer, and will be
covered in future updates.

The spring selling season is typically the most active of the year – though this too can vary
between submarkets – and much more data will soon be available.

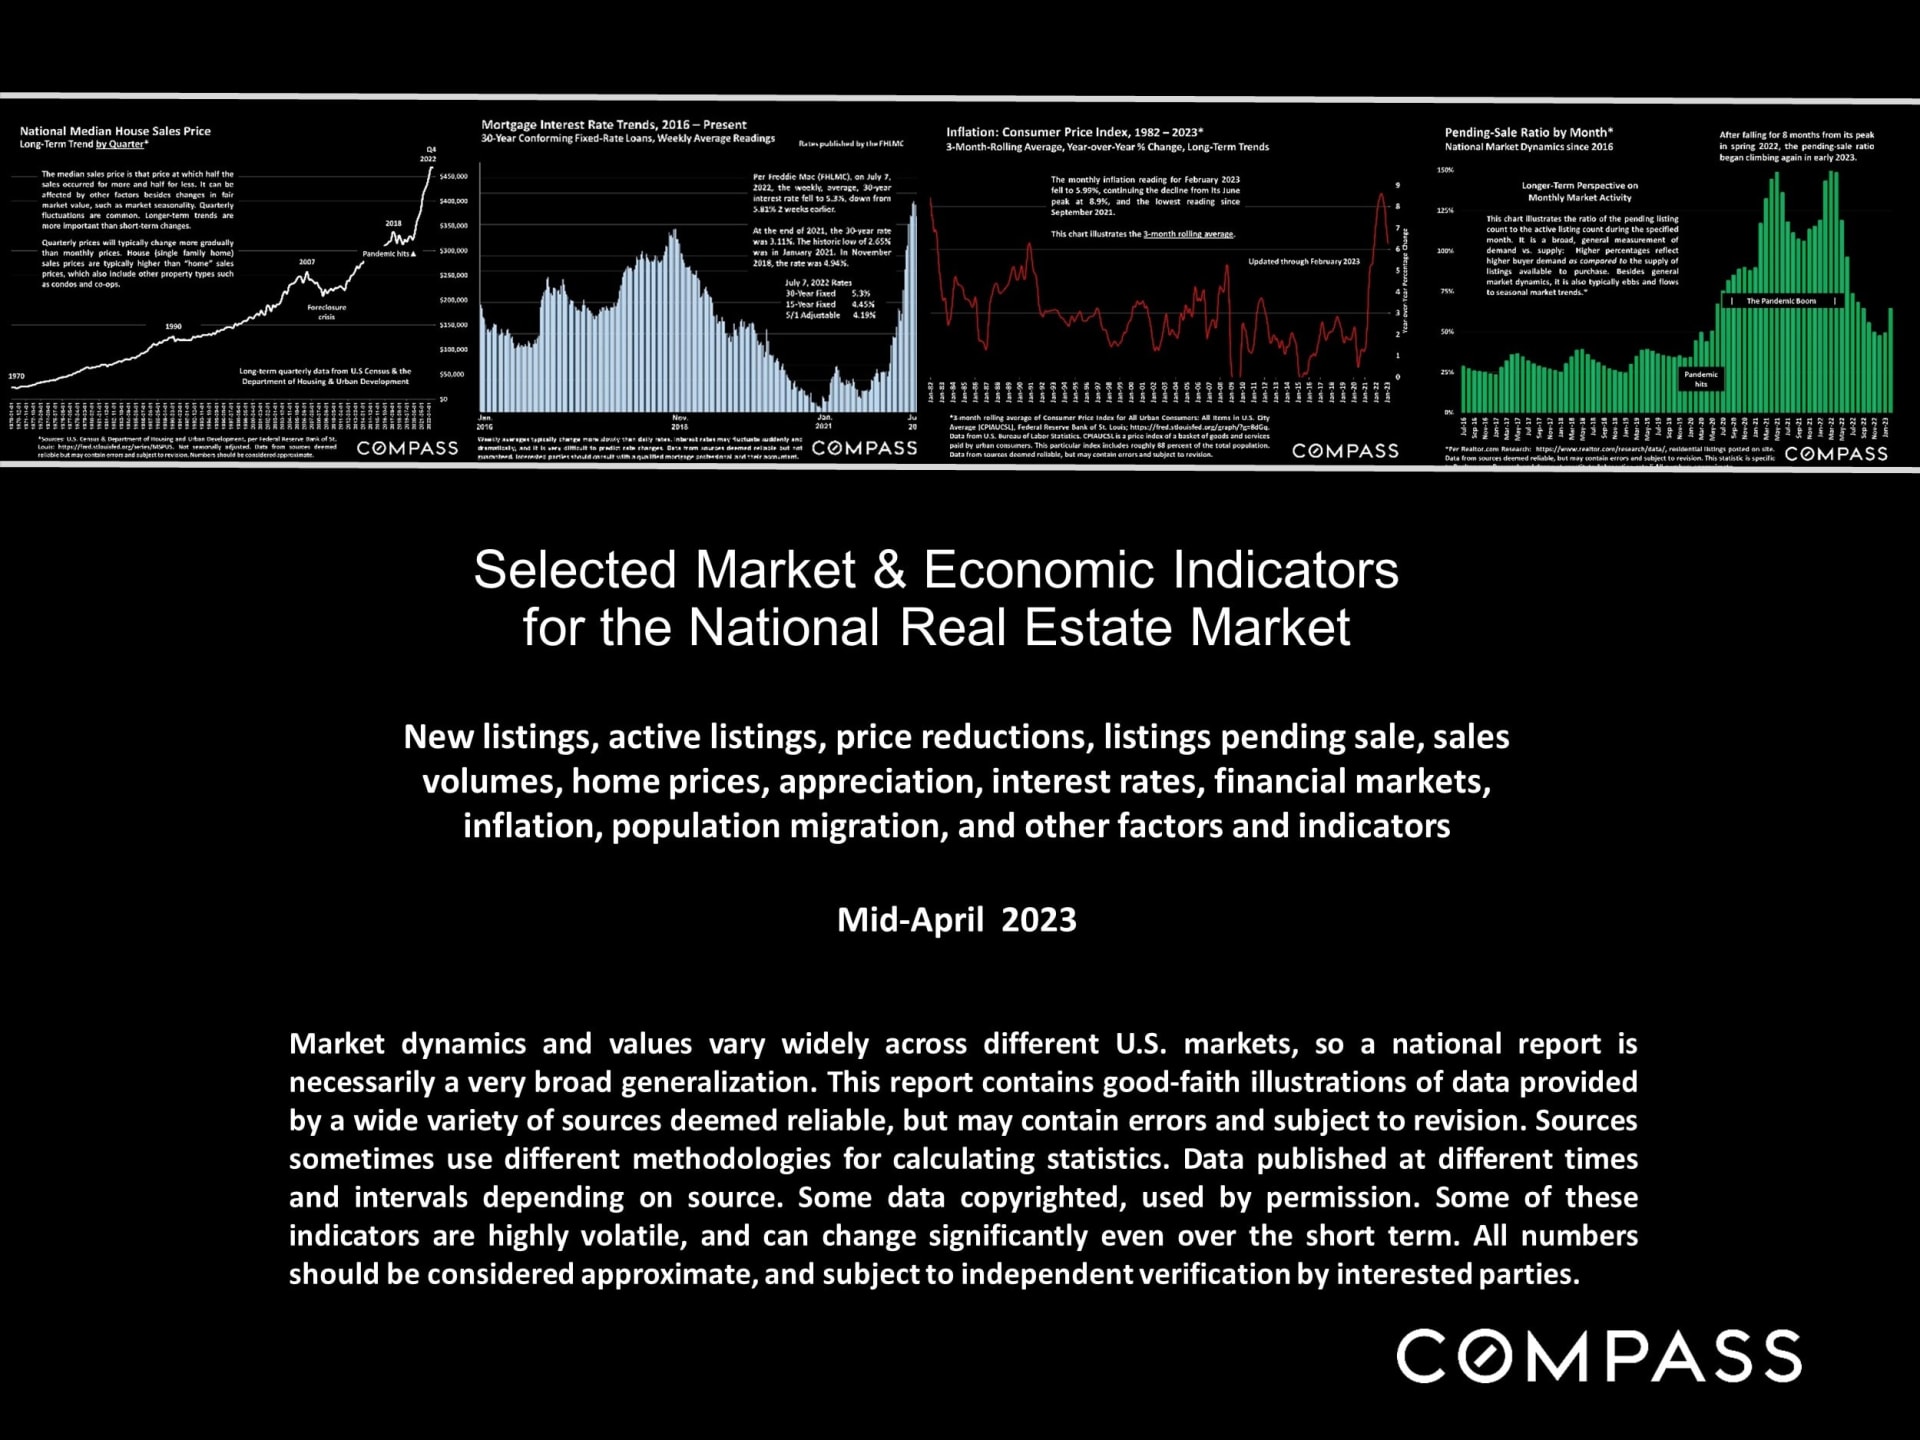
Infographic of national real estate and economic indicators, with charts for home prices, mortgage rates, inflation, and pending sales.

Report text summarizes early 2023 national housing trends and economic indicators, with a Compass wordmark.

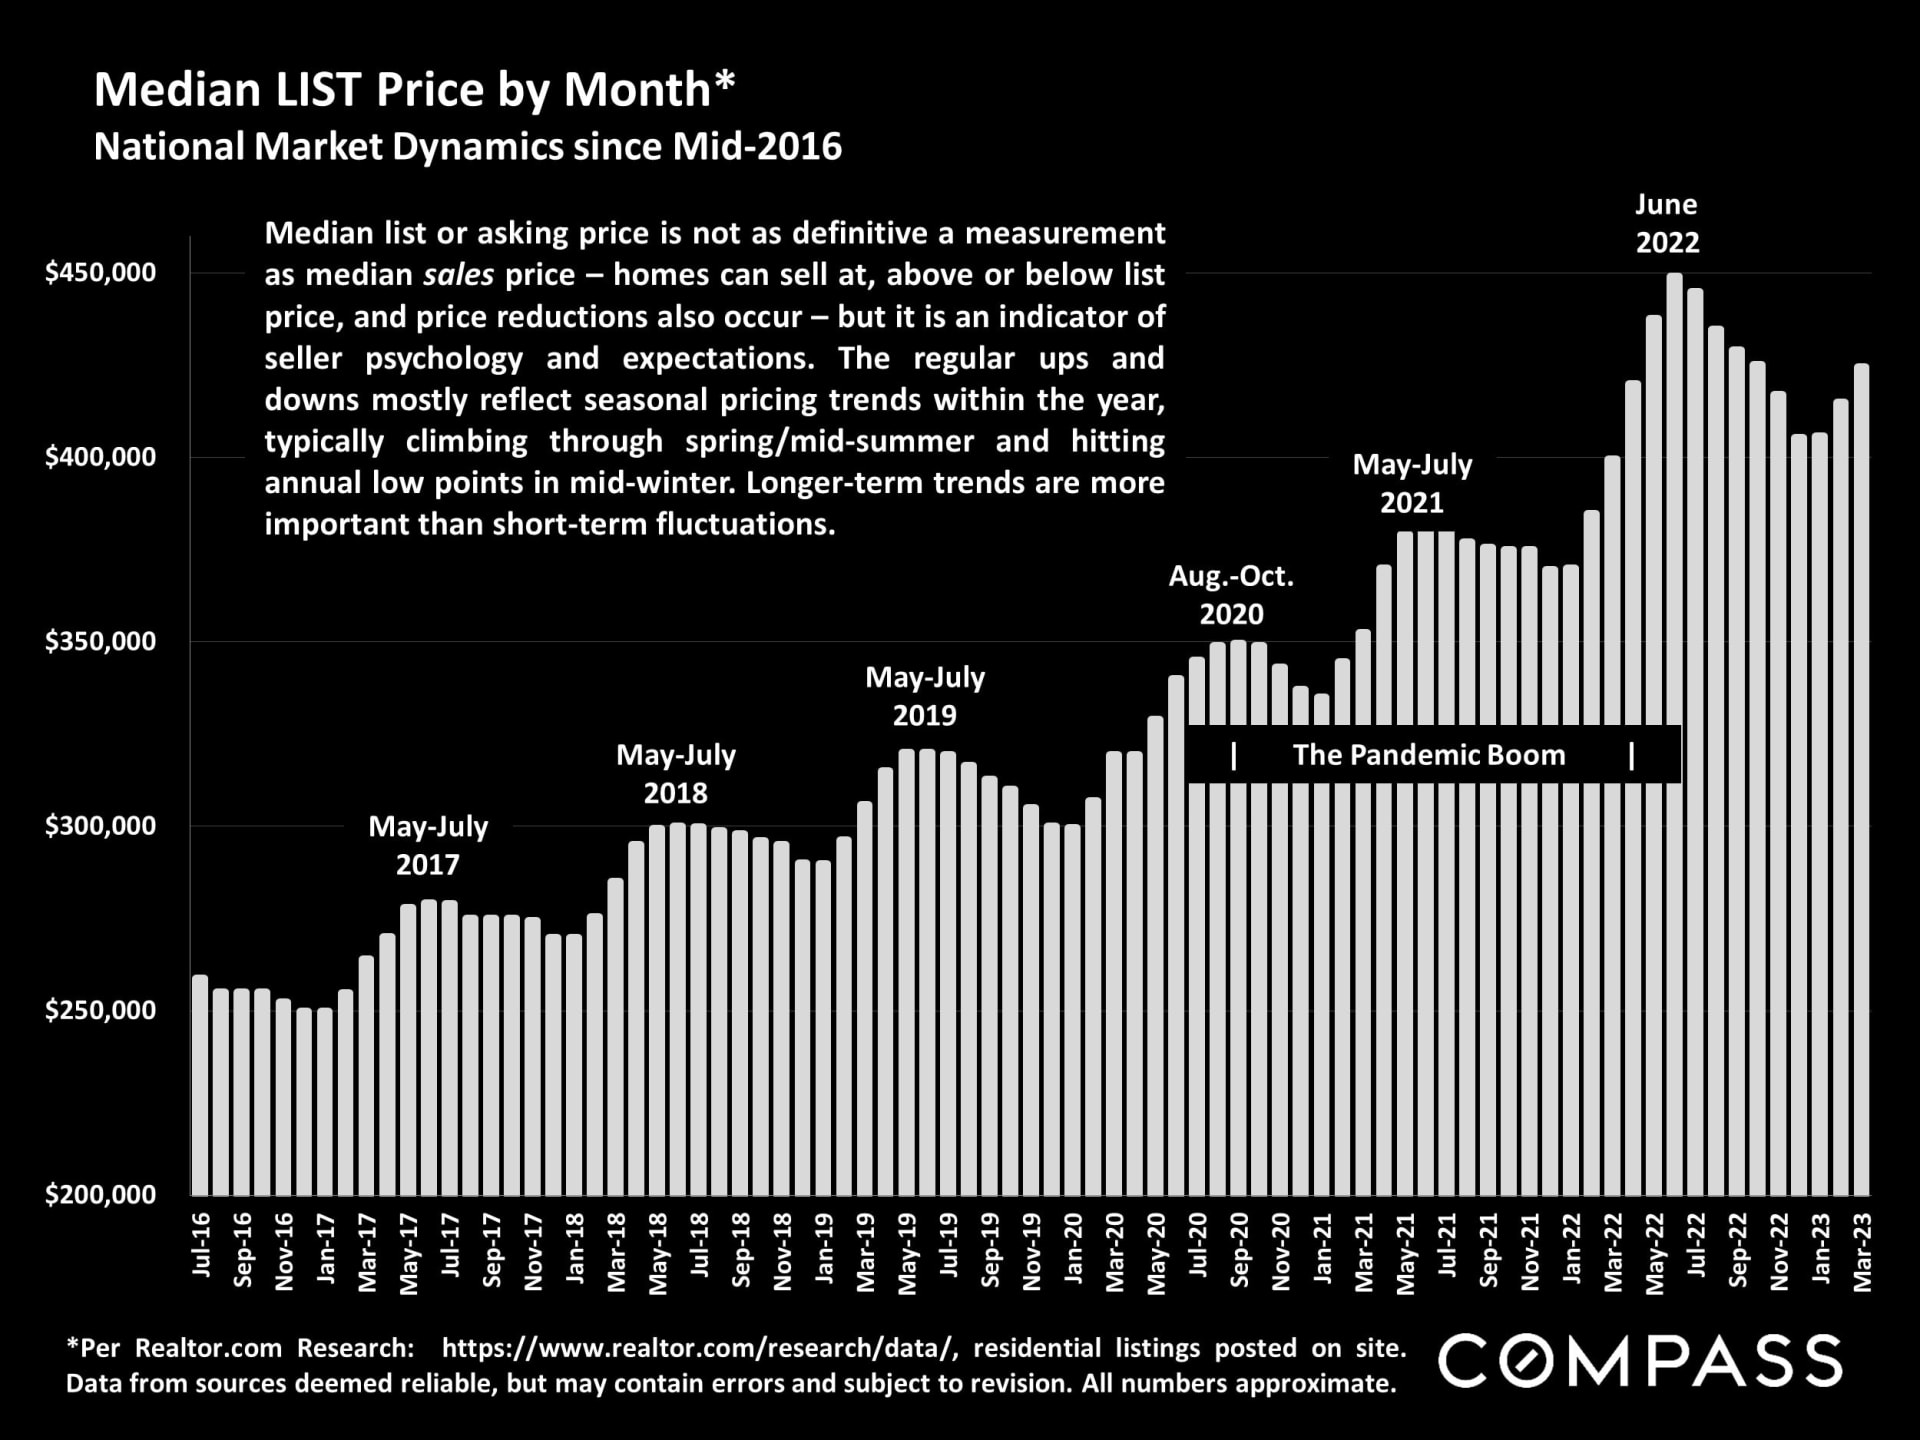
Bar chart of national median home list prices, rising from 2016 to a June 2022 peak before declining.

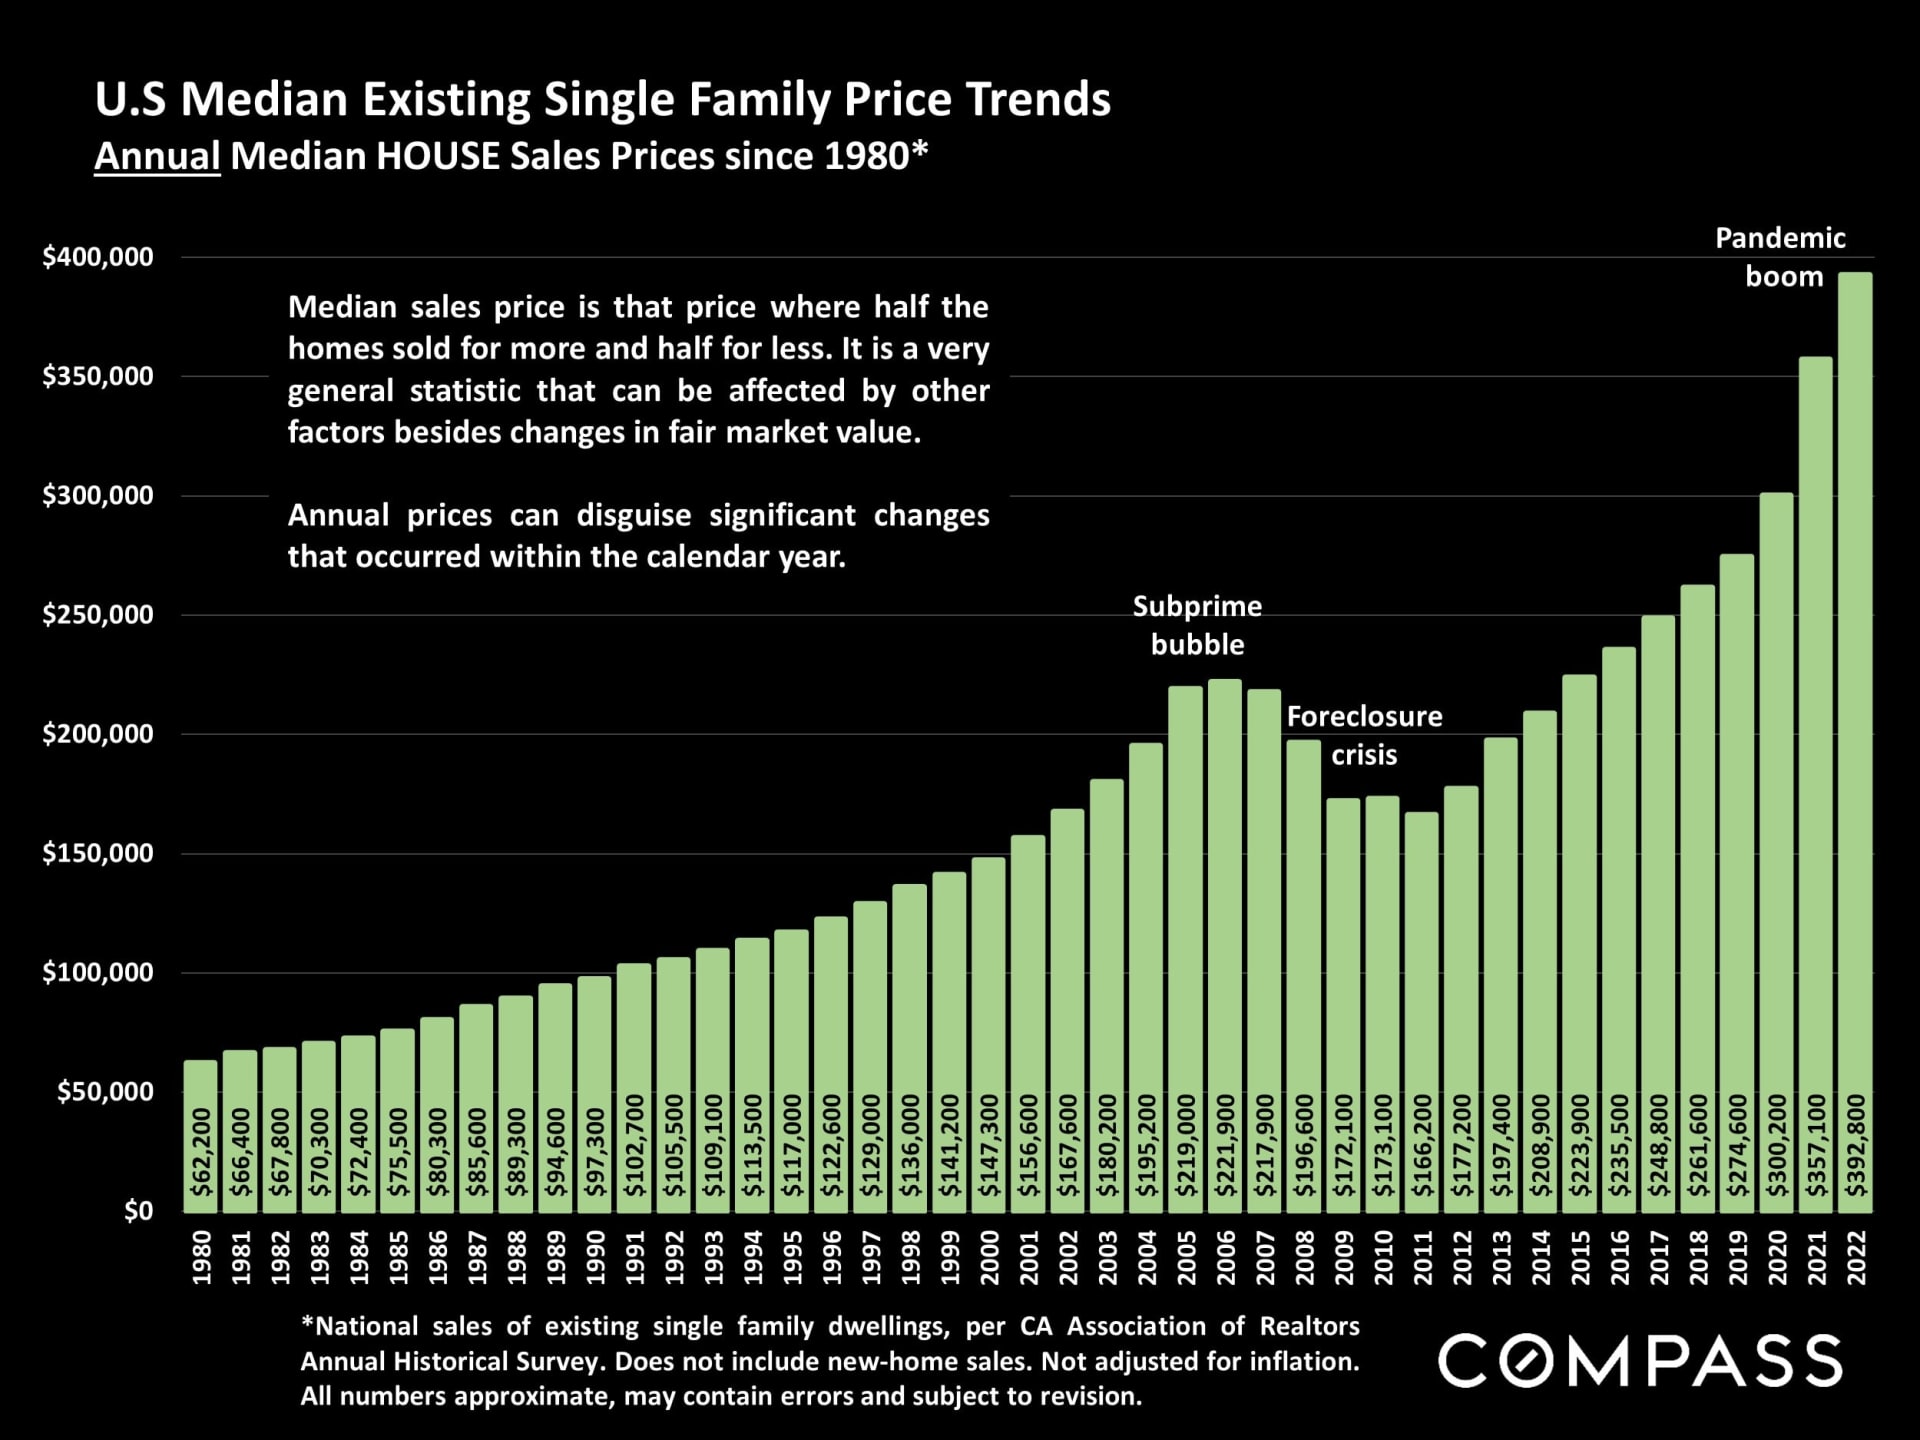
Chart of U.S. median existing single-family home prices from 1980 to 2022, rising sharply during the pandemic boom.

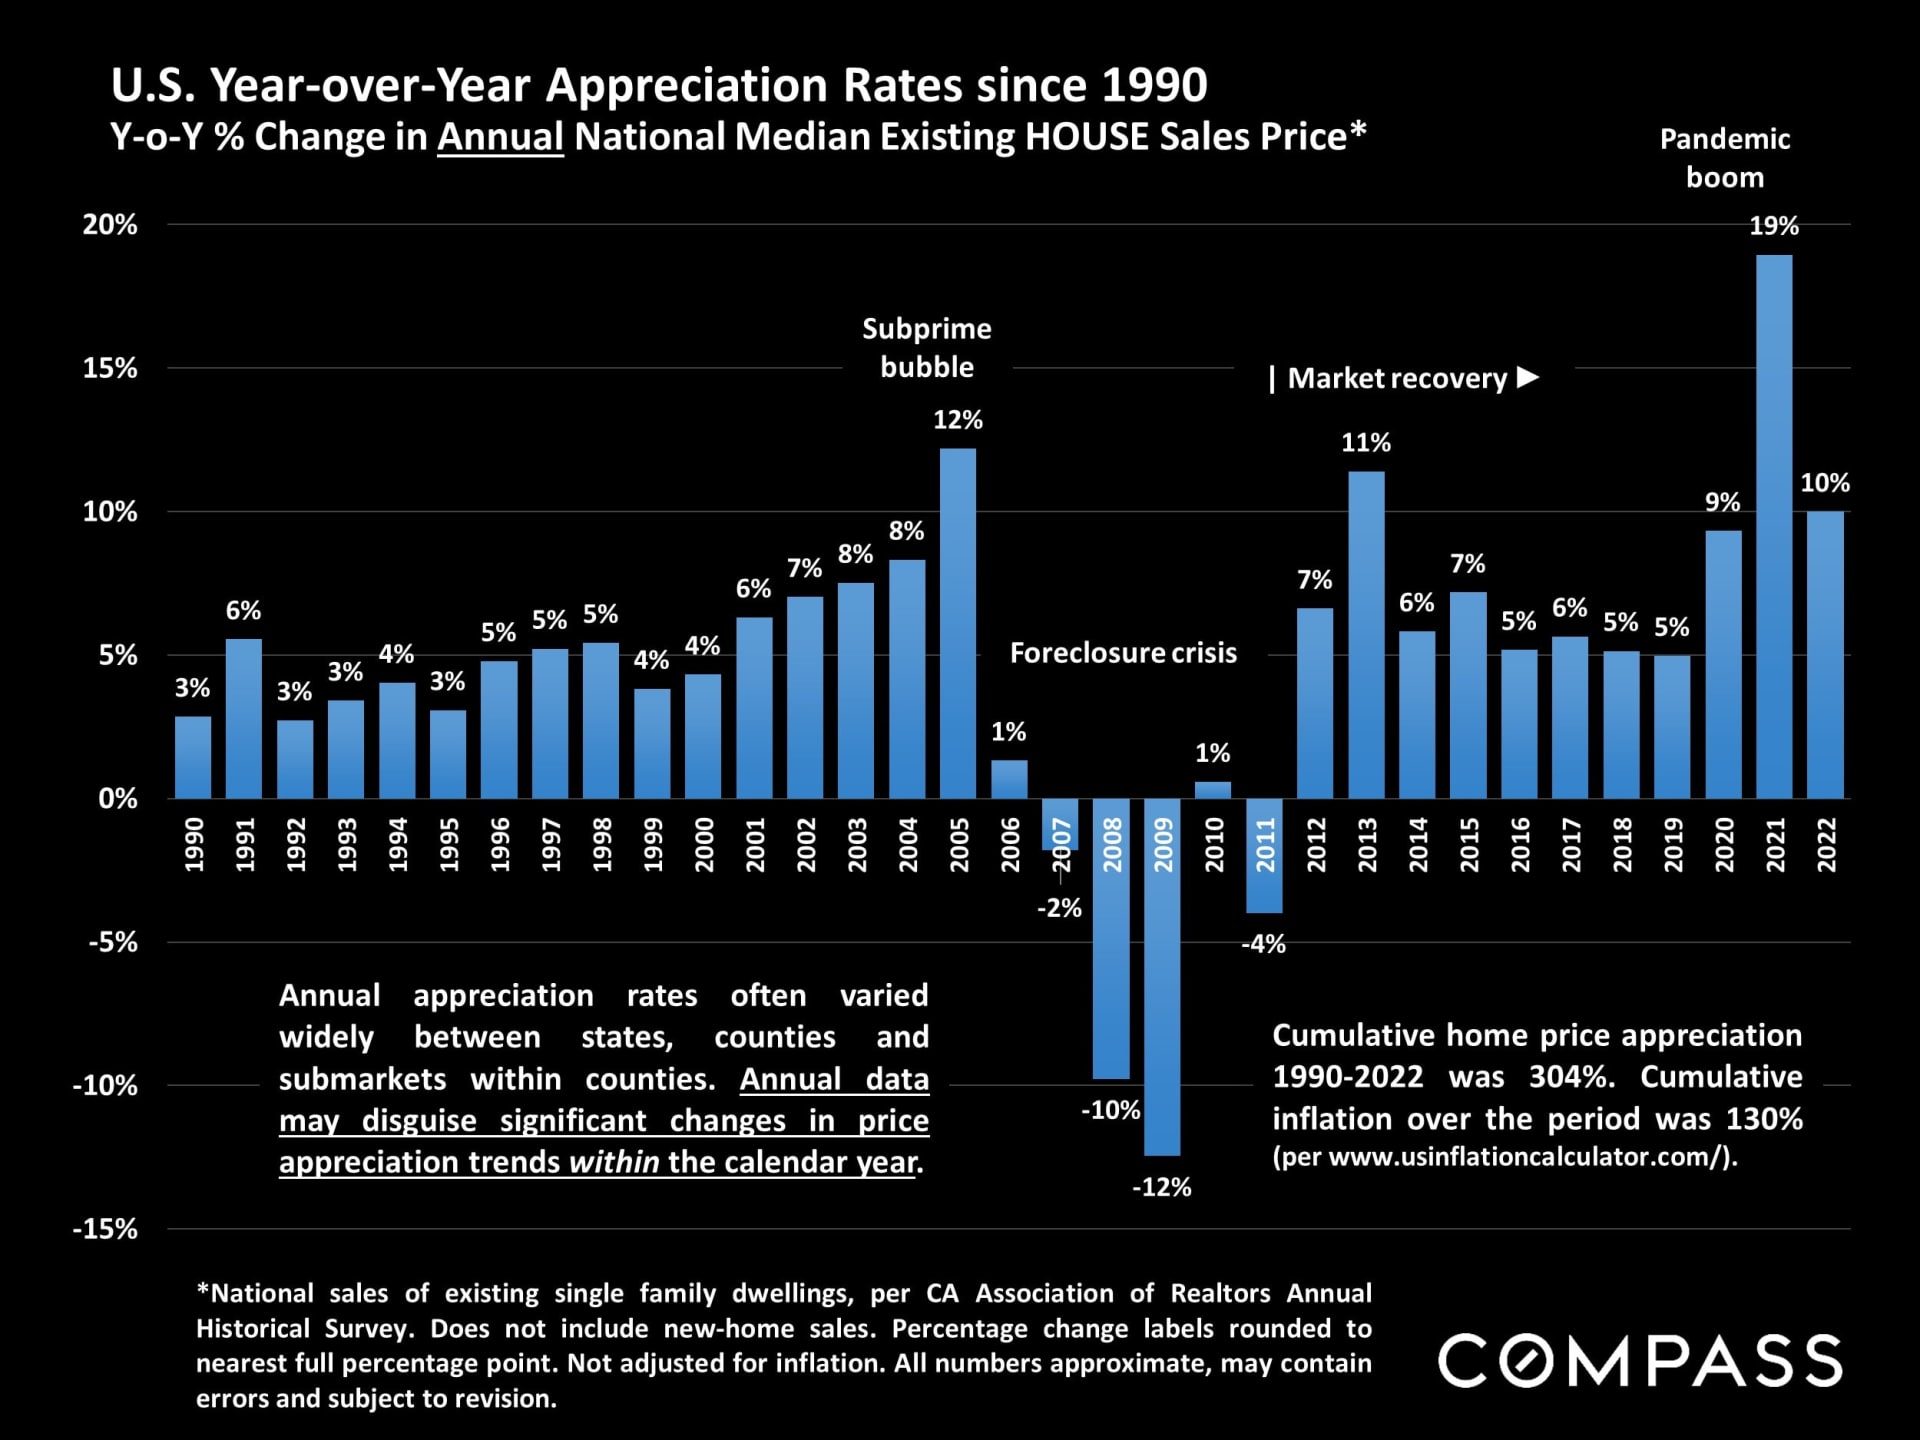
Chart of U.S. home price appreciation from 1990 to 2022, including a 19% increase in 2021.

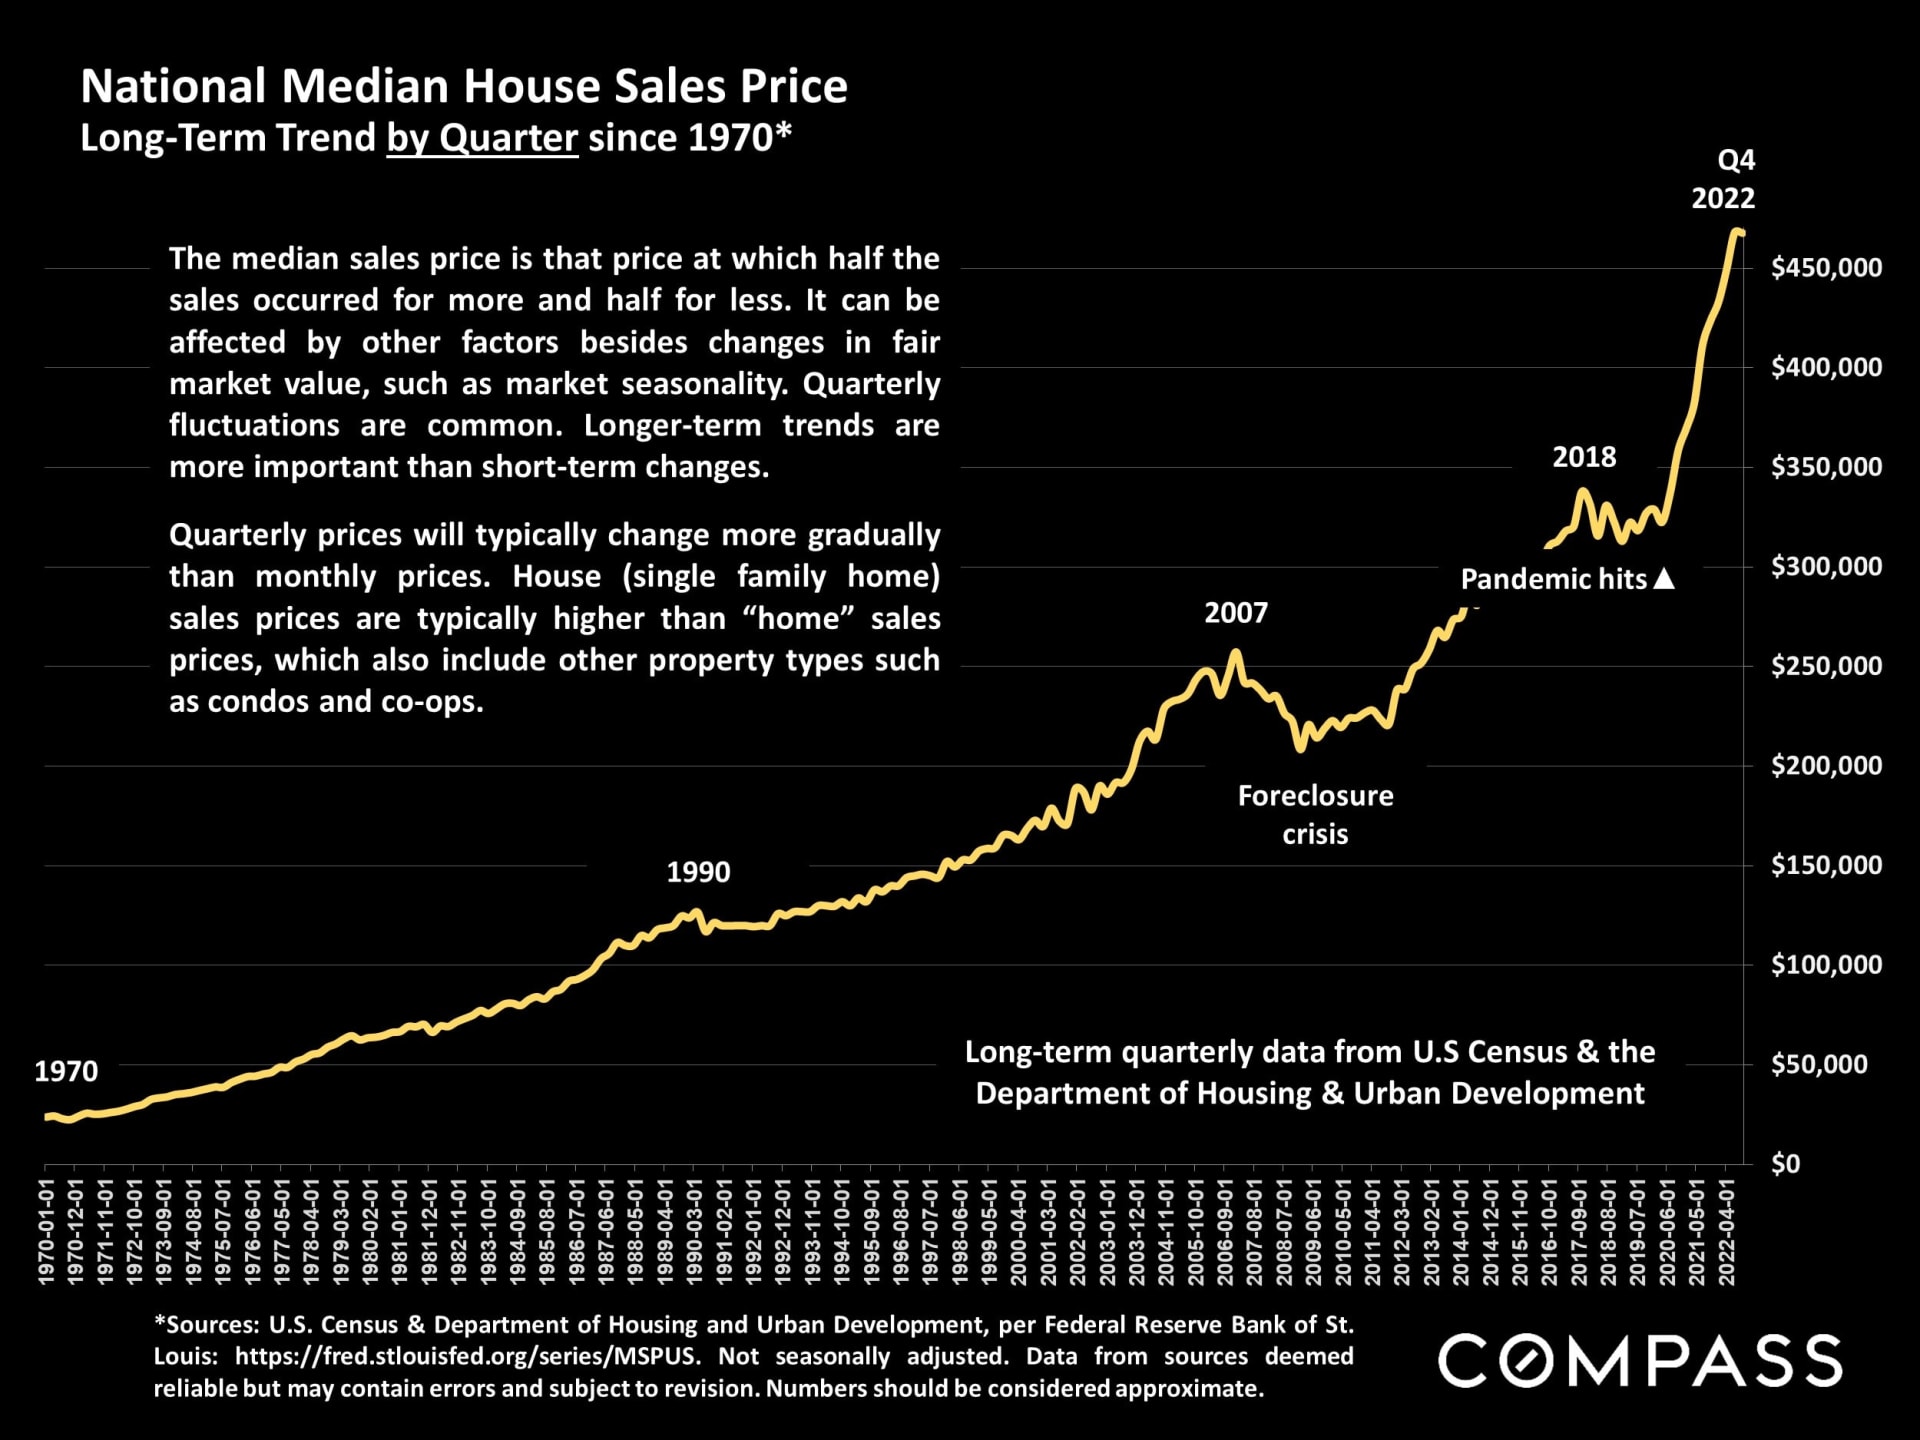
Chart of national median house sales prices from 1970 to Q4 2022, showing a sharp rise after the pandemic.

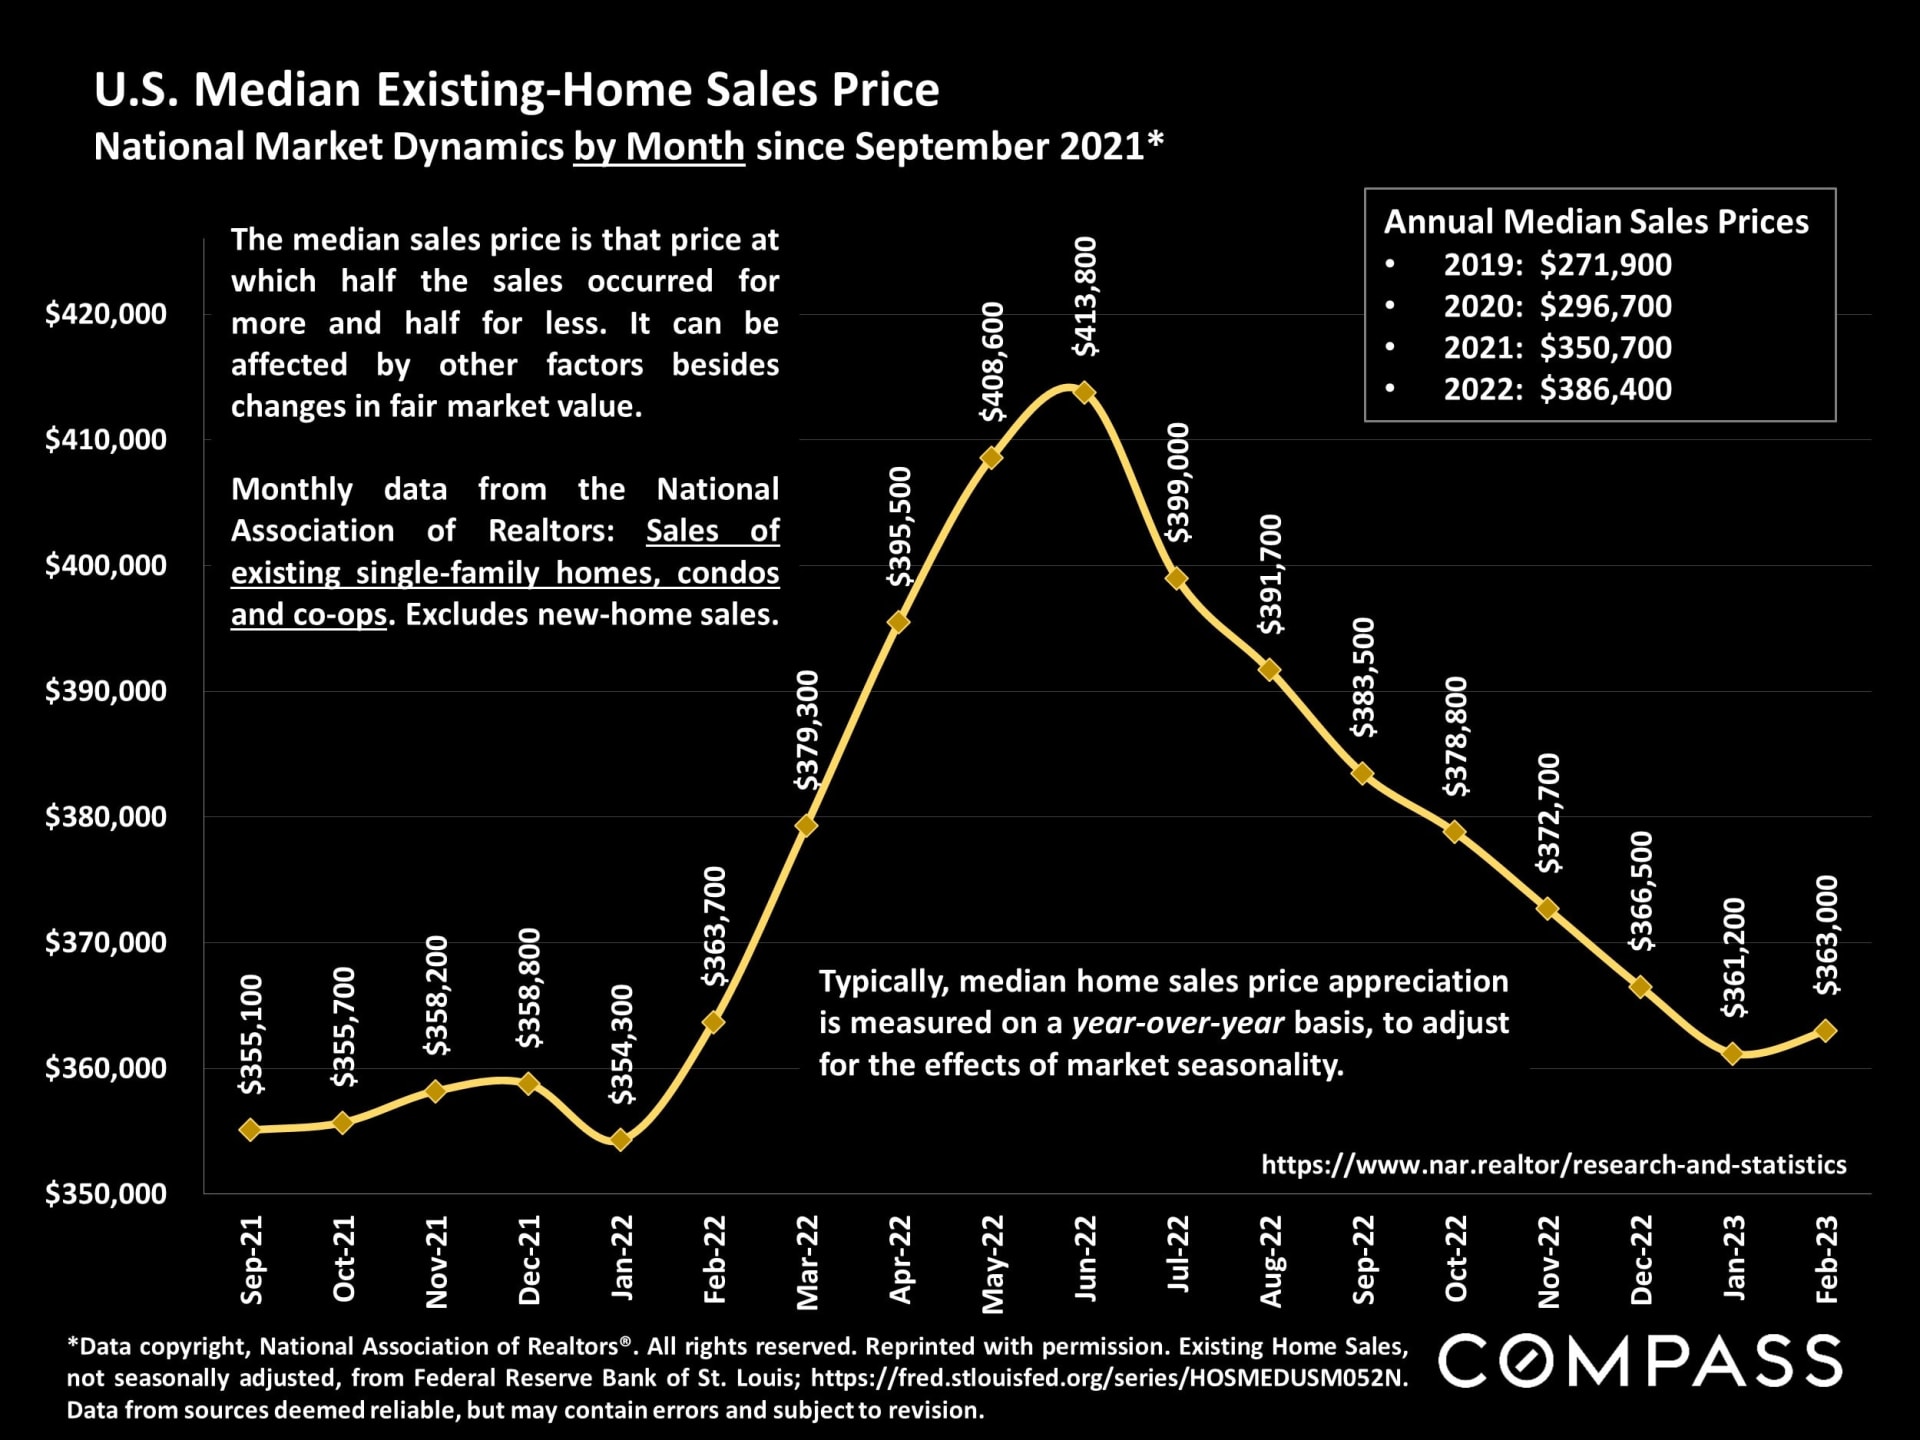
Chart of U.S. median existing-home sales prices, showing a June 2022 peak and subsequent decline.

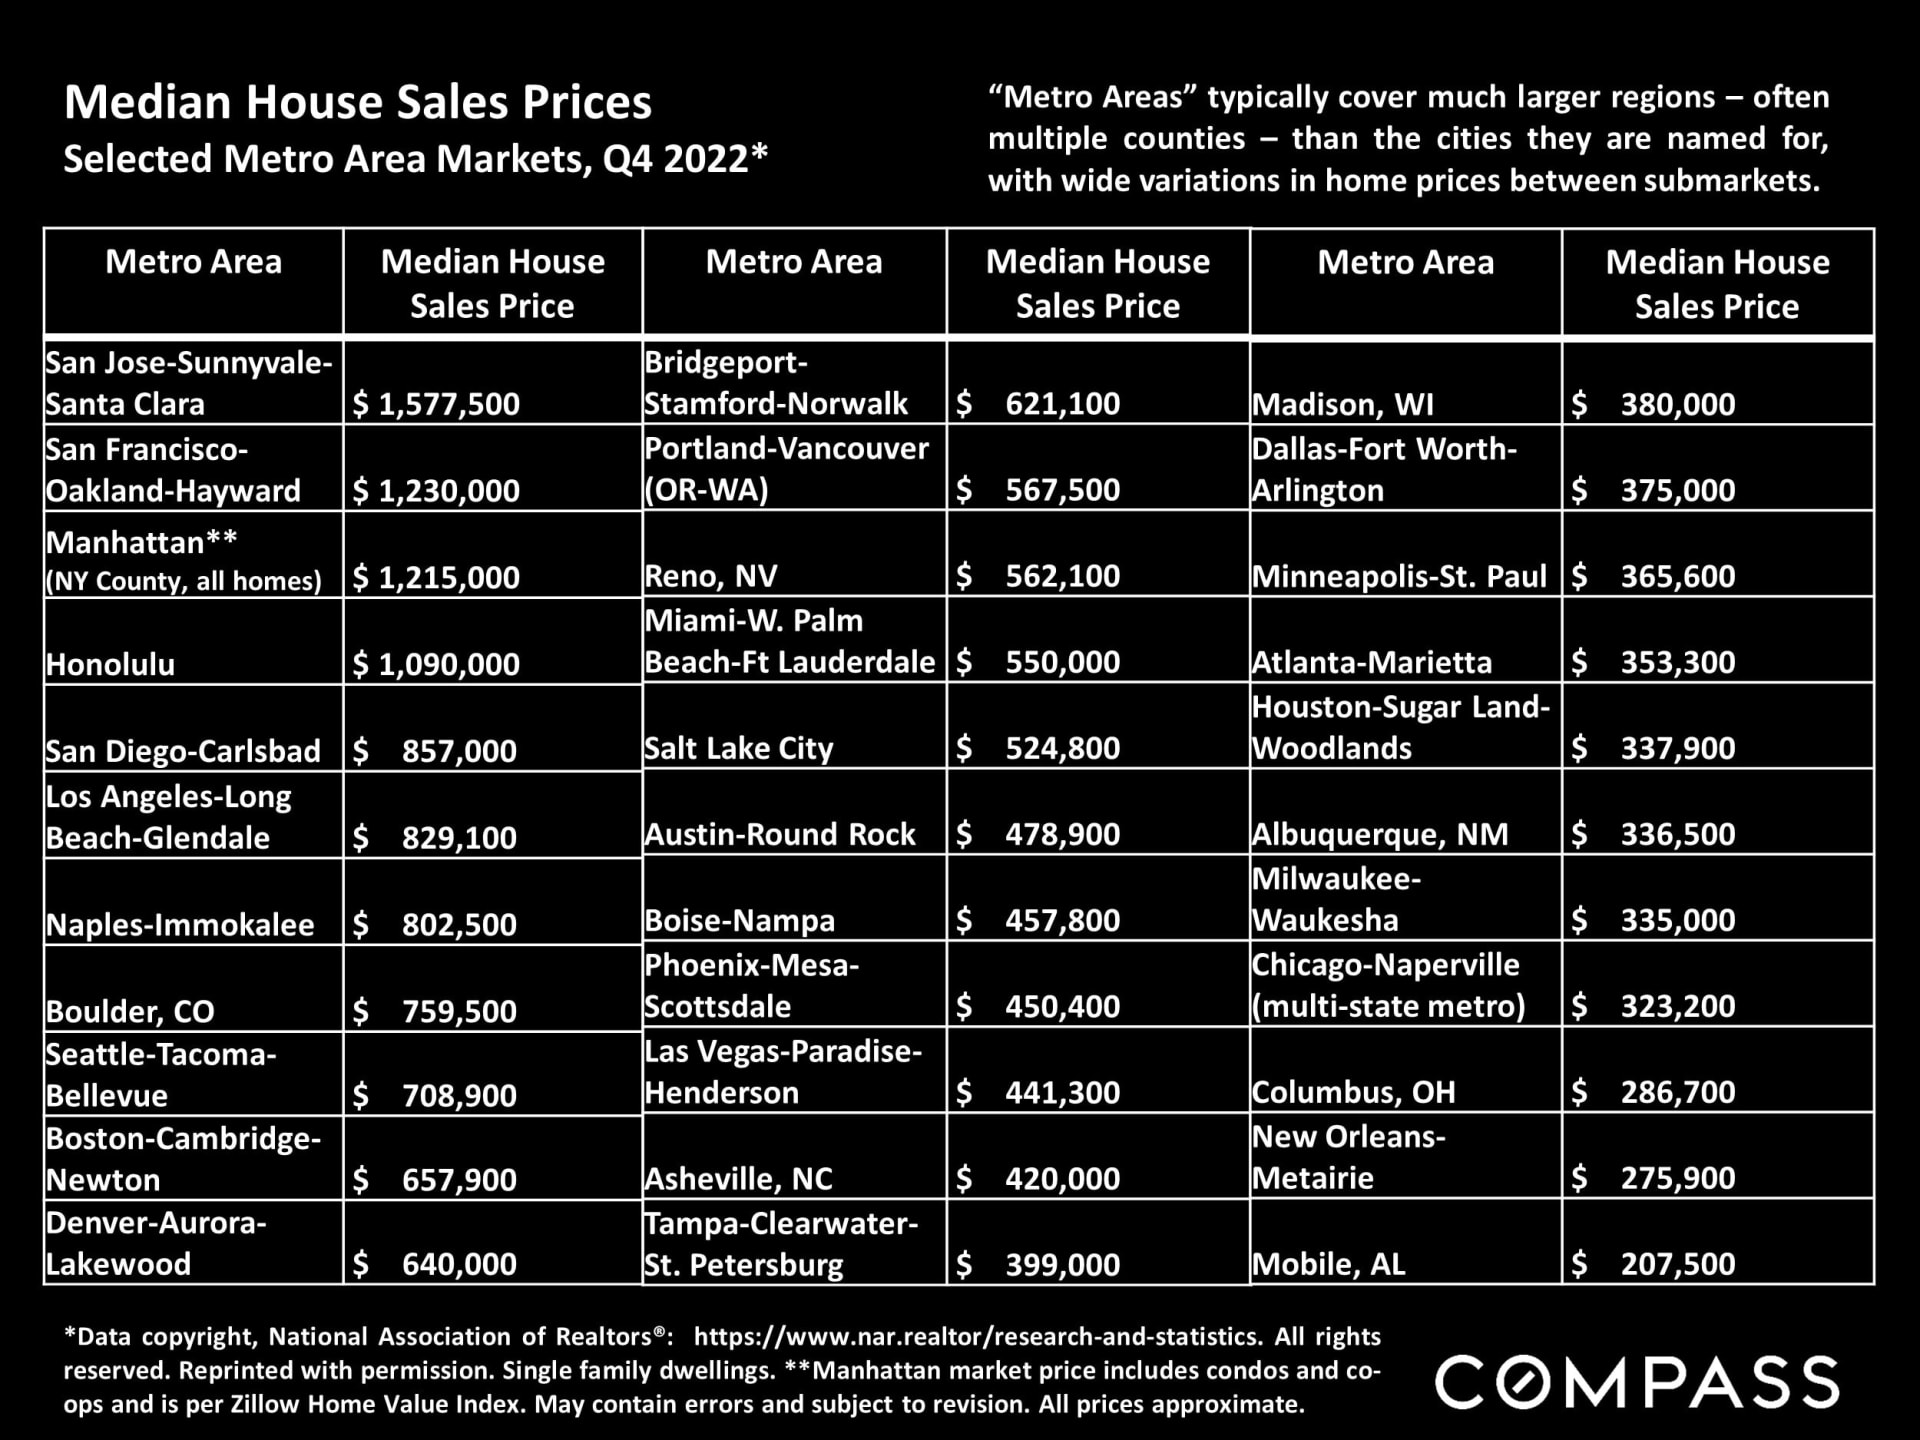
Table comparing Q4 2022 median house prices across 33 U.S. metro areas, from San Jose to Mobile.
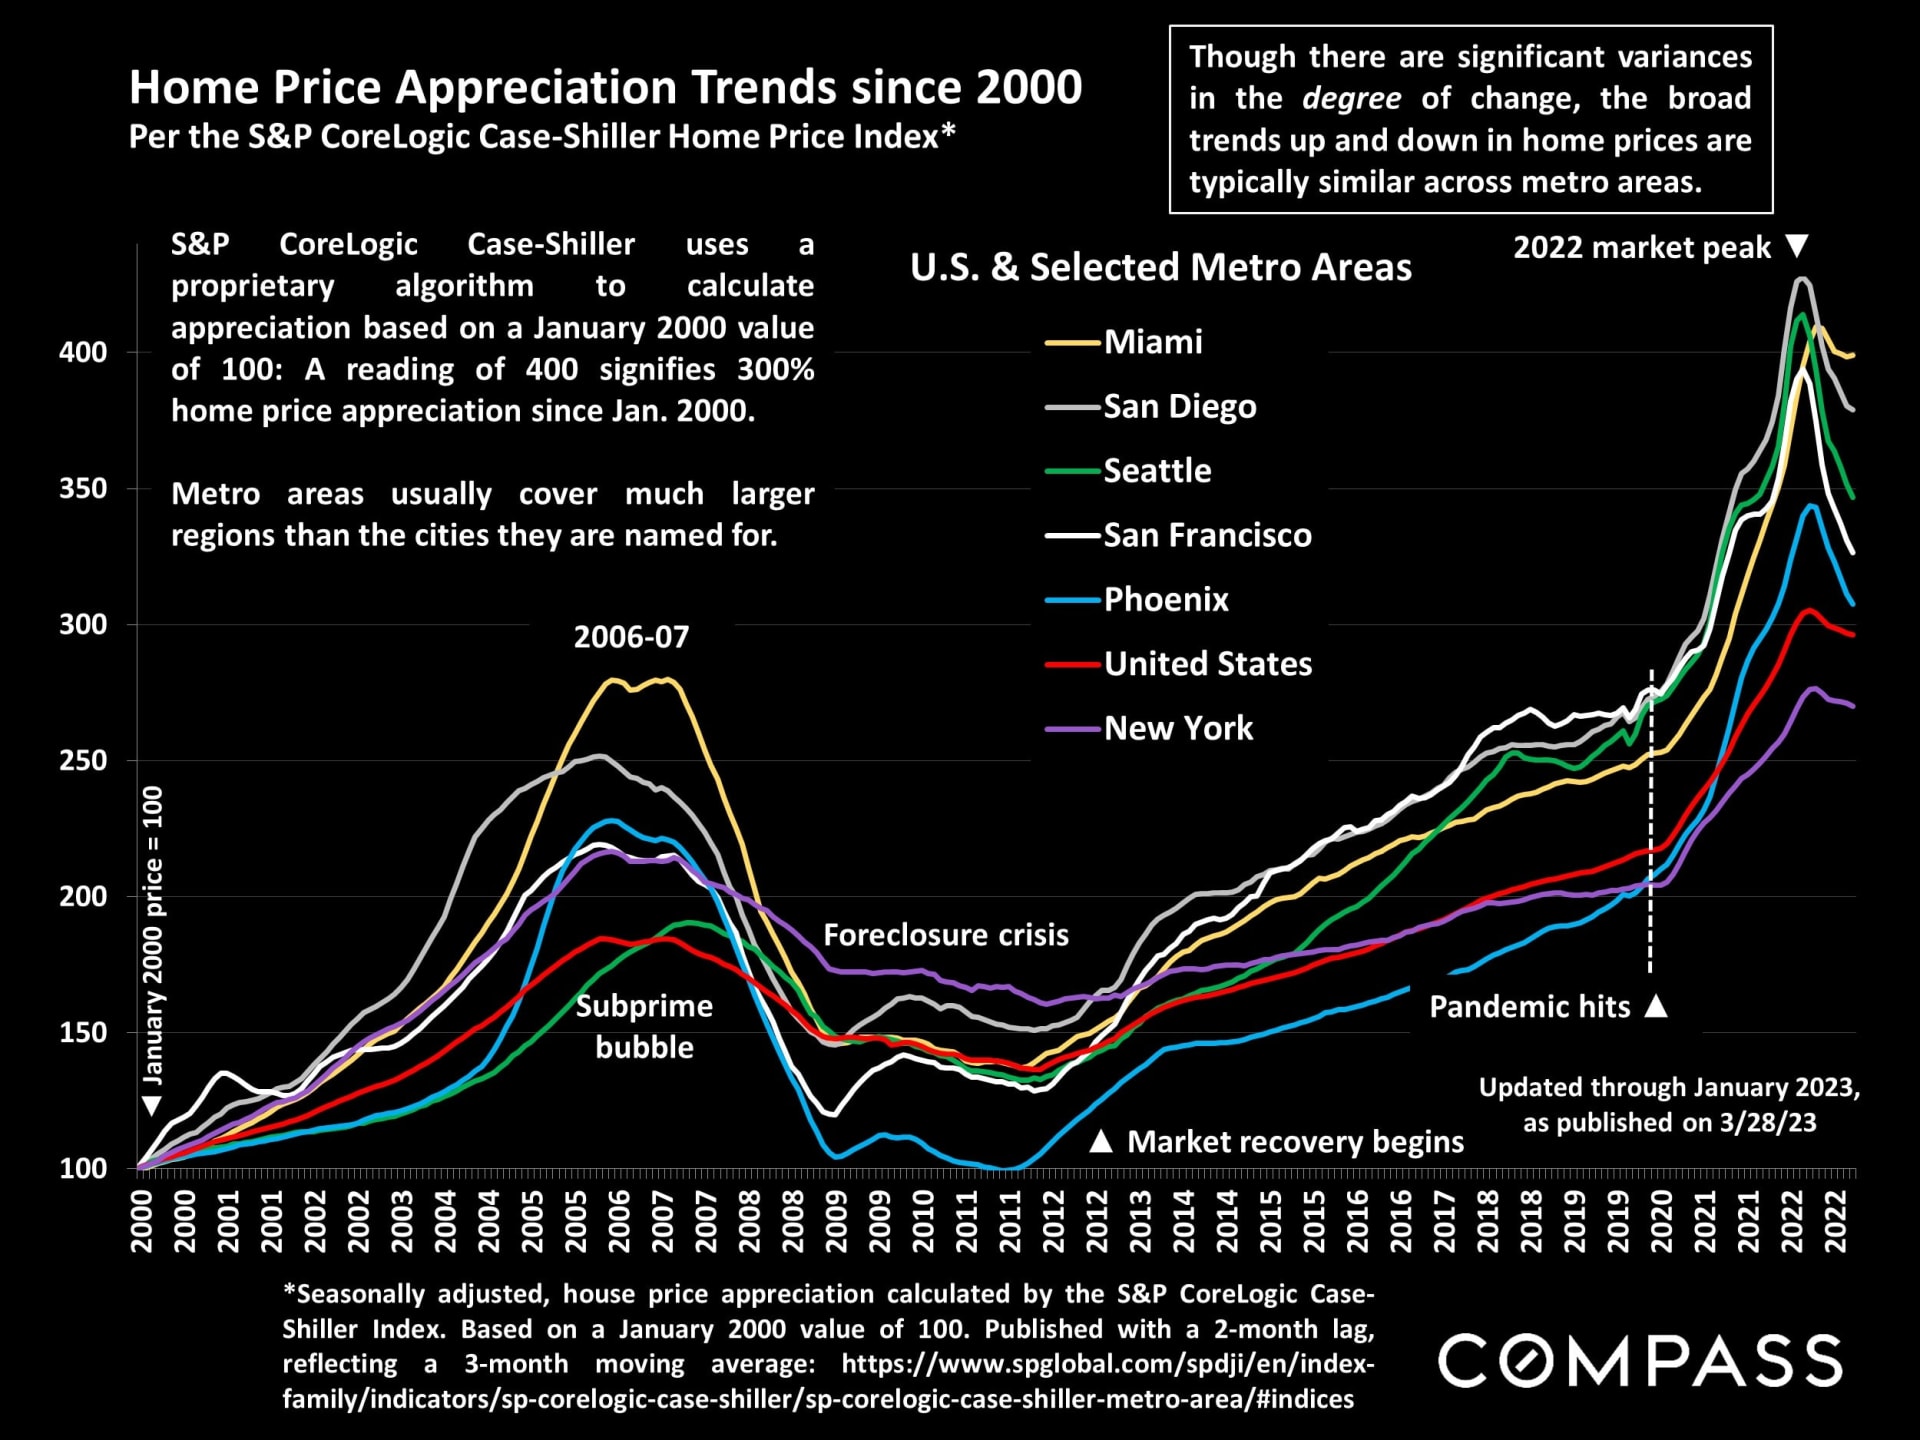
Line chart comparing home price appreciation since 2000 across the United States and six metro areas.

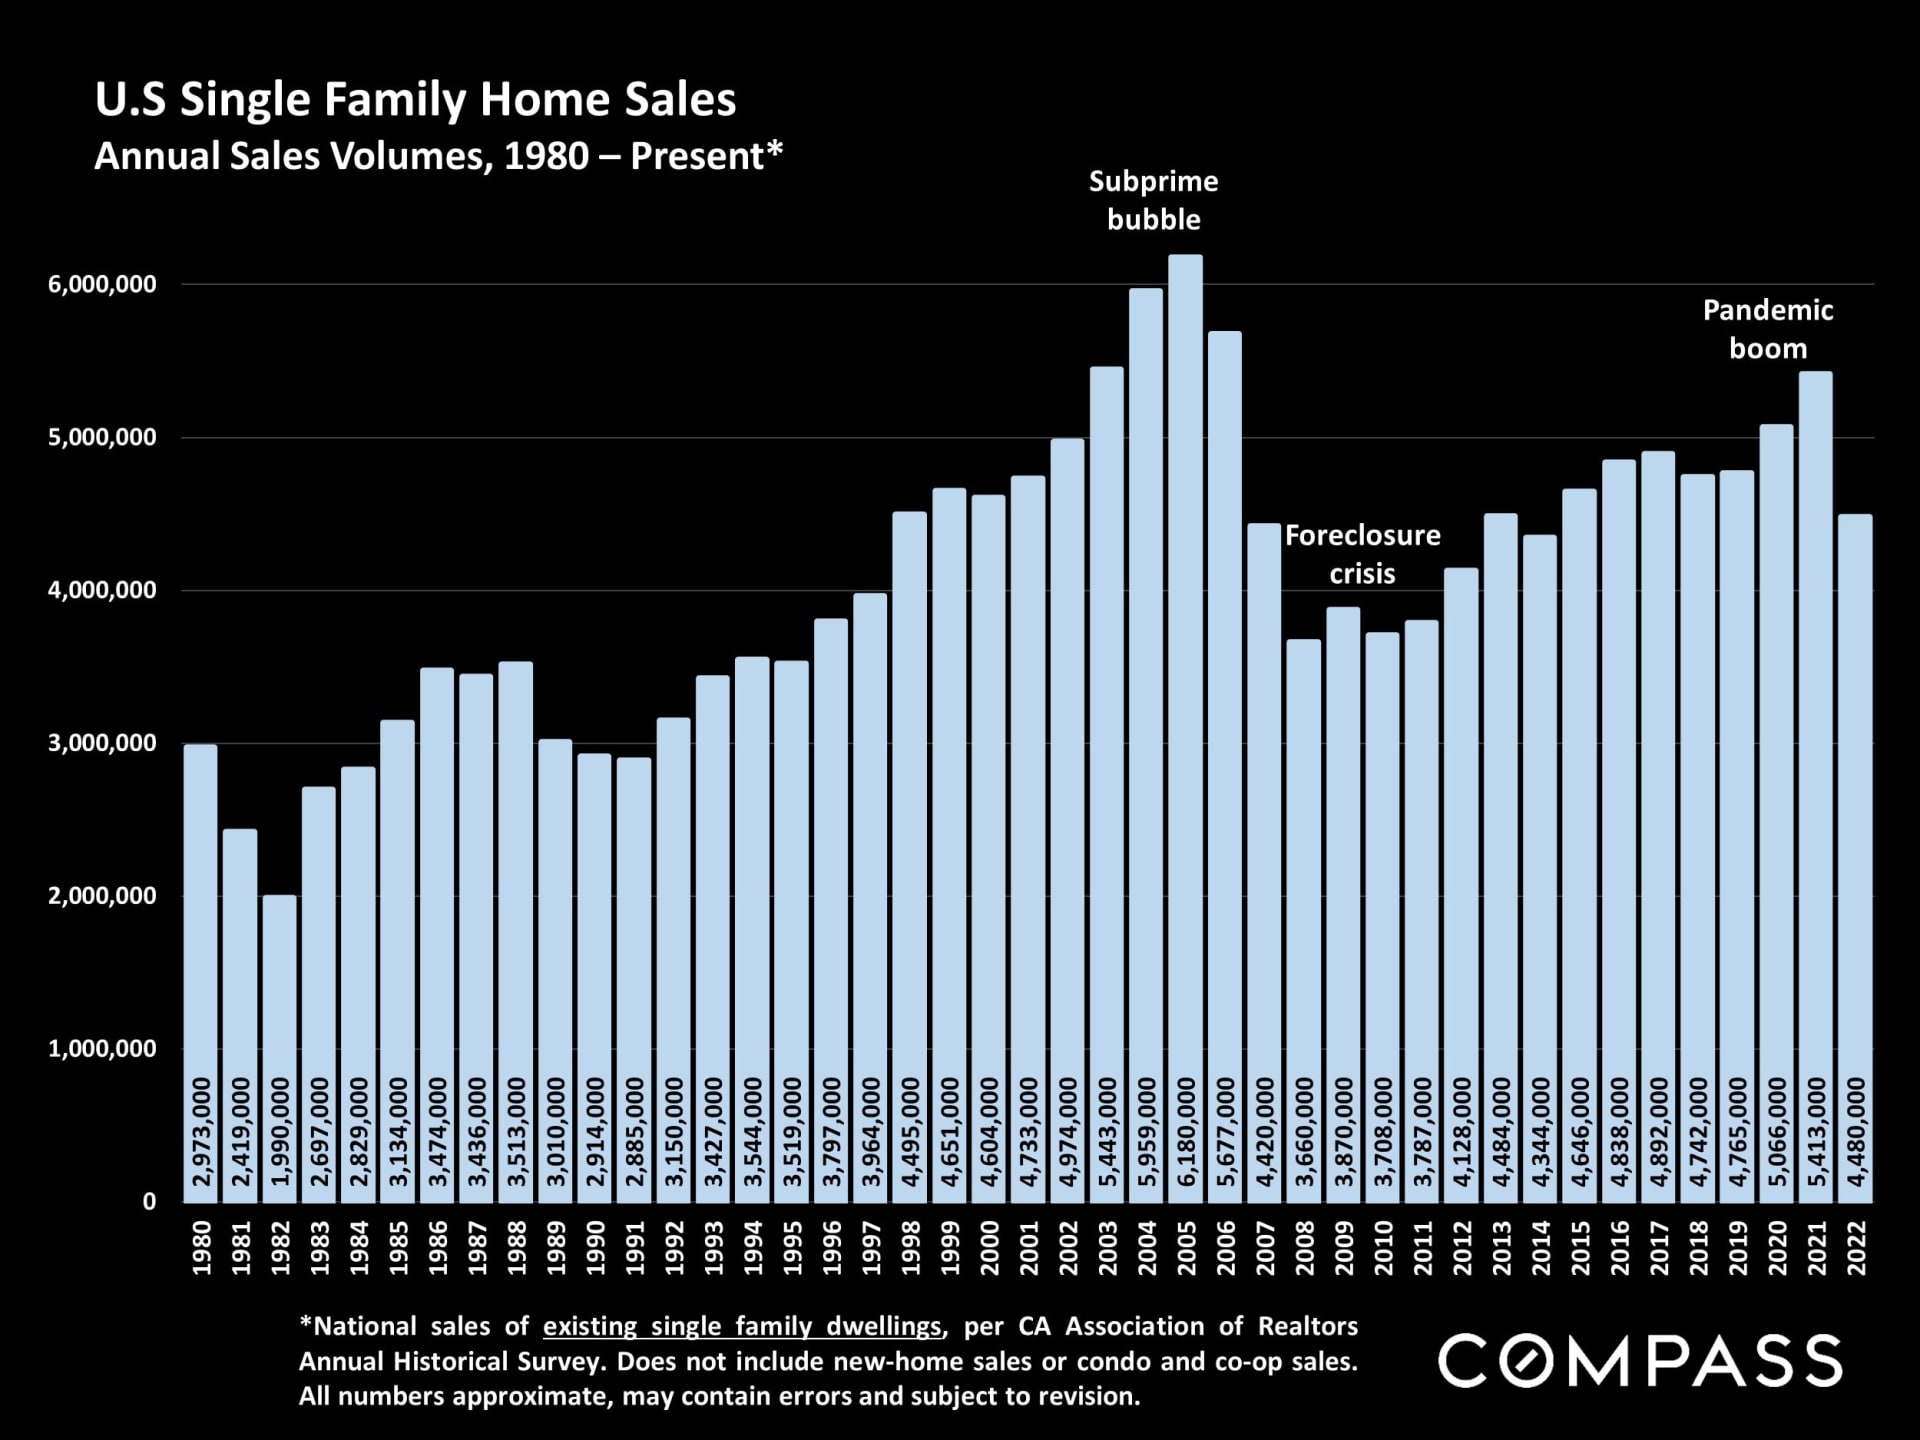
Bar chart of U.S. single-family home sales, 1980–2022, with callouts for the subprime bubble, foreclosure crisis, and pandemic boom.

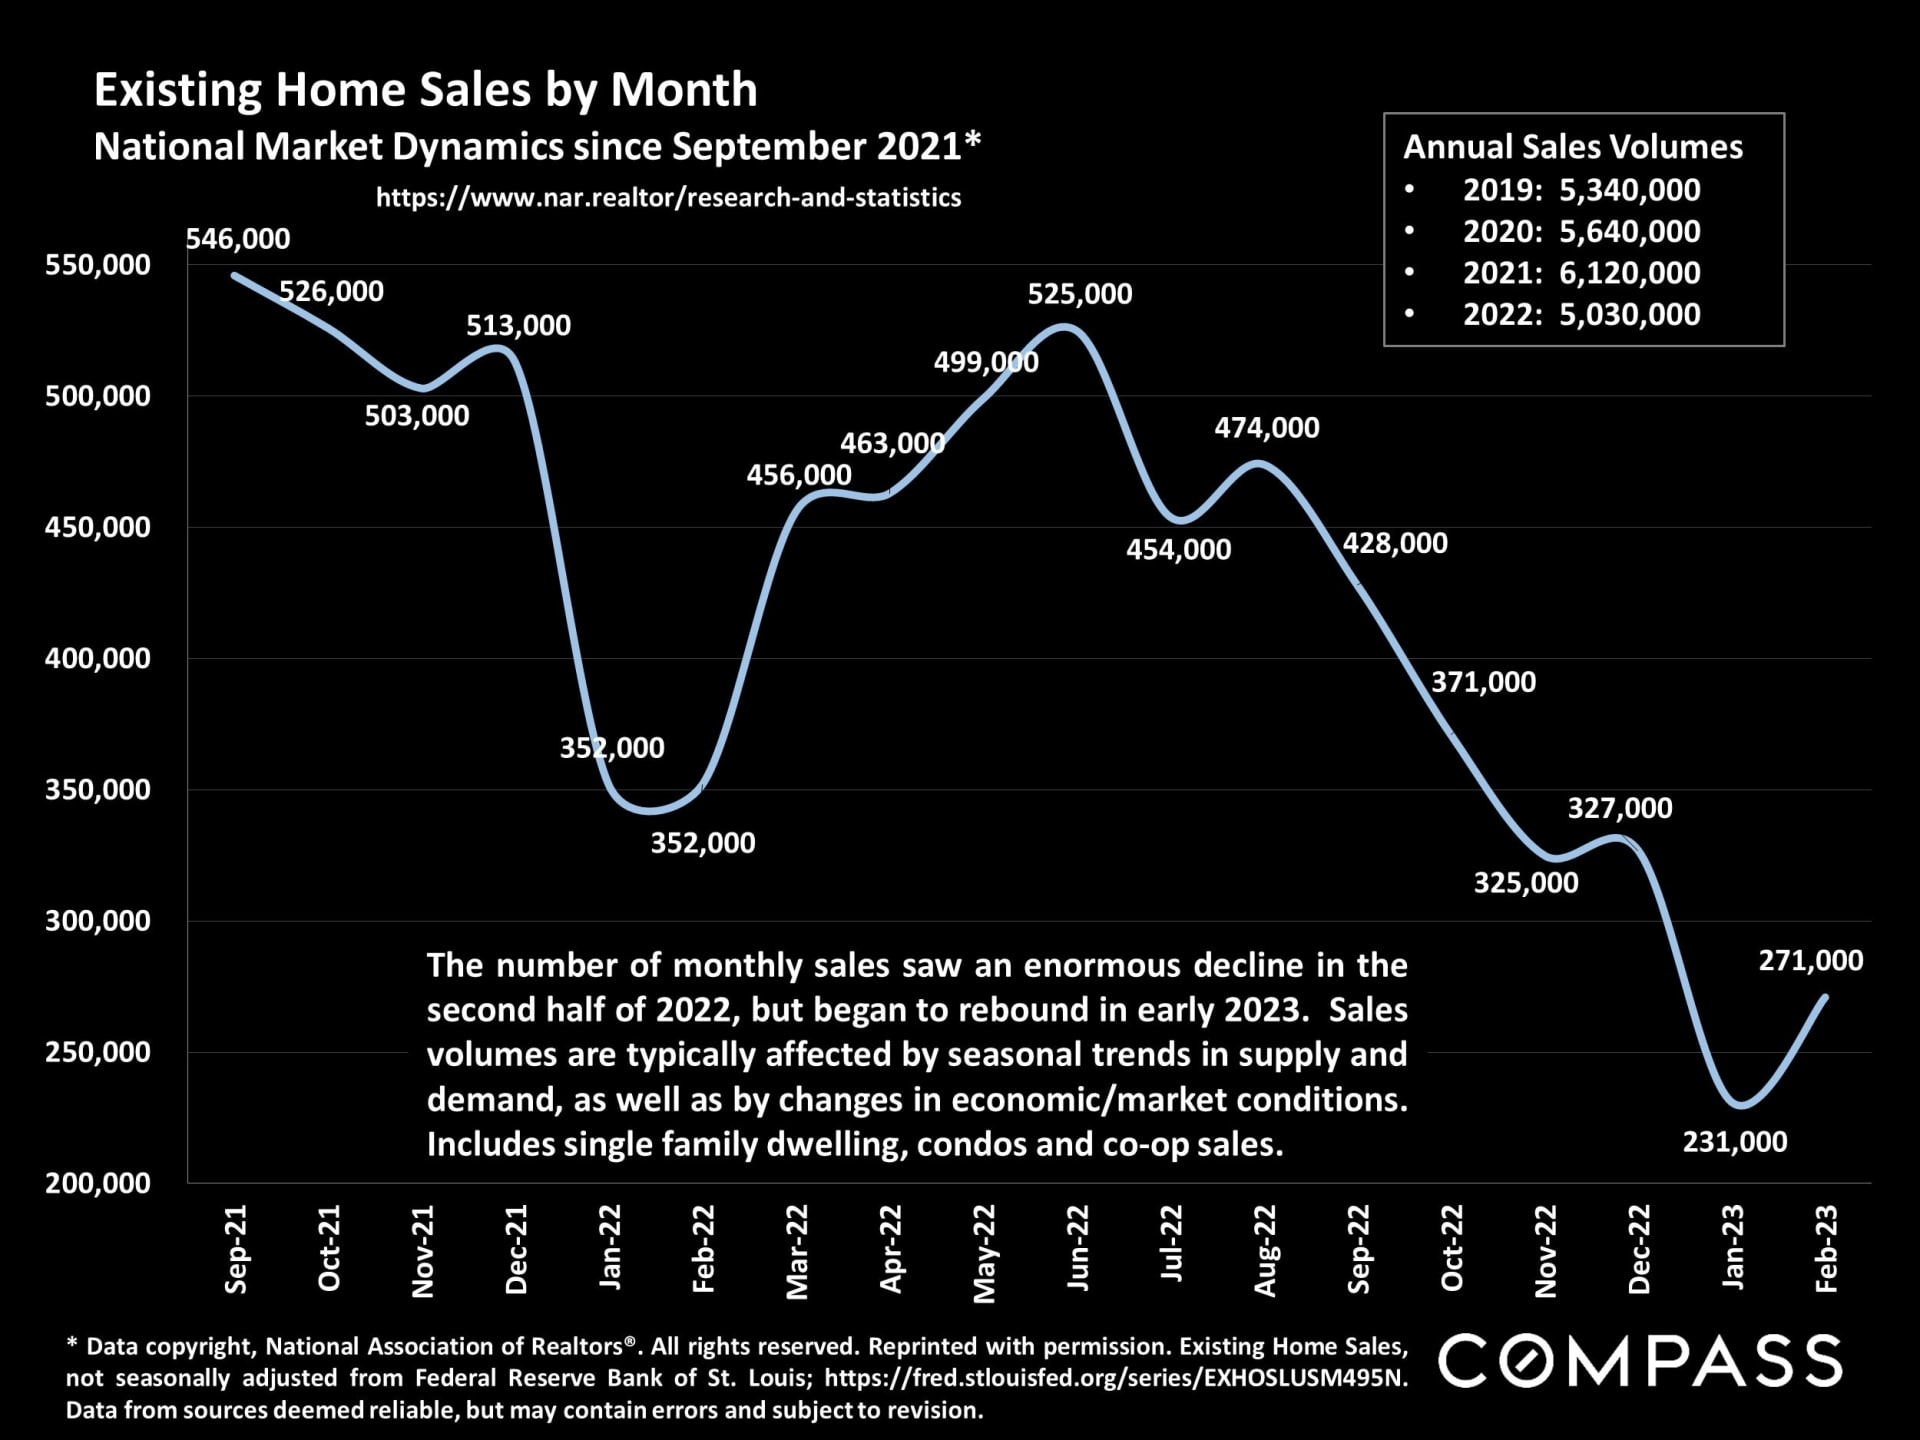
Chart of monthly national existing-home sales, September 2021–February 2023, with annual sales totals for 2019–2022.

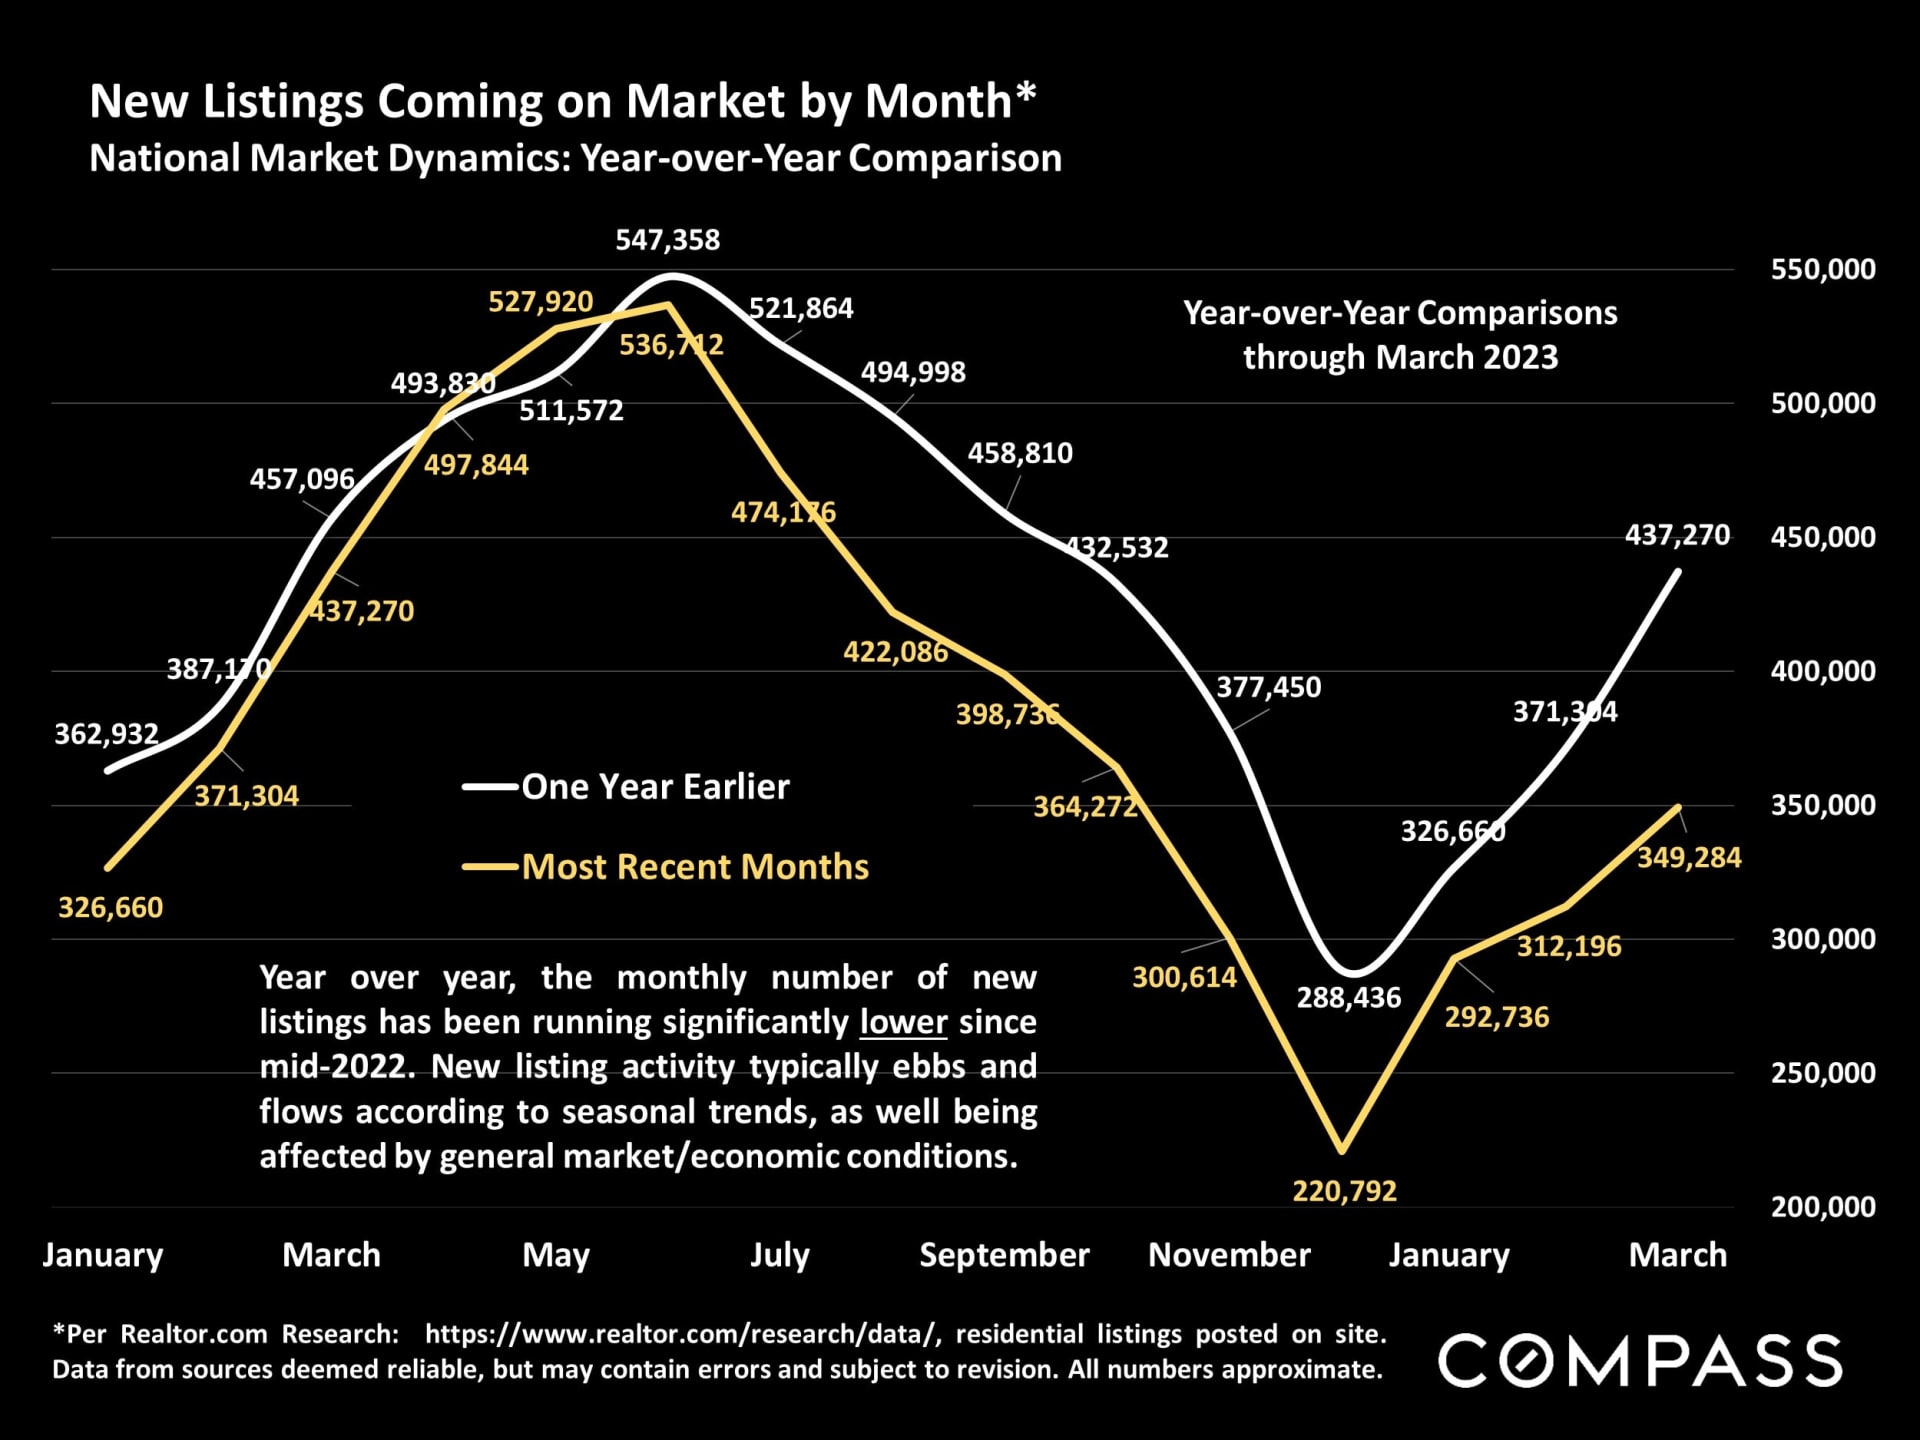
Line chart comparing monthly national new listings year over year, showing lower recent counts and a winter low.

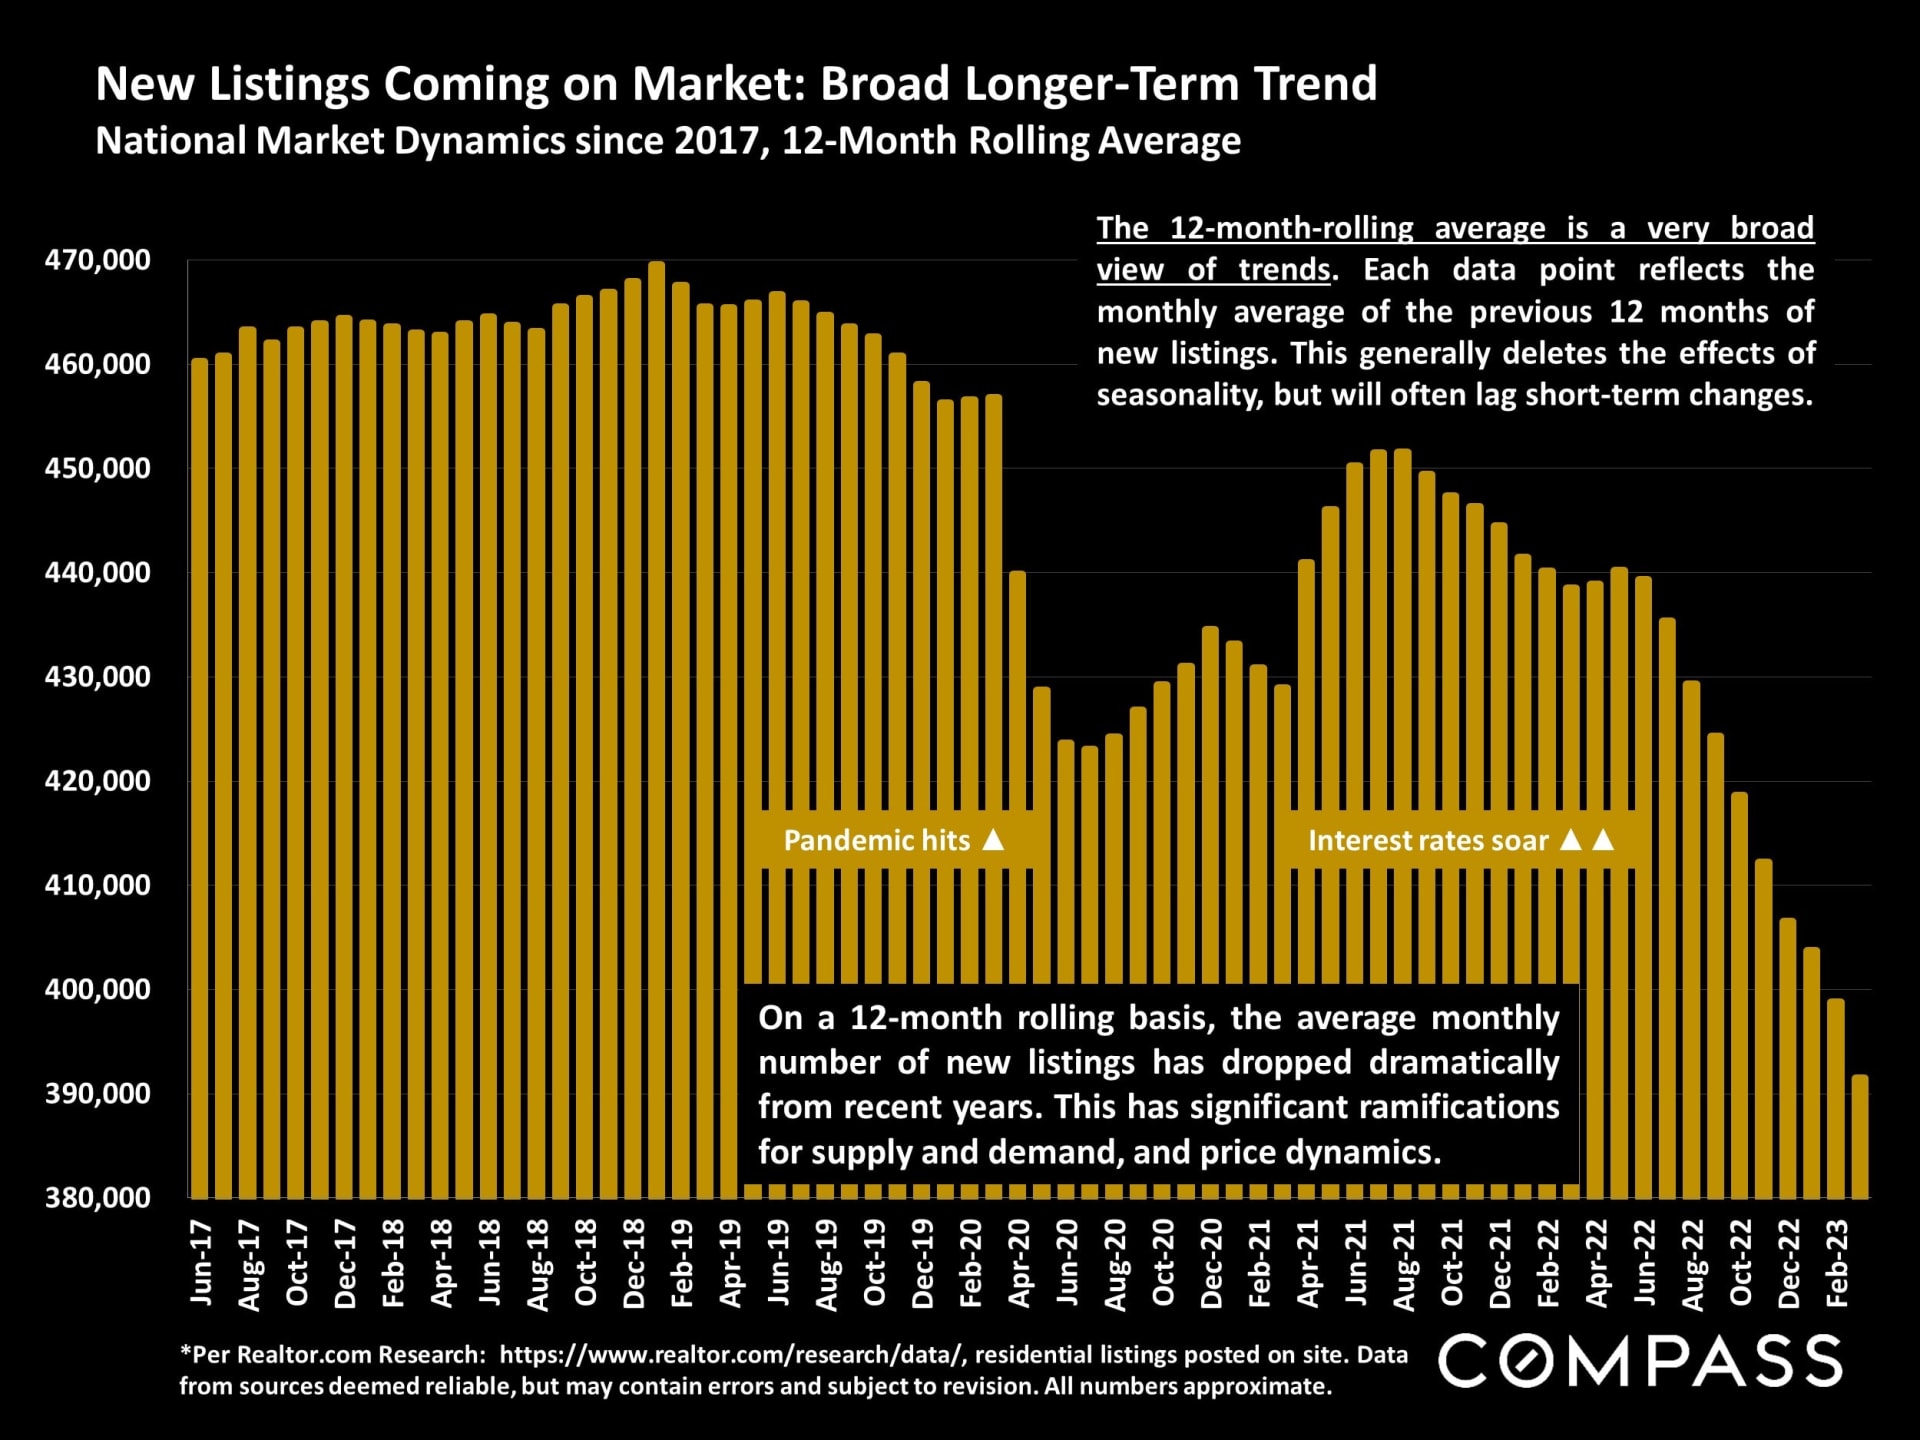
Bar chart shows U.S. new listings falling to about 390,000 by February 2023.

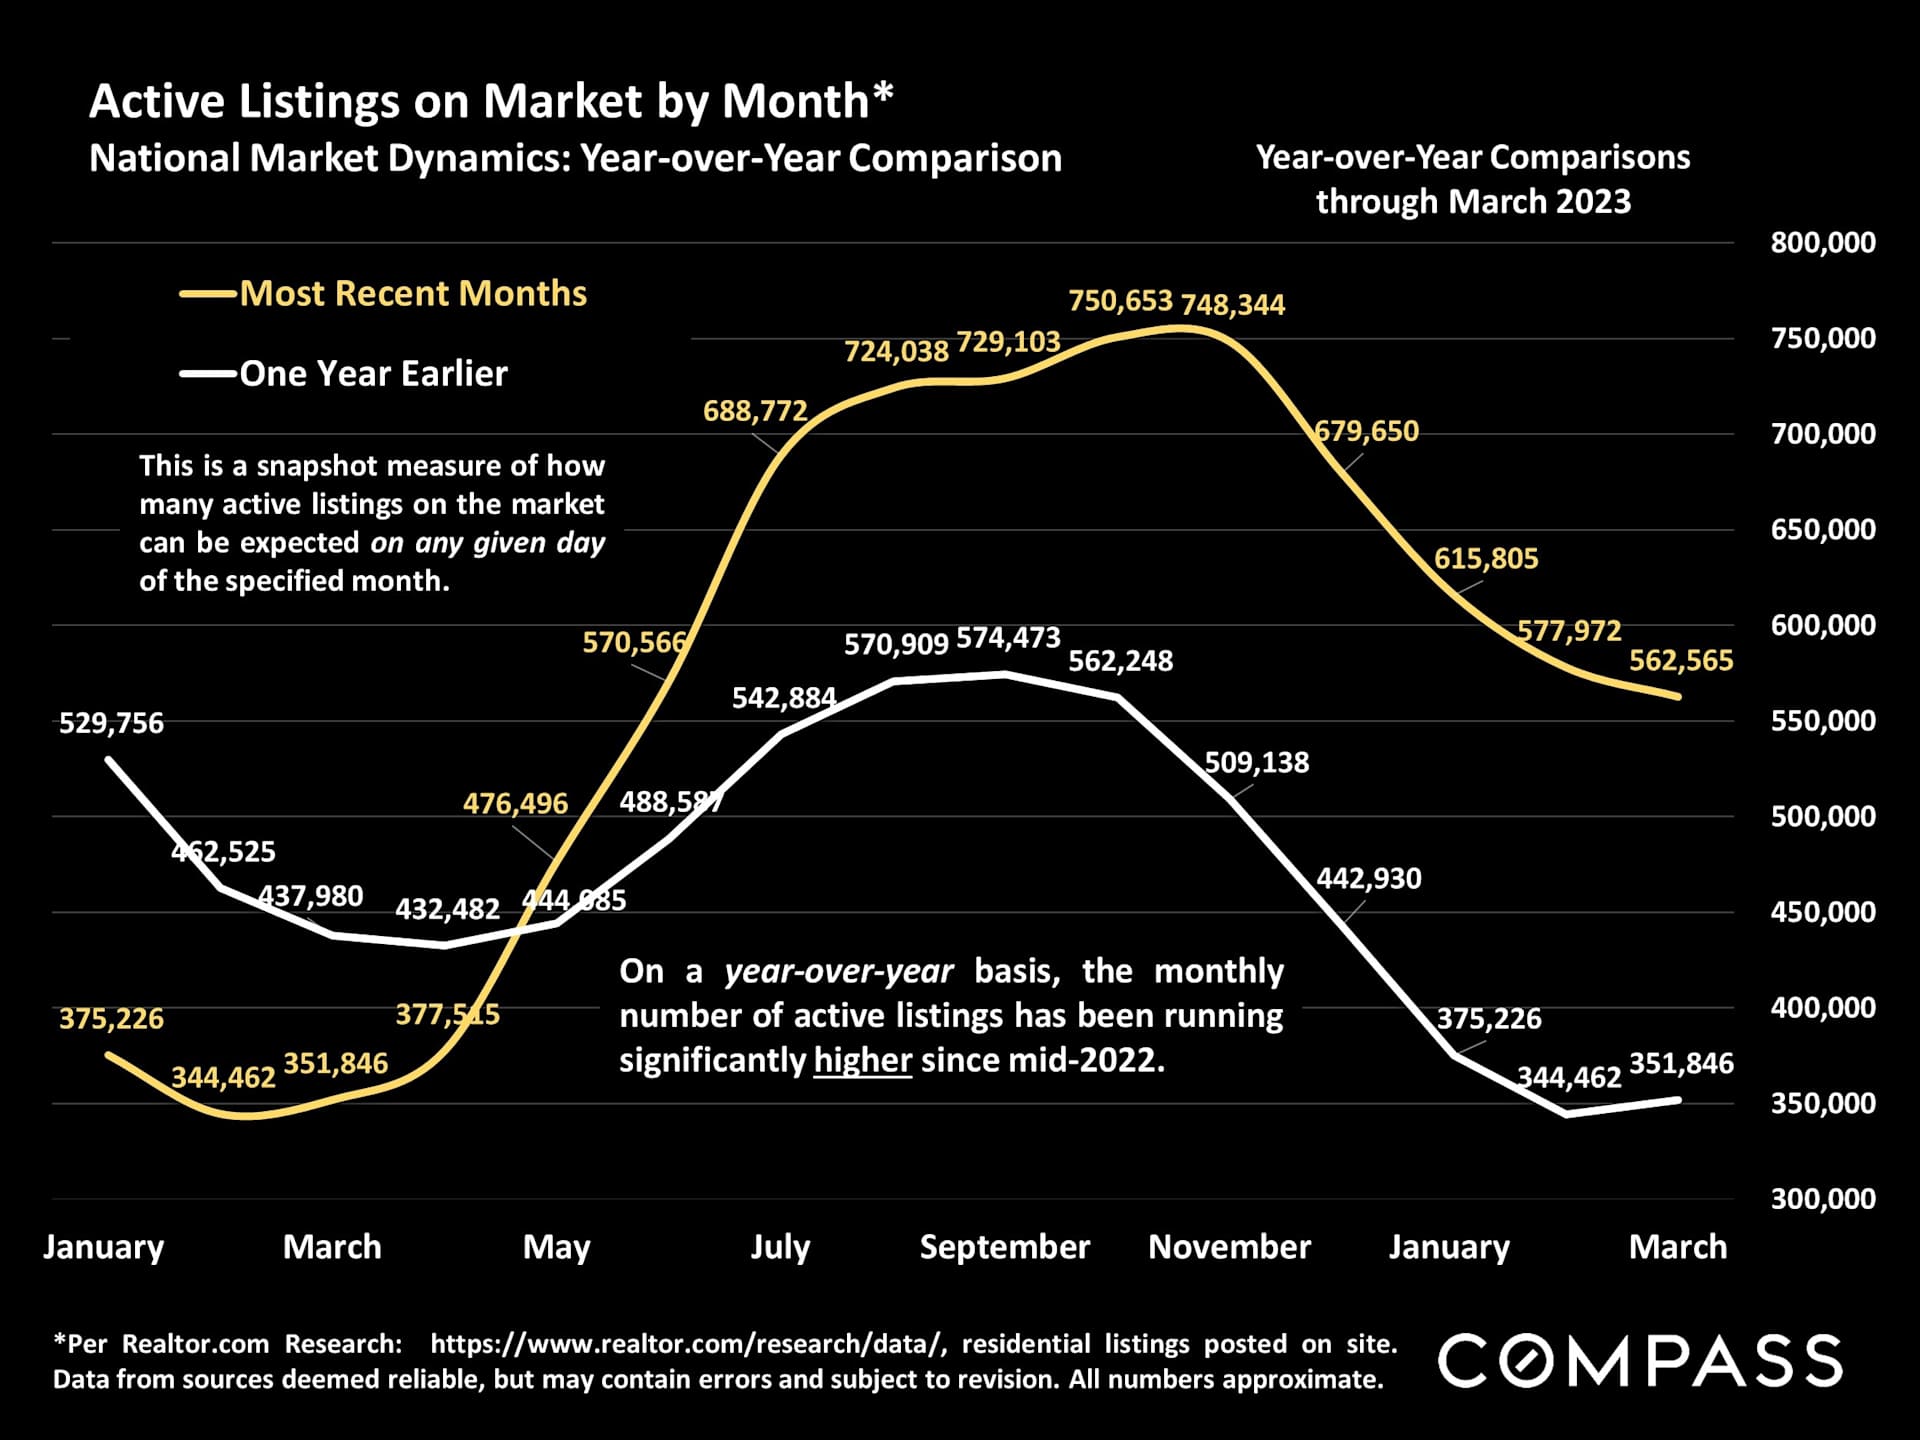
Line chart comparing monthly national active listings, with recent counts higher than one year earlier since mid-2022.

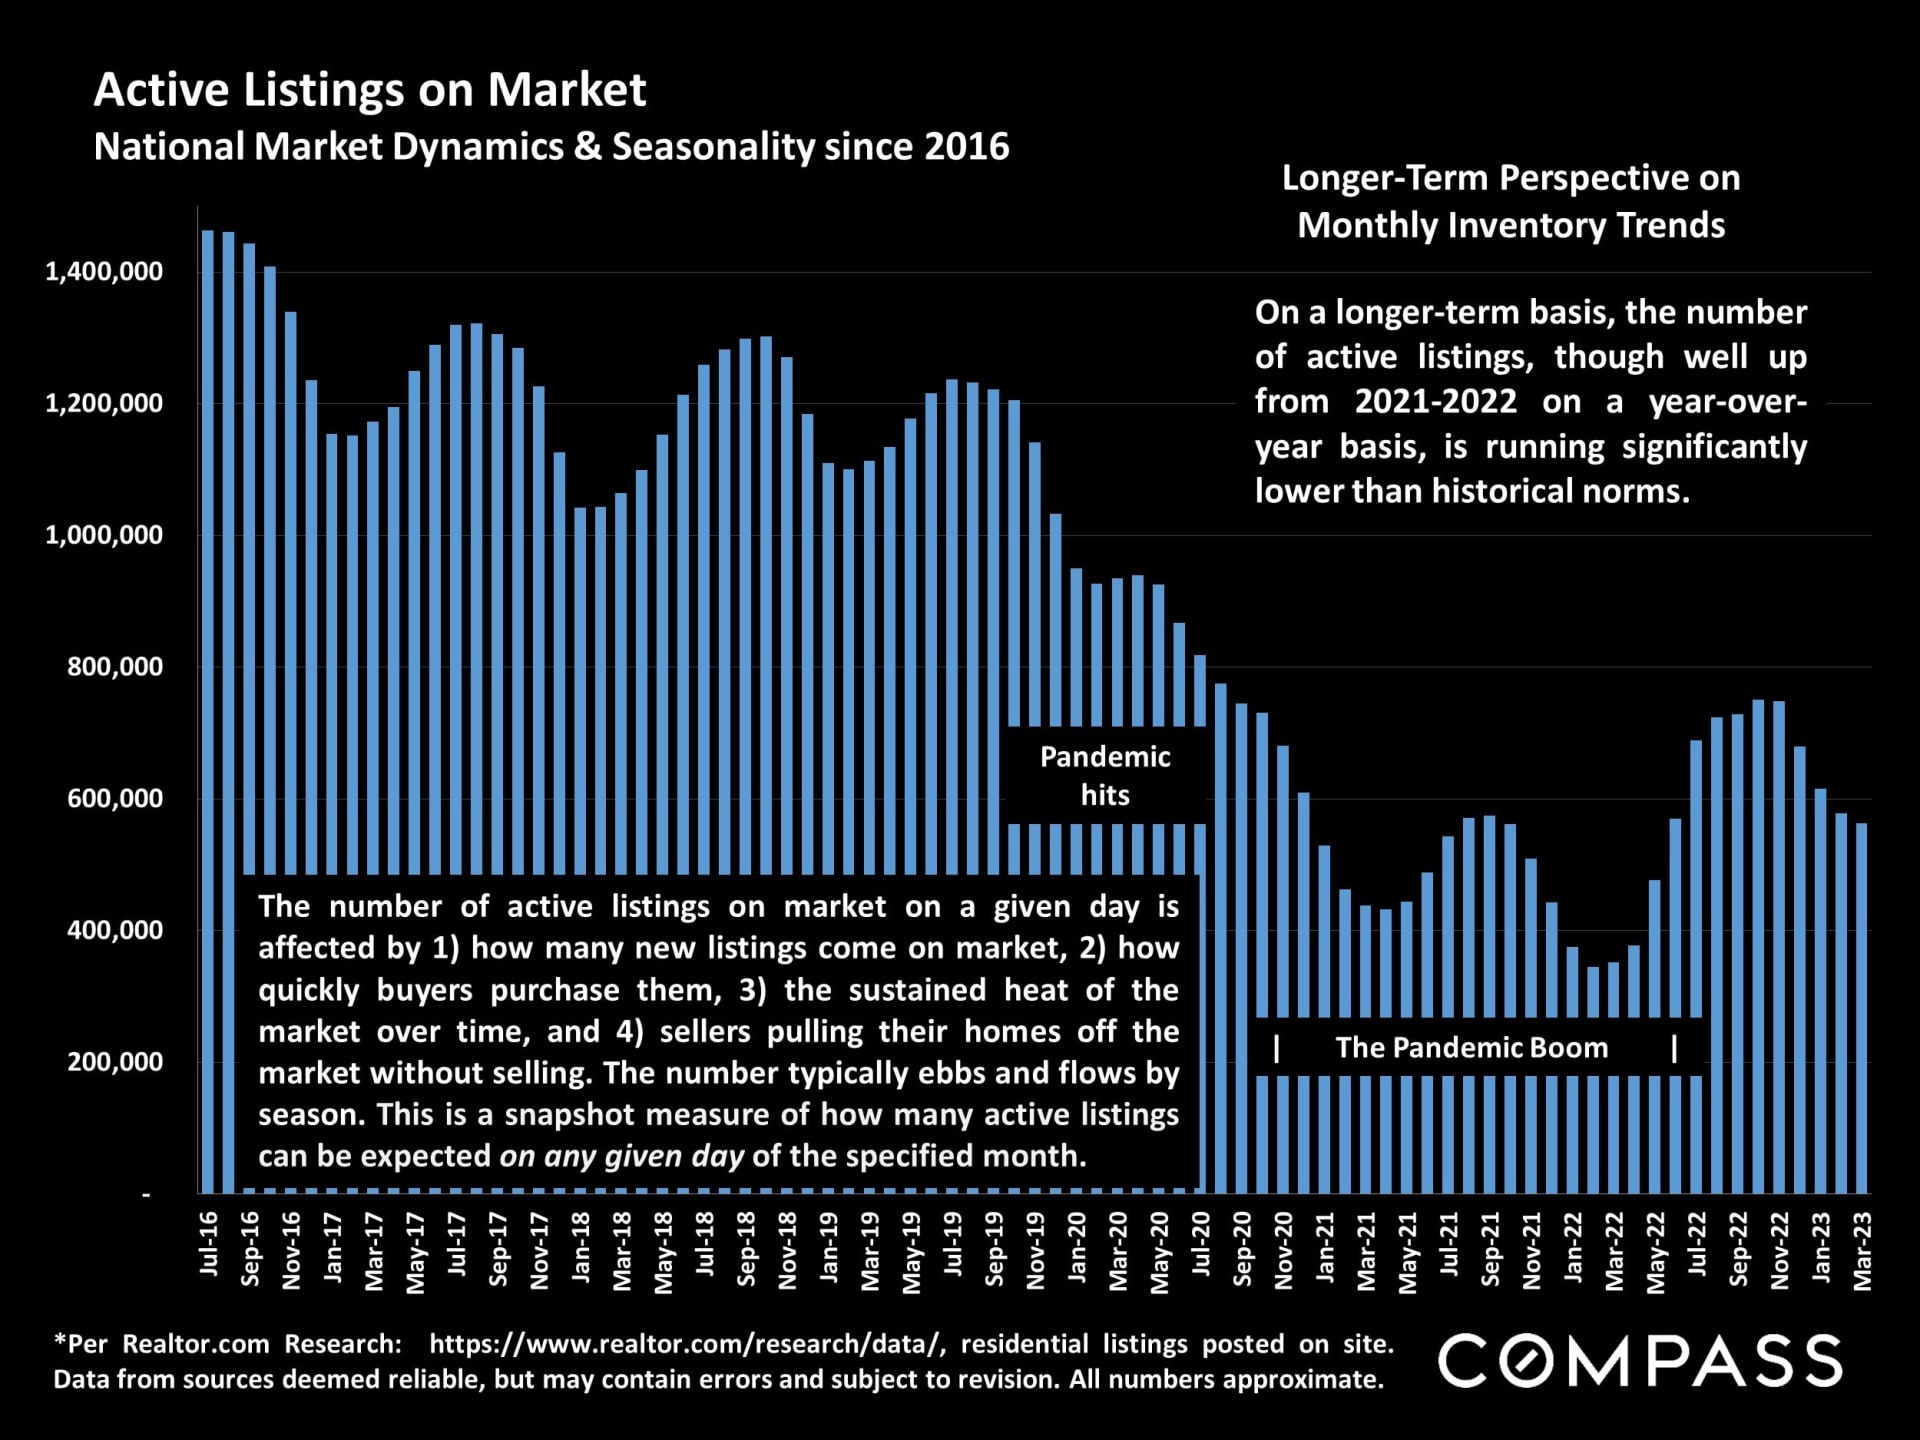
Bar chart of national active listings from 2016 to 2023, showing pandemic-era inventory changes and seasonal trends.

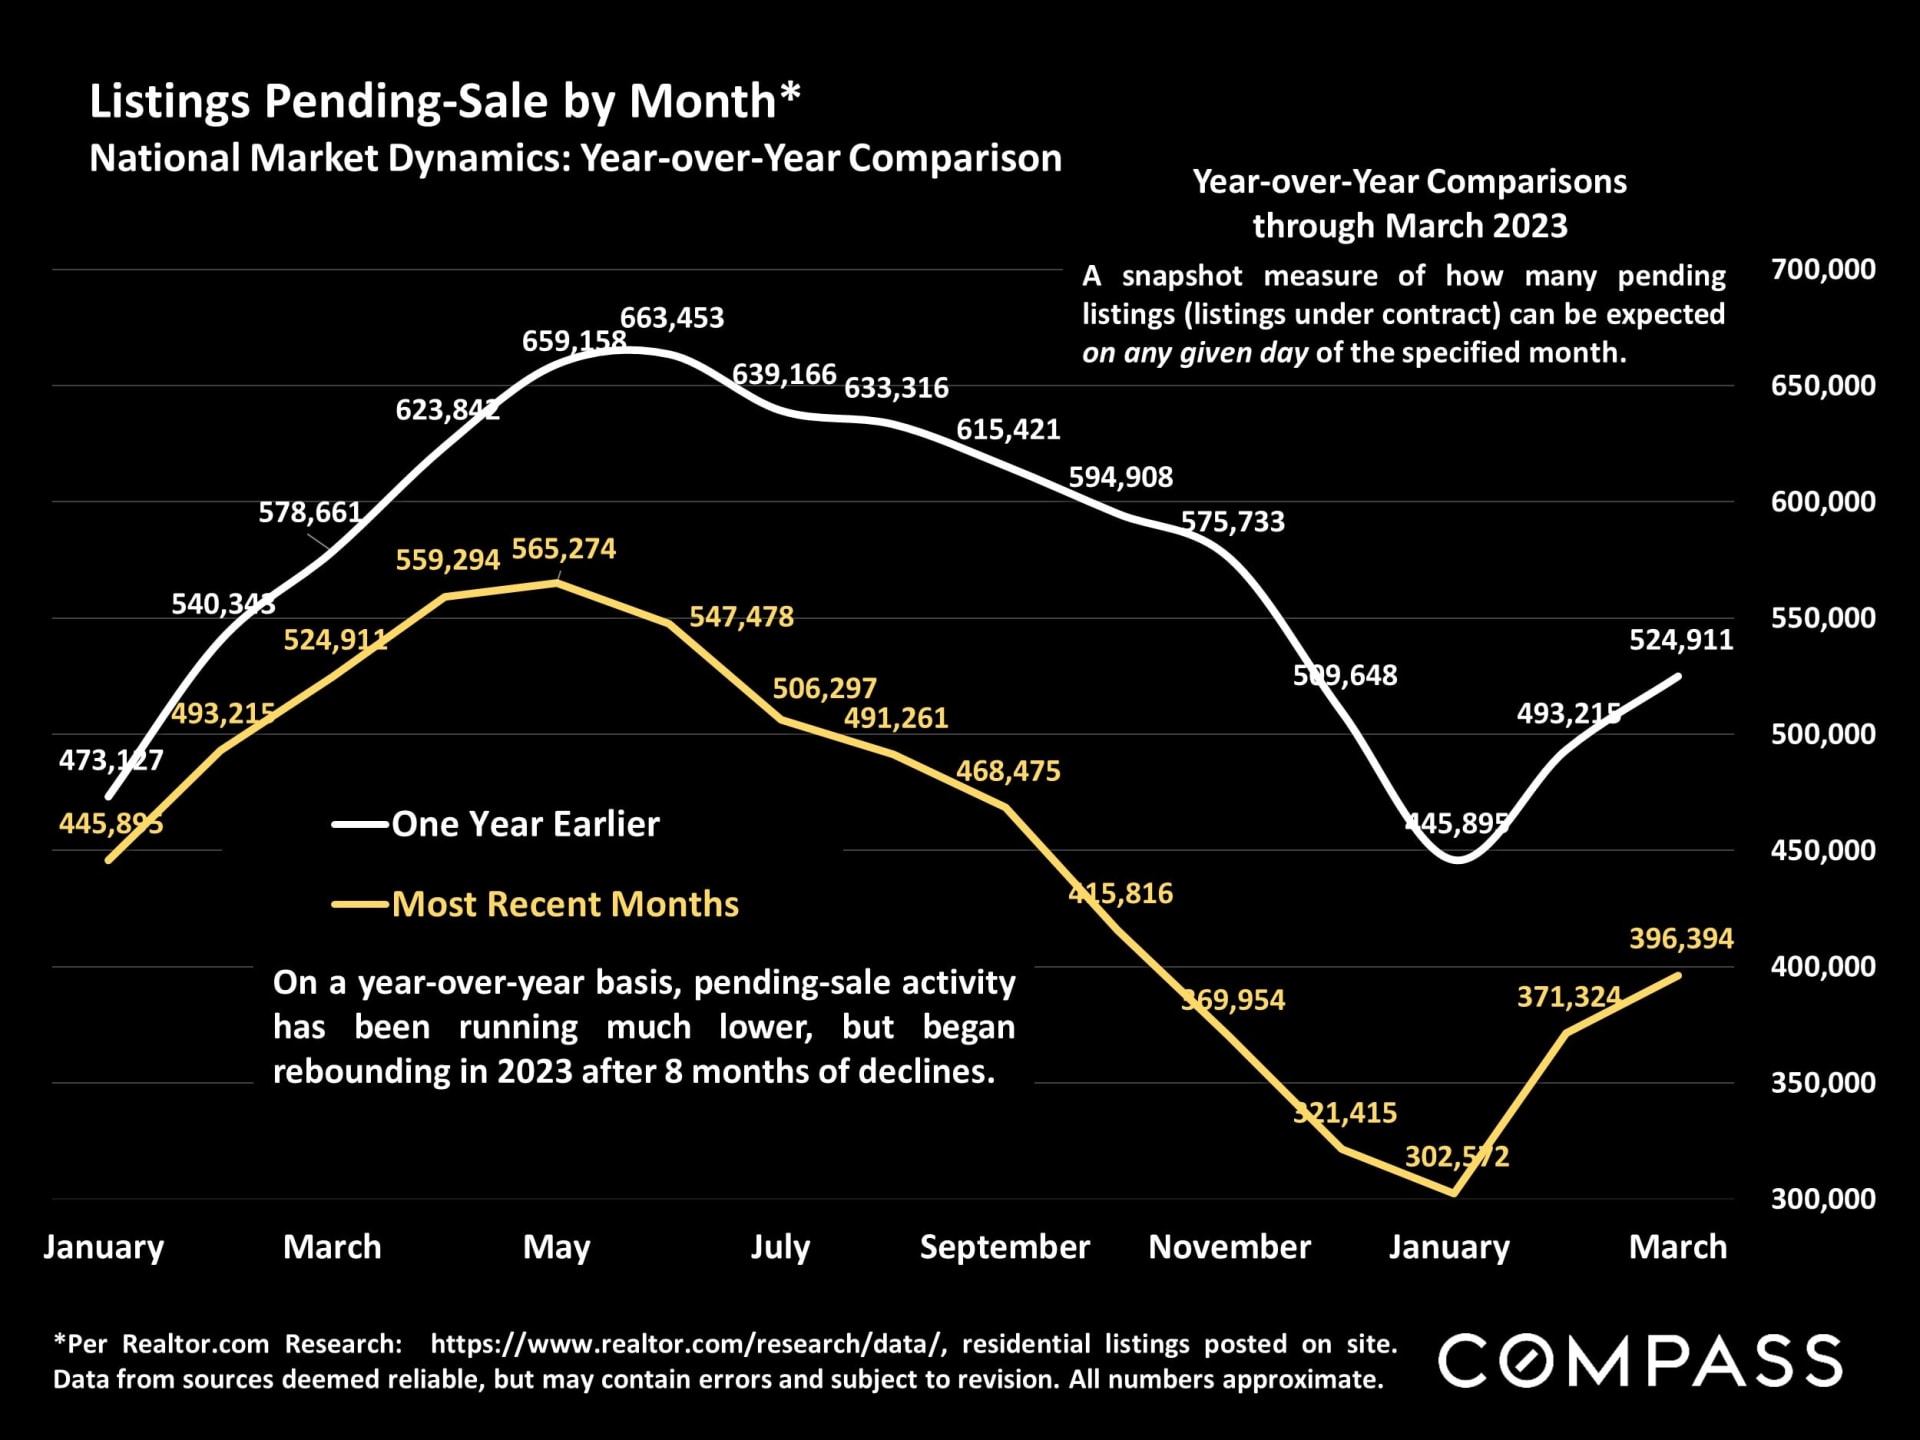
Line chart comparing national pending home listings by month across two years through March 2023.

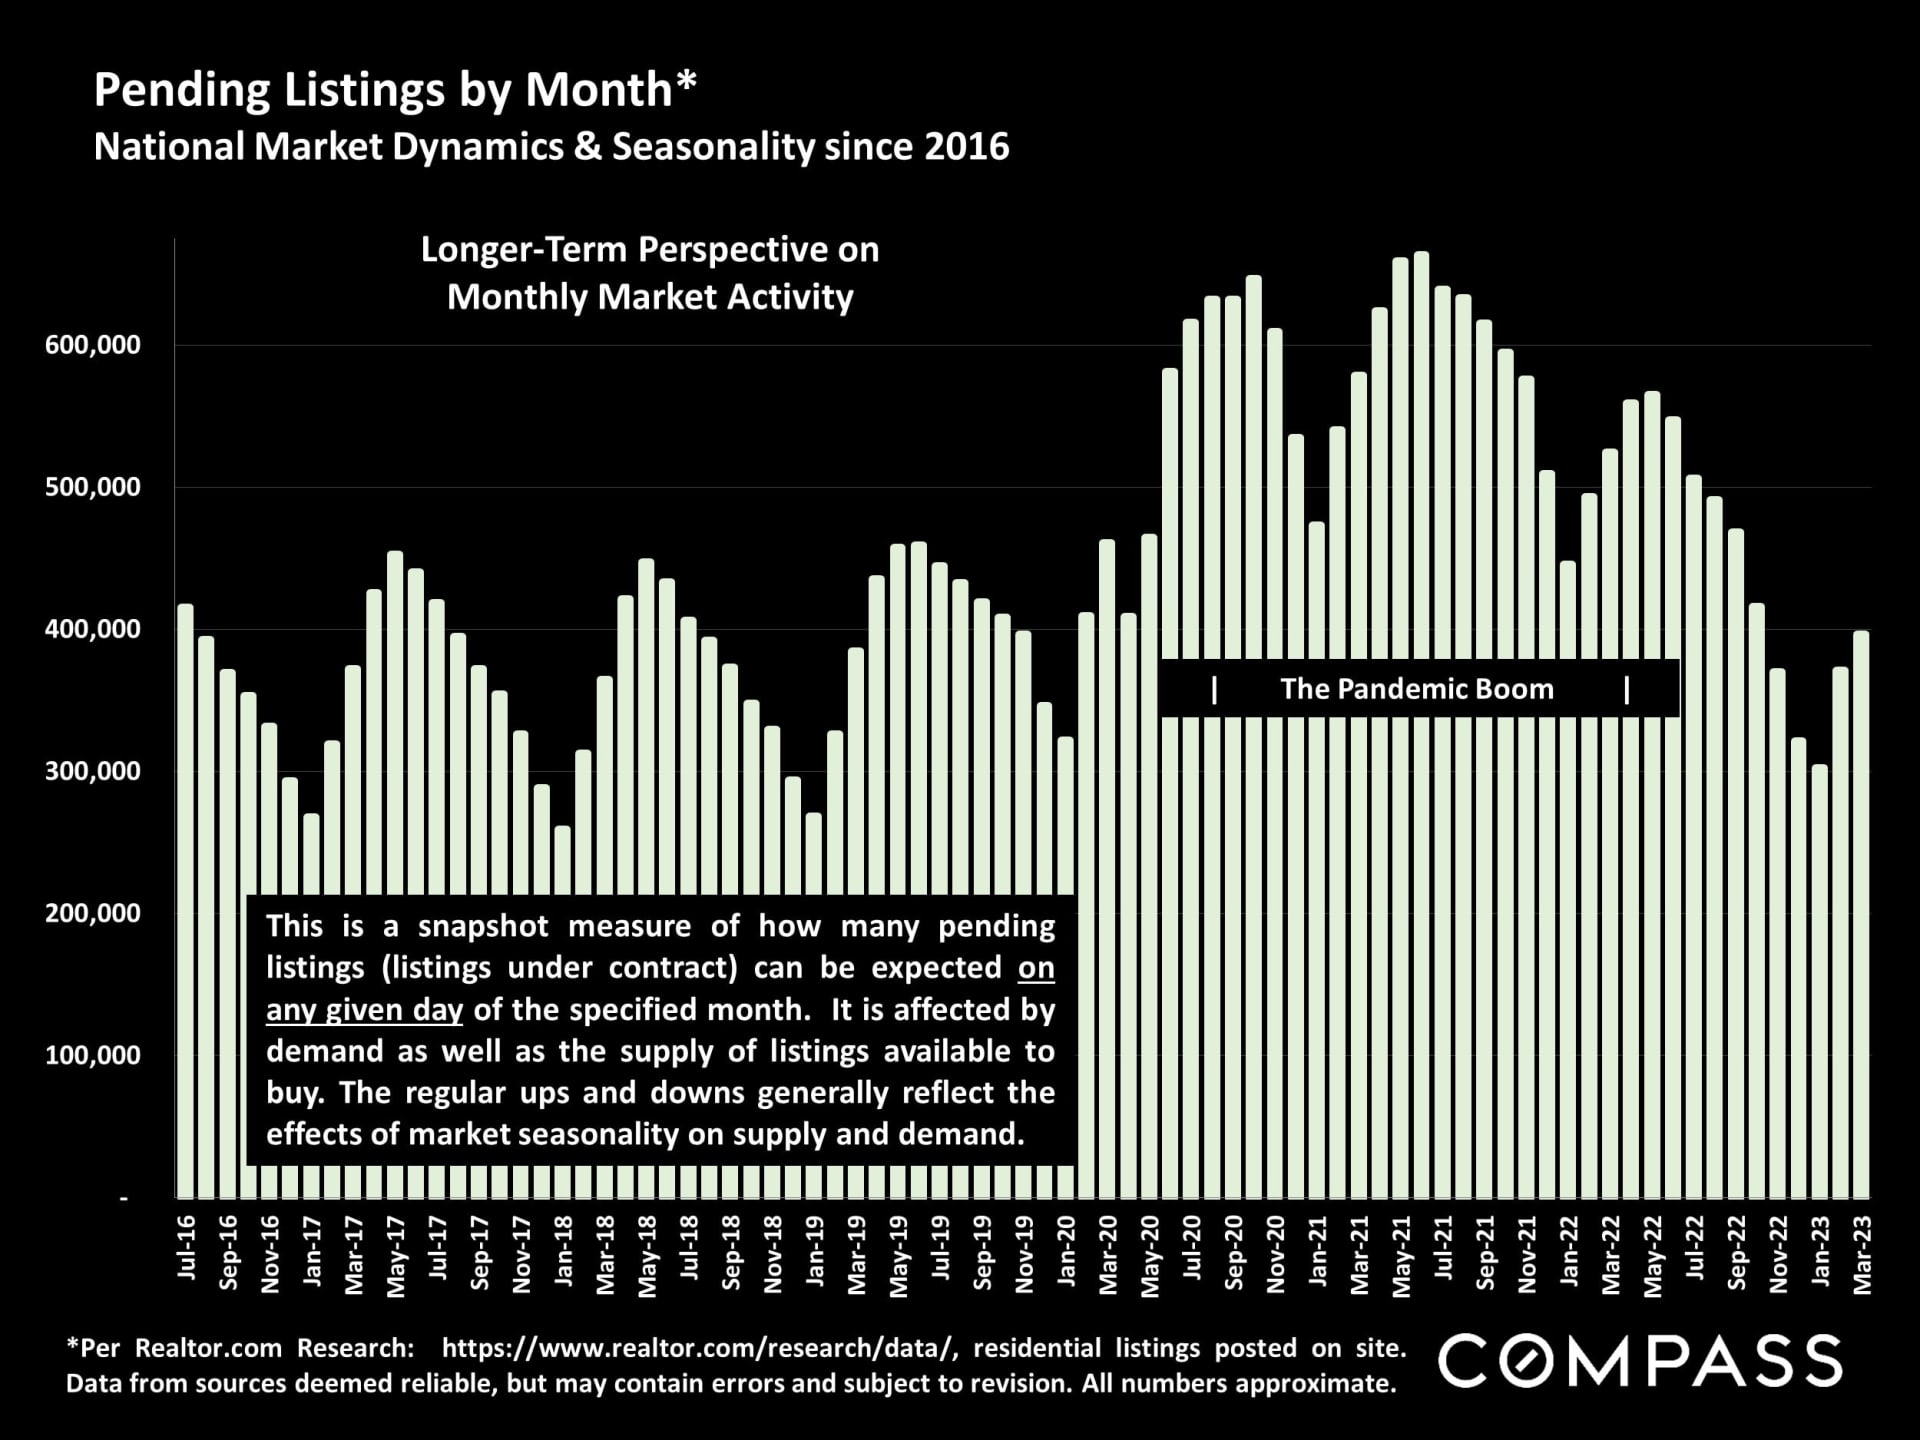
Chart of monthly national pending listings, July 2016 to March 2023, highlighting the pandemic boom.

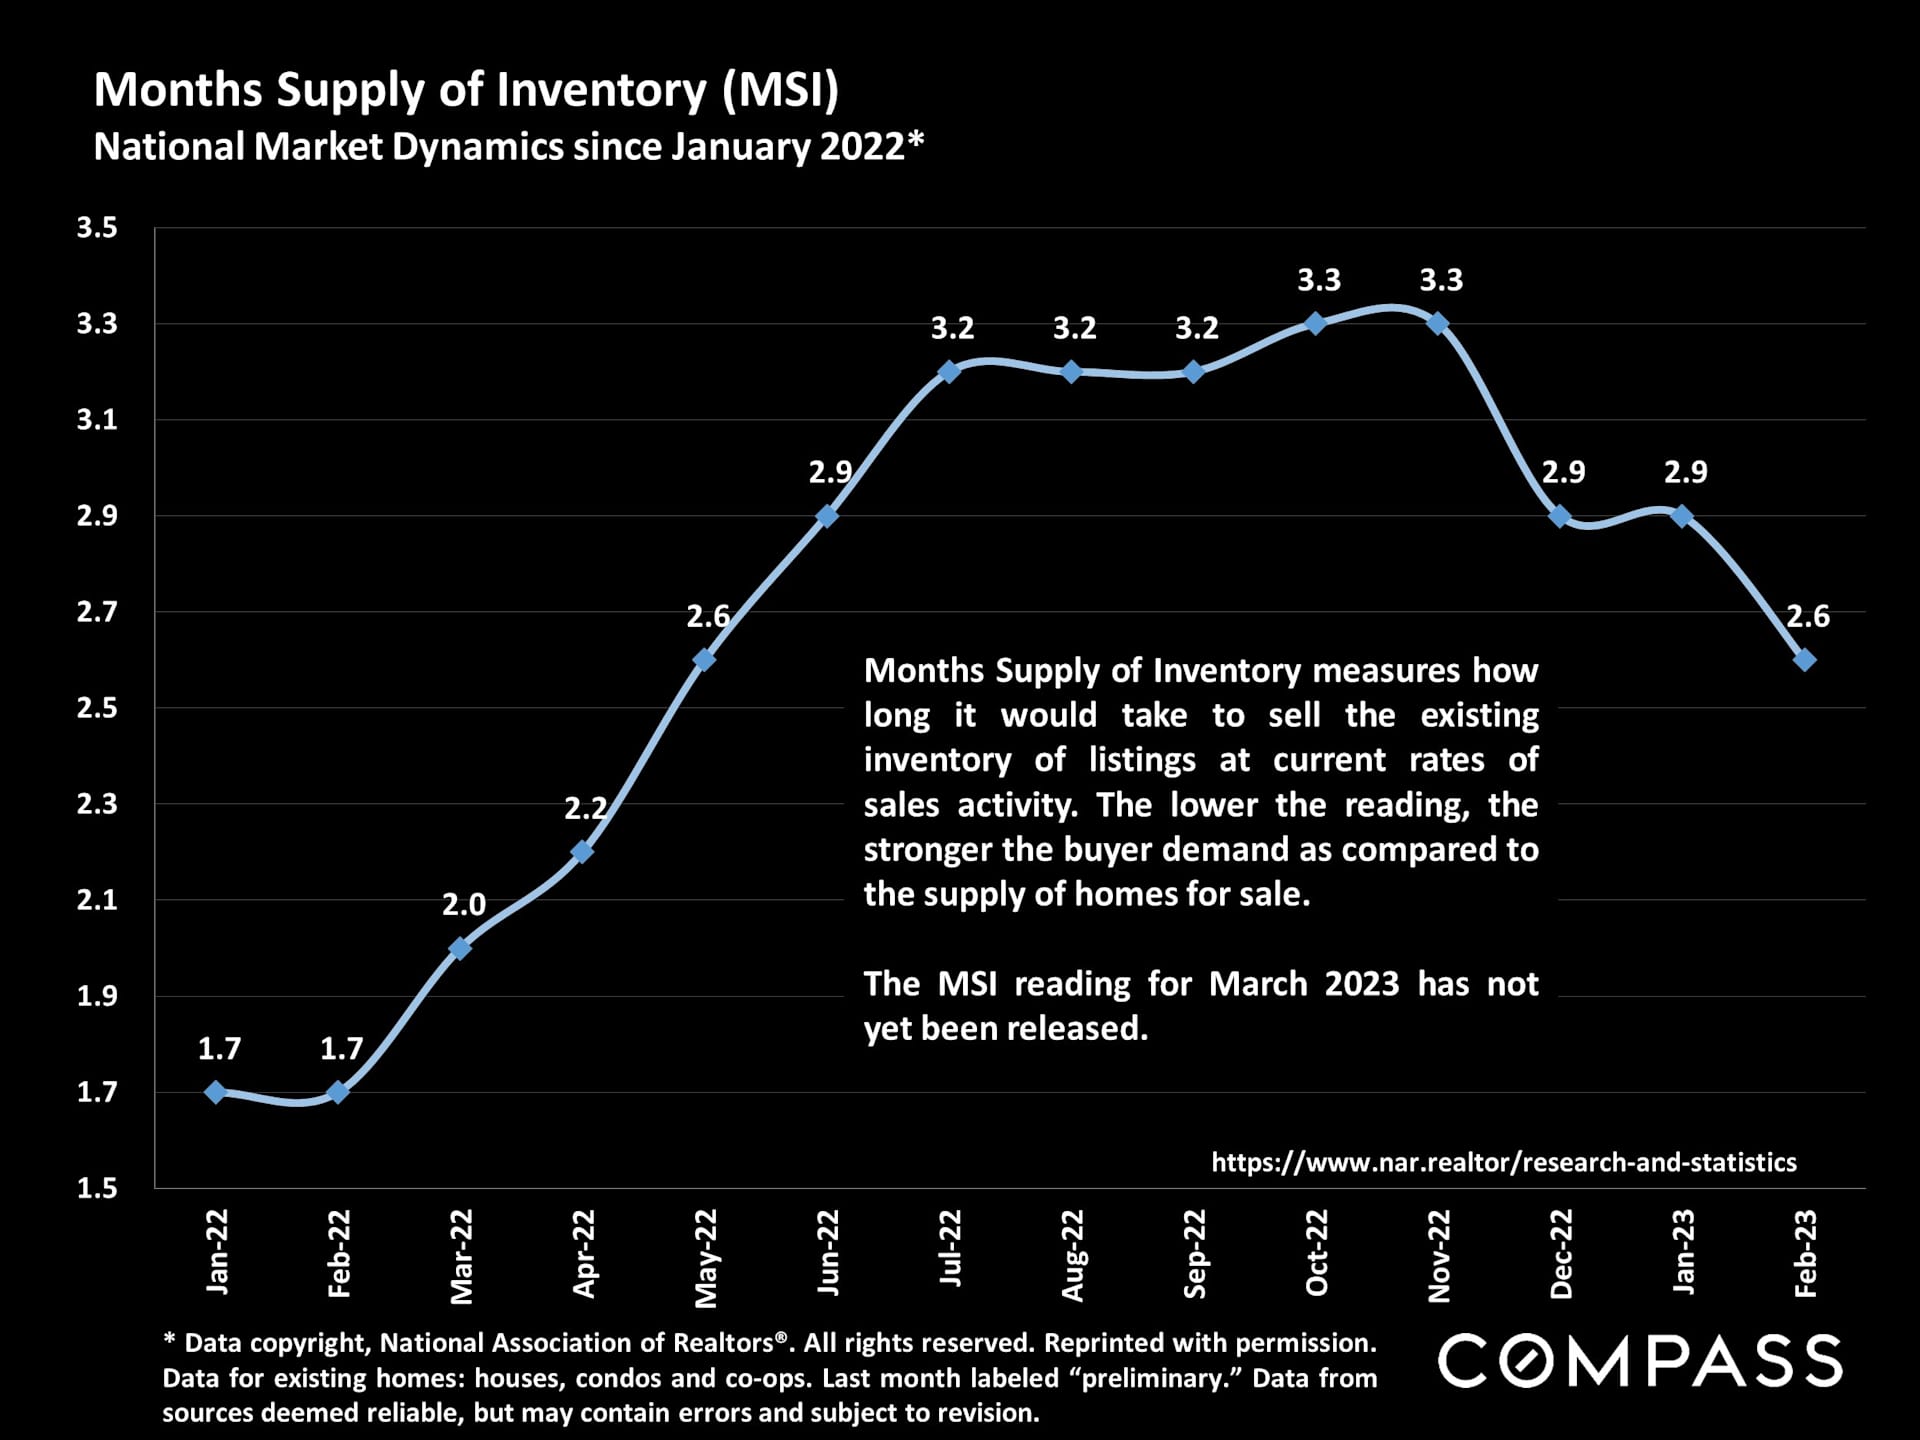
Chart of national months’ supply of home inventory, rising from 1.7 in January 2022 to 3.3 in fall 2022.

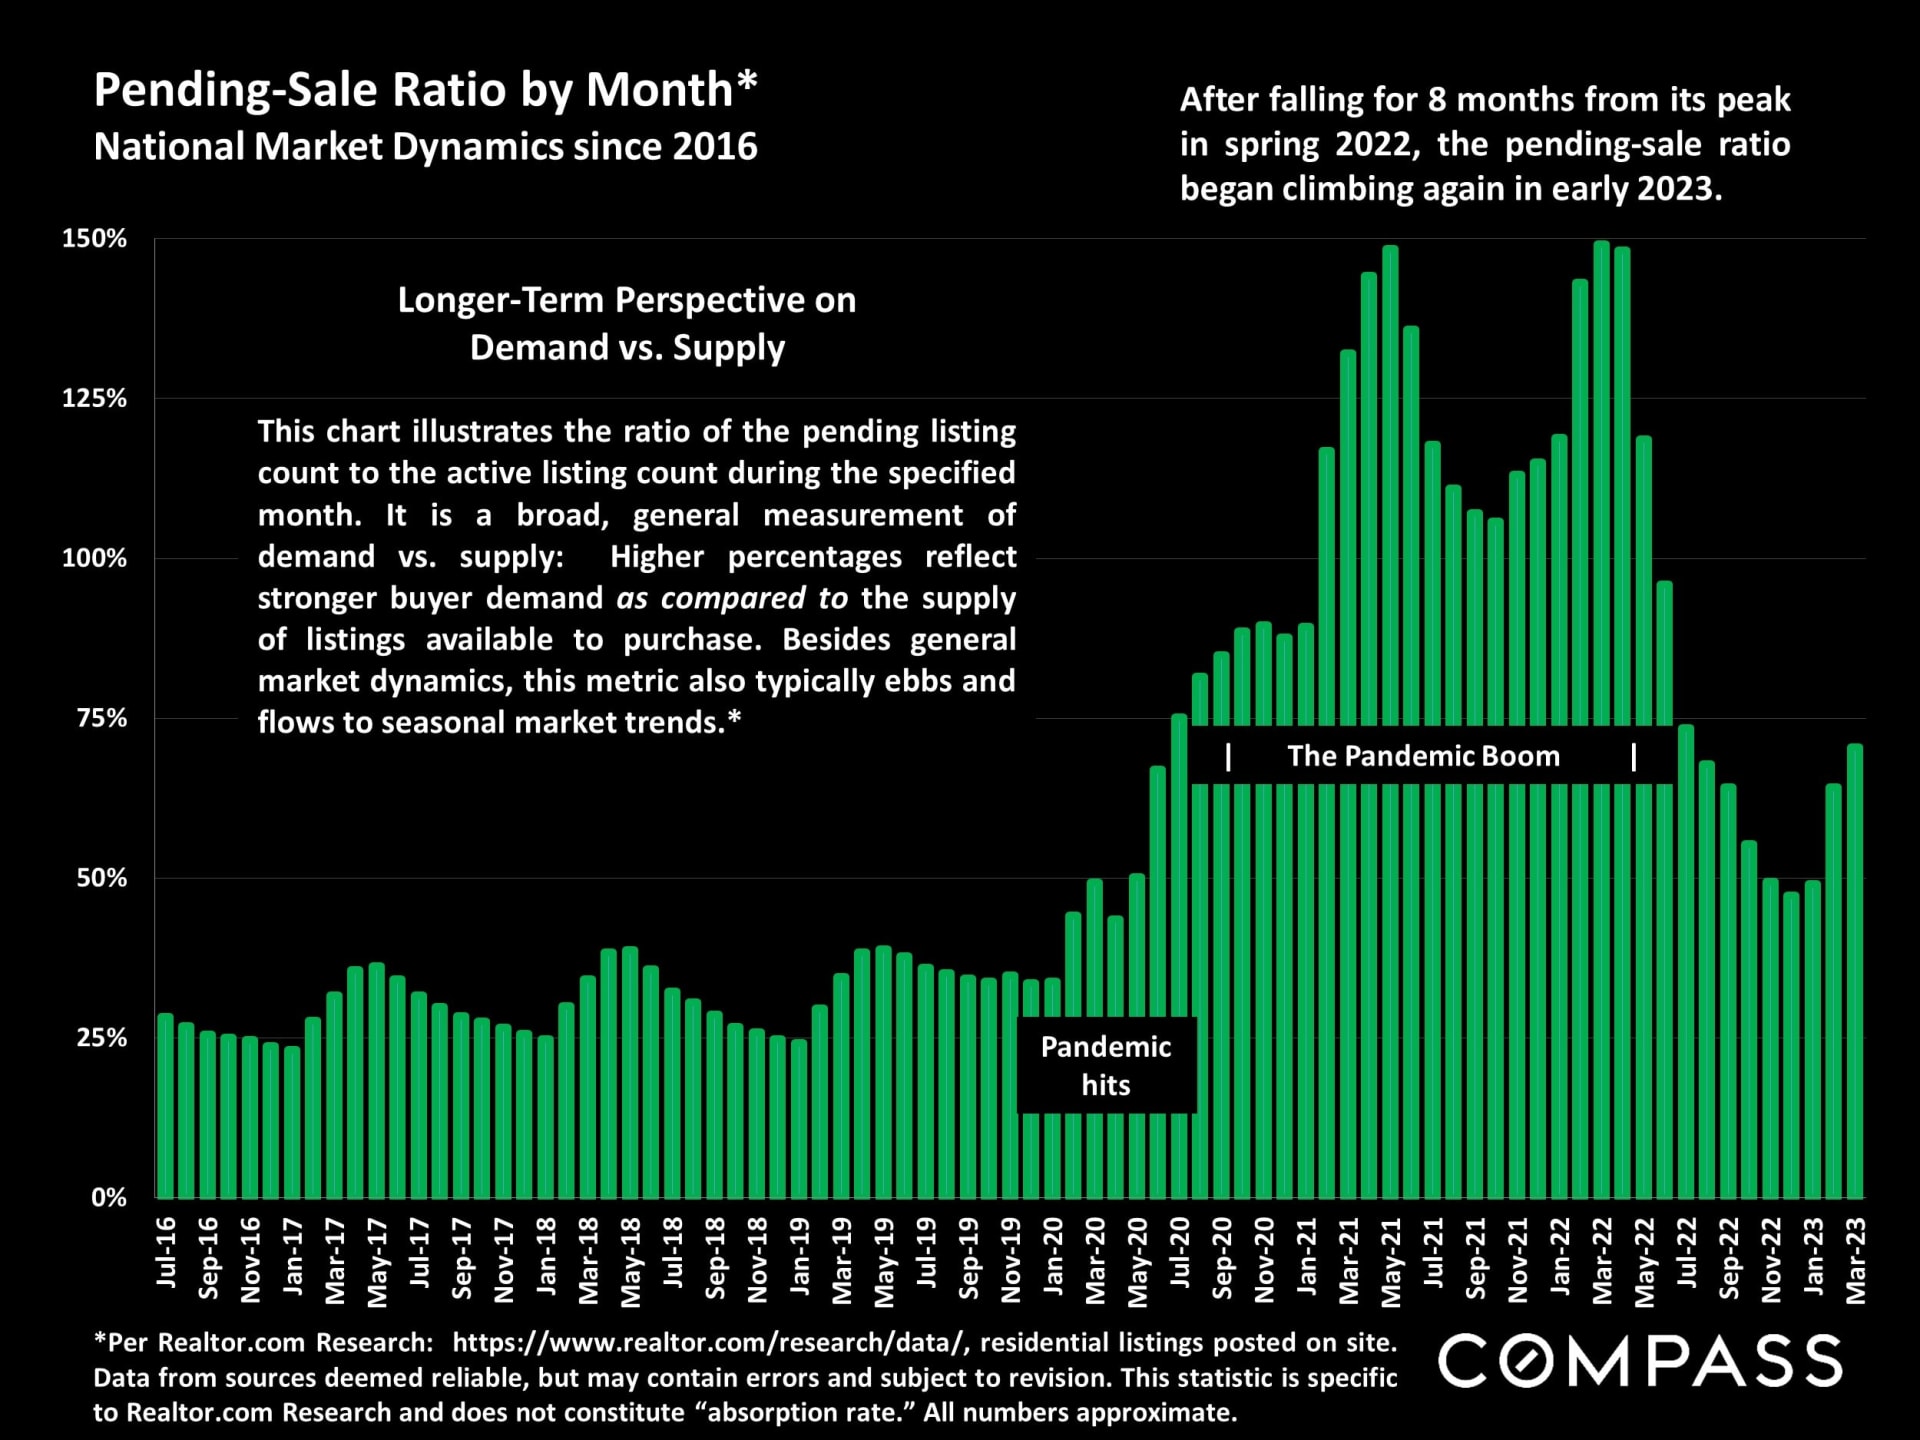
Chart of national pending-sale ratios from 2016 to 2023, with a pandemic-era boom and a 2023 rebound.

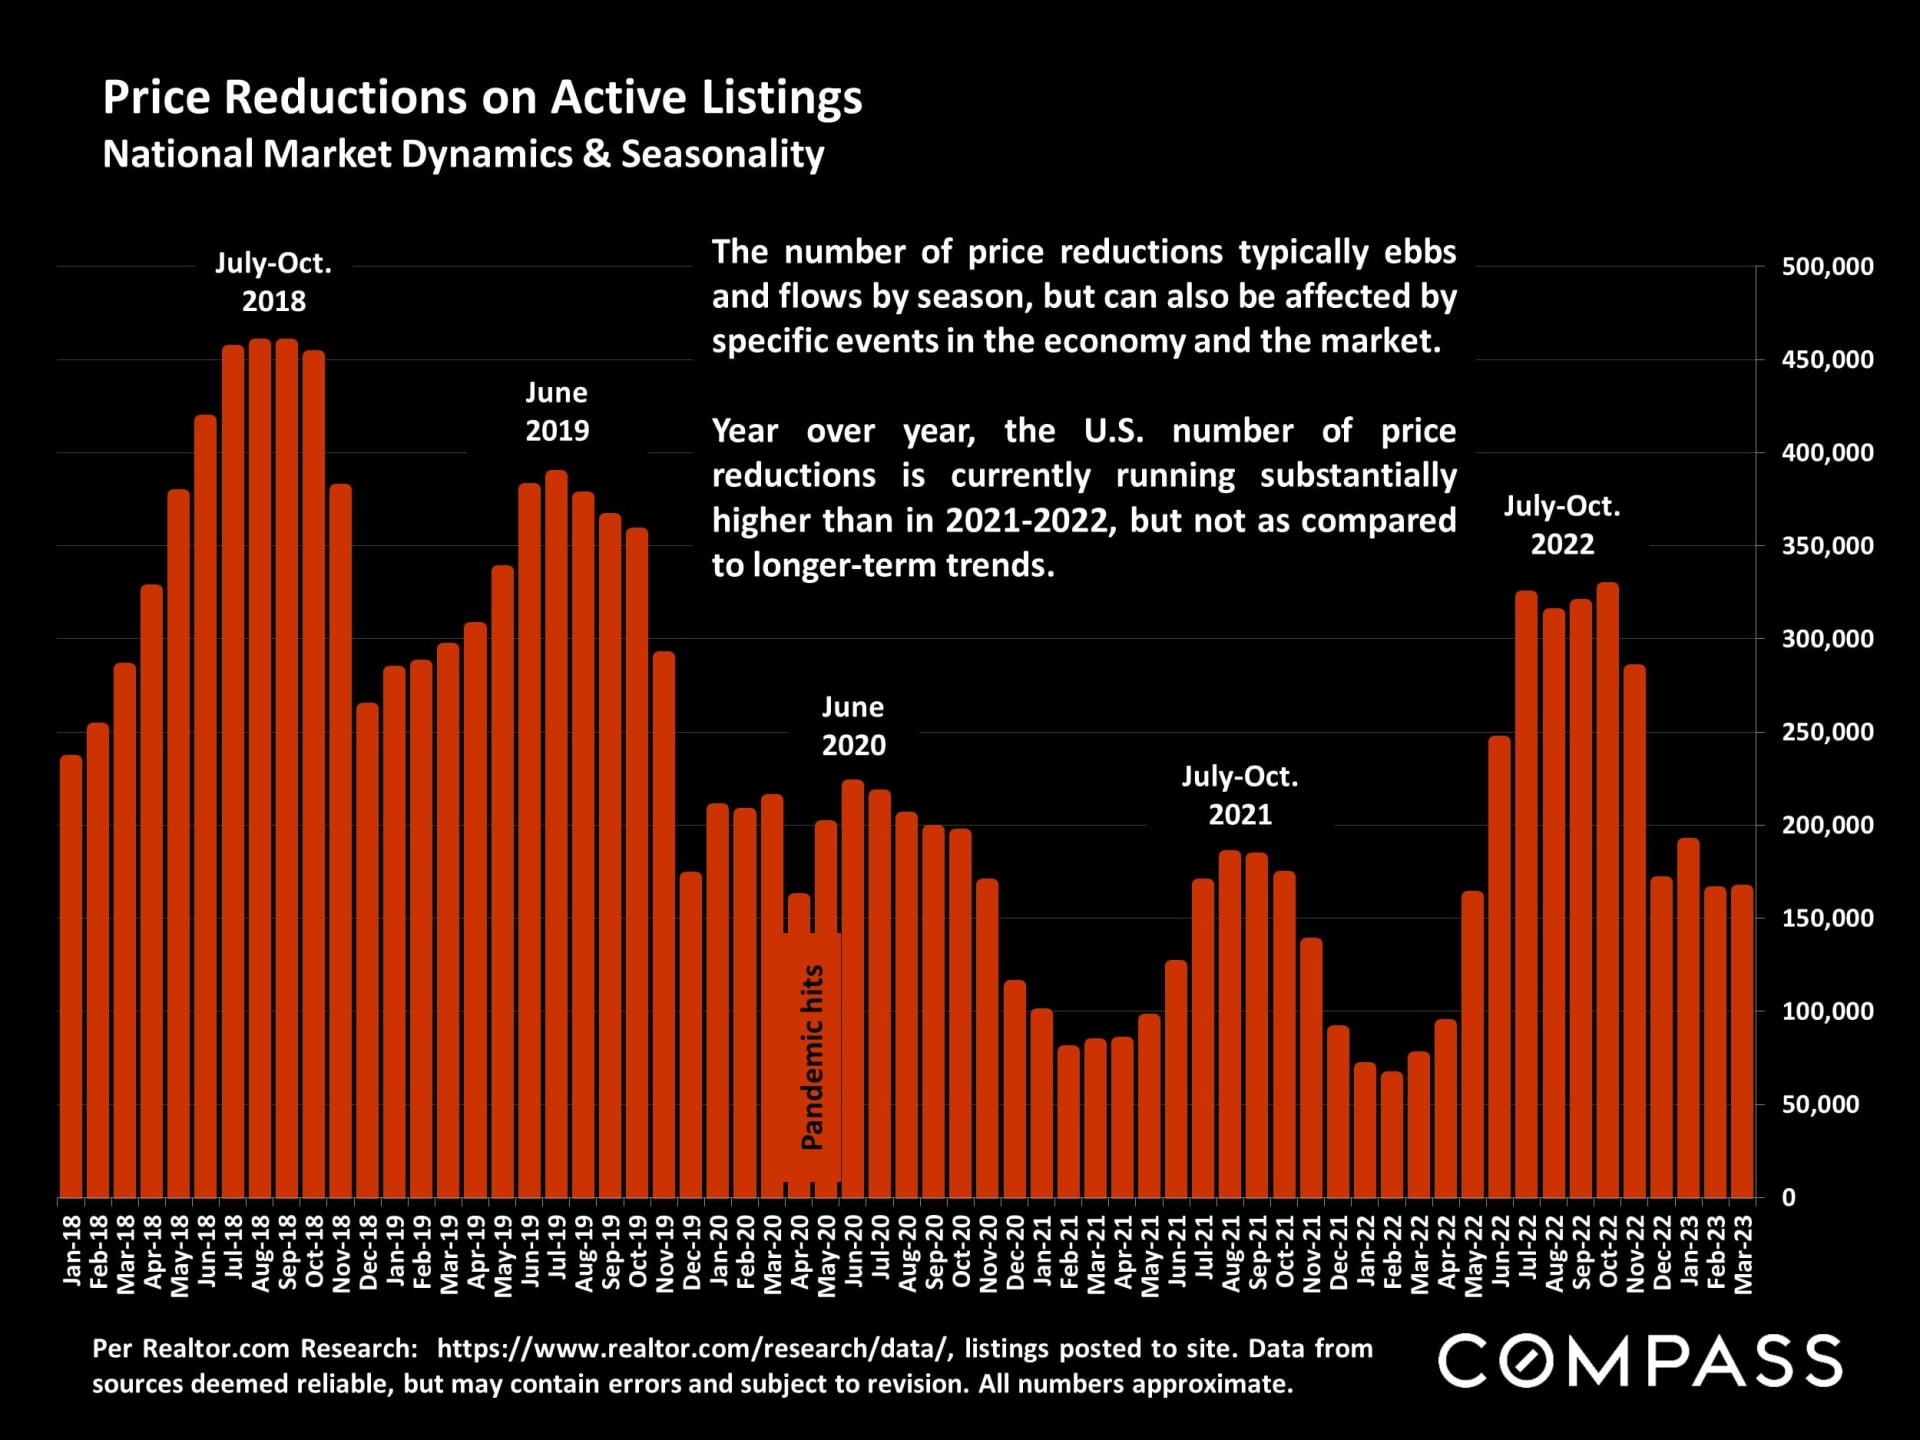
Chart of monthly U.S. listing price reductions from 2018 to 2023, with seasonal peaks and a pandemic-era decline.
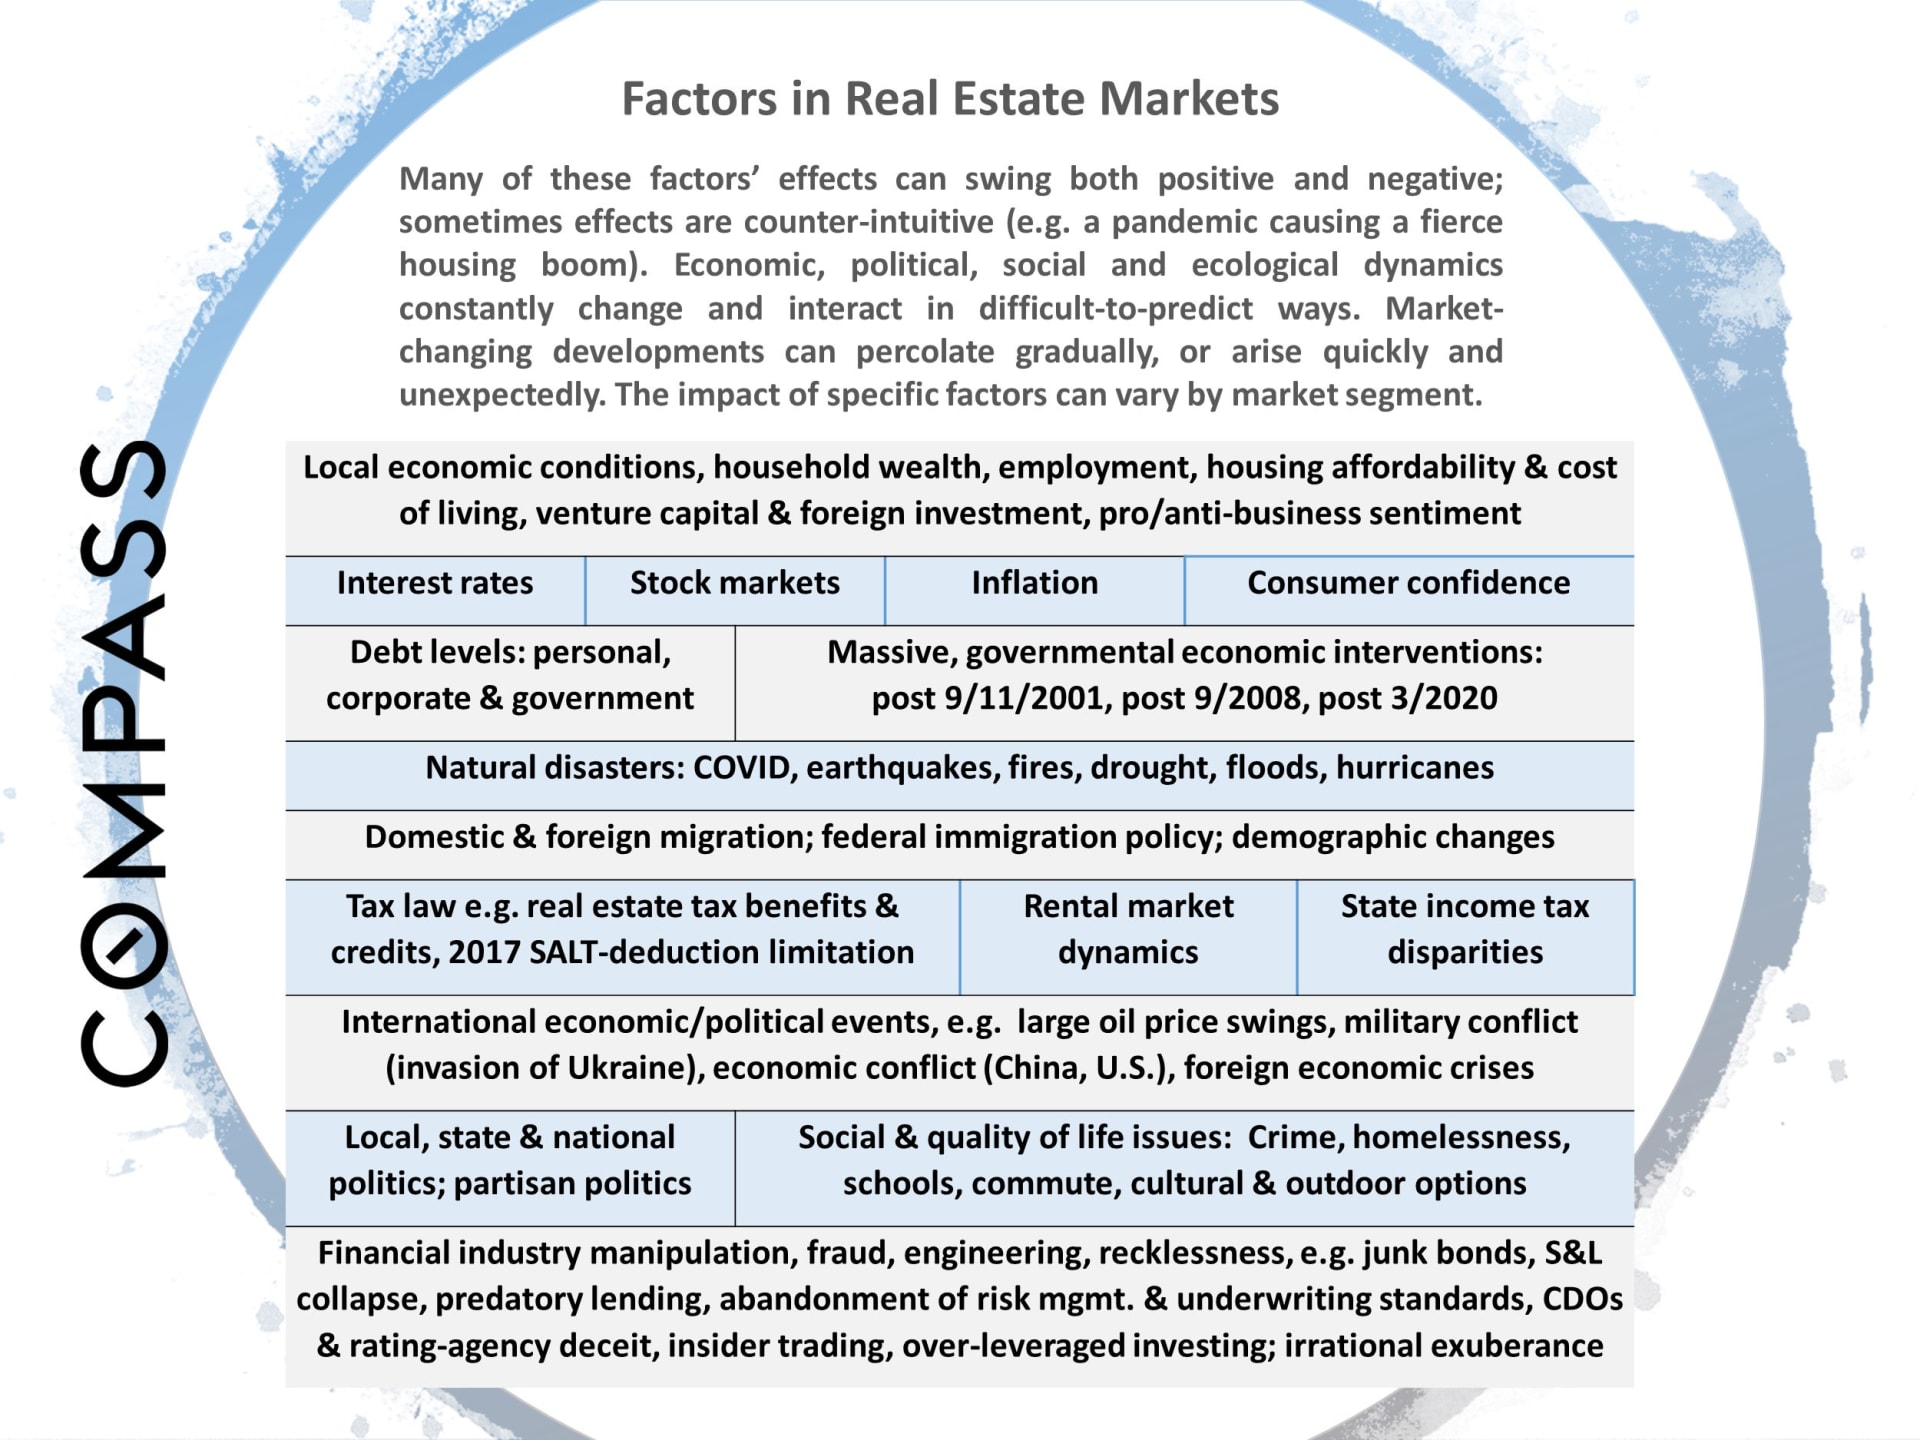
Infographic listing economic, political, social, and environmental factors that influence real estate markets.
A Review of Selected Economic Factors Impacting Real Estate Markets

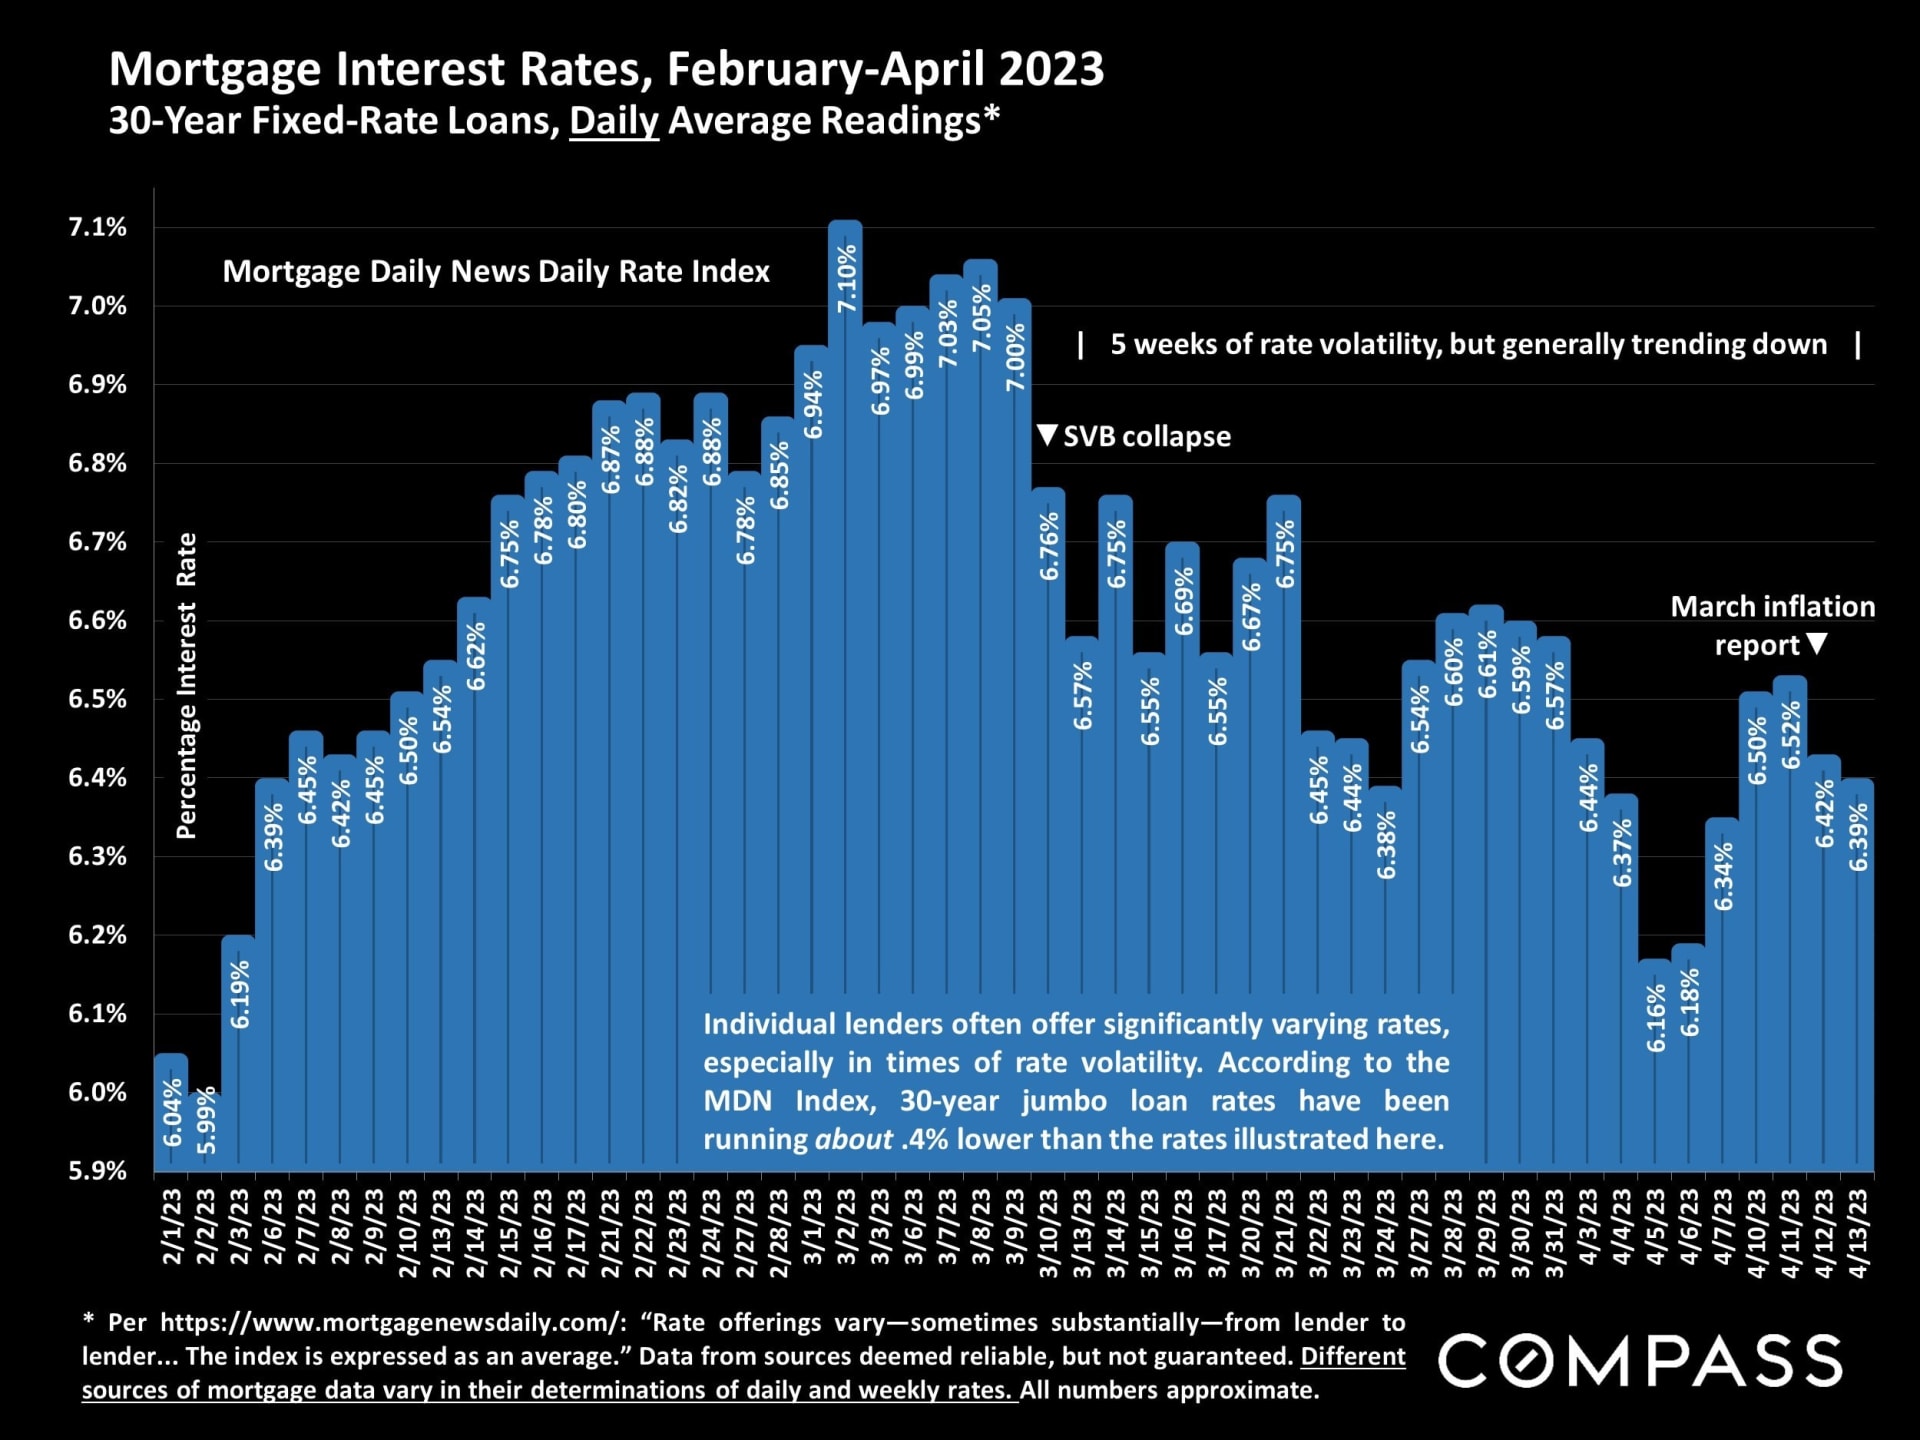
Chart of daily 30-year fixed mortgage rates from February to April 2023, peaking at 7.10% in early March.

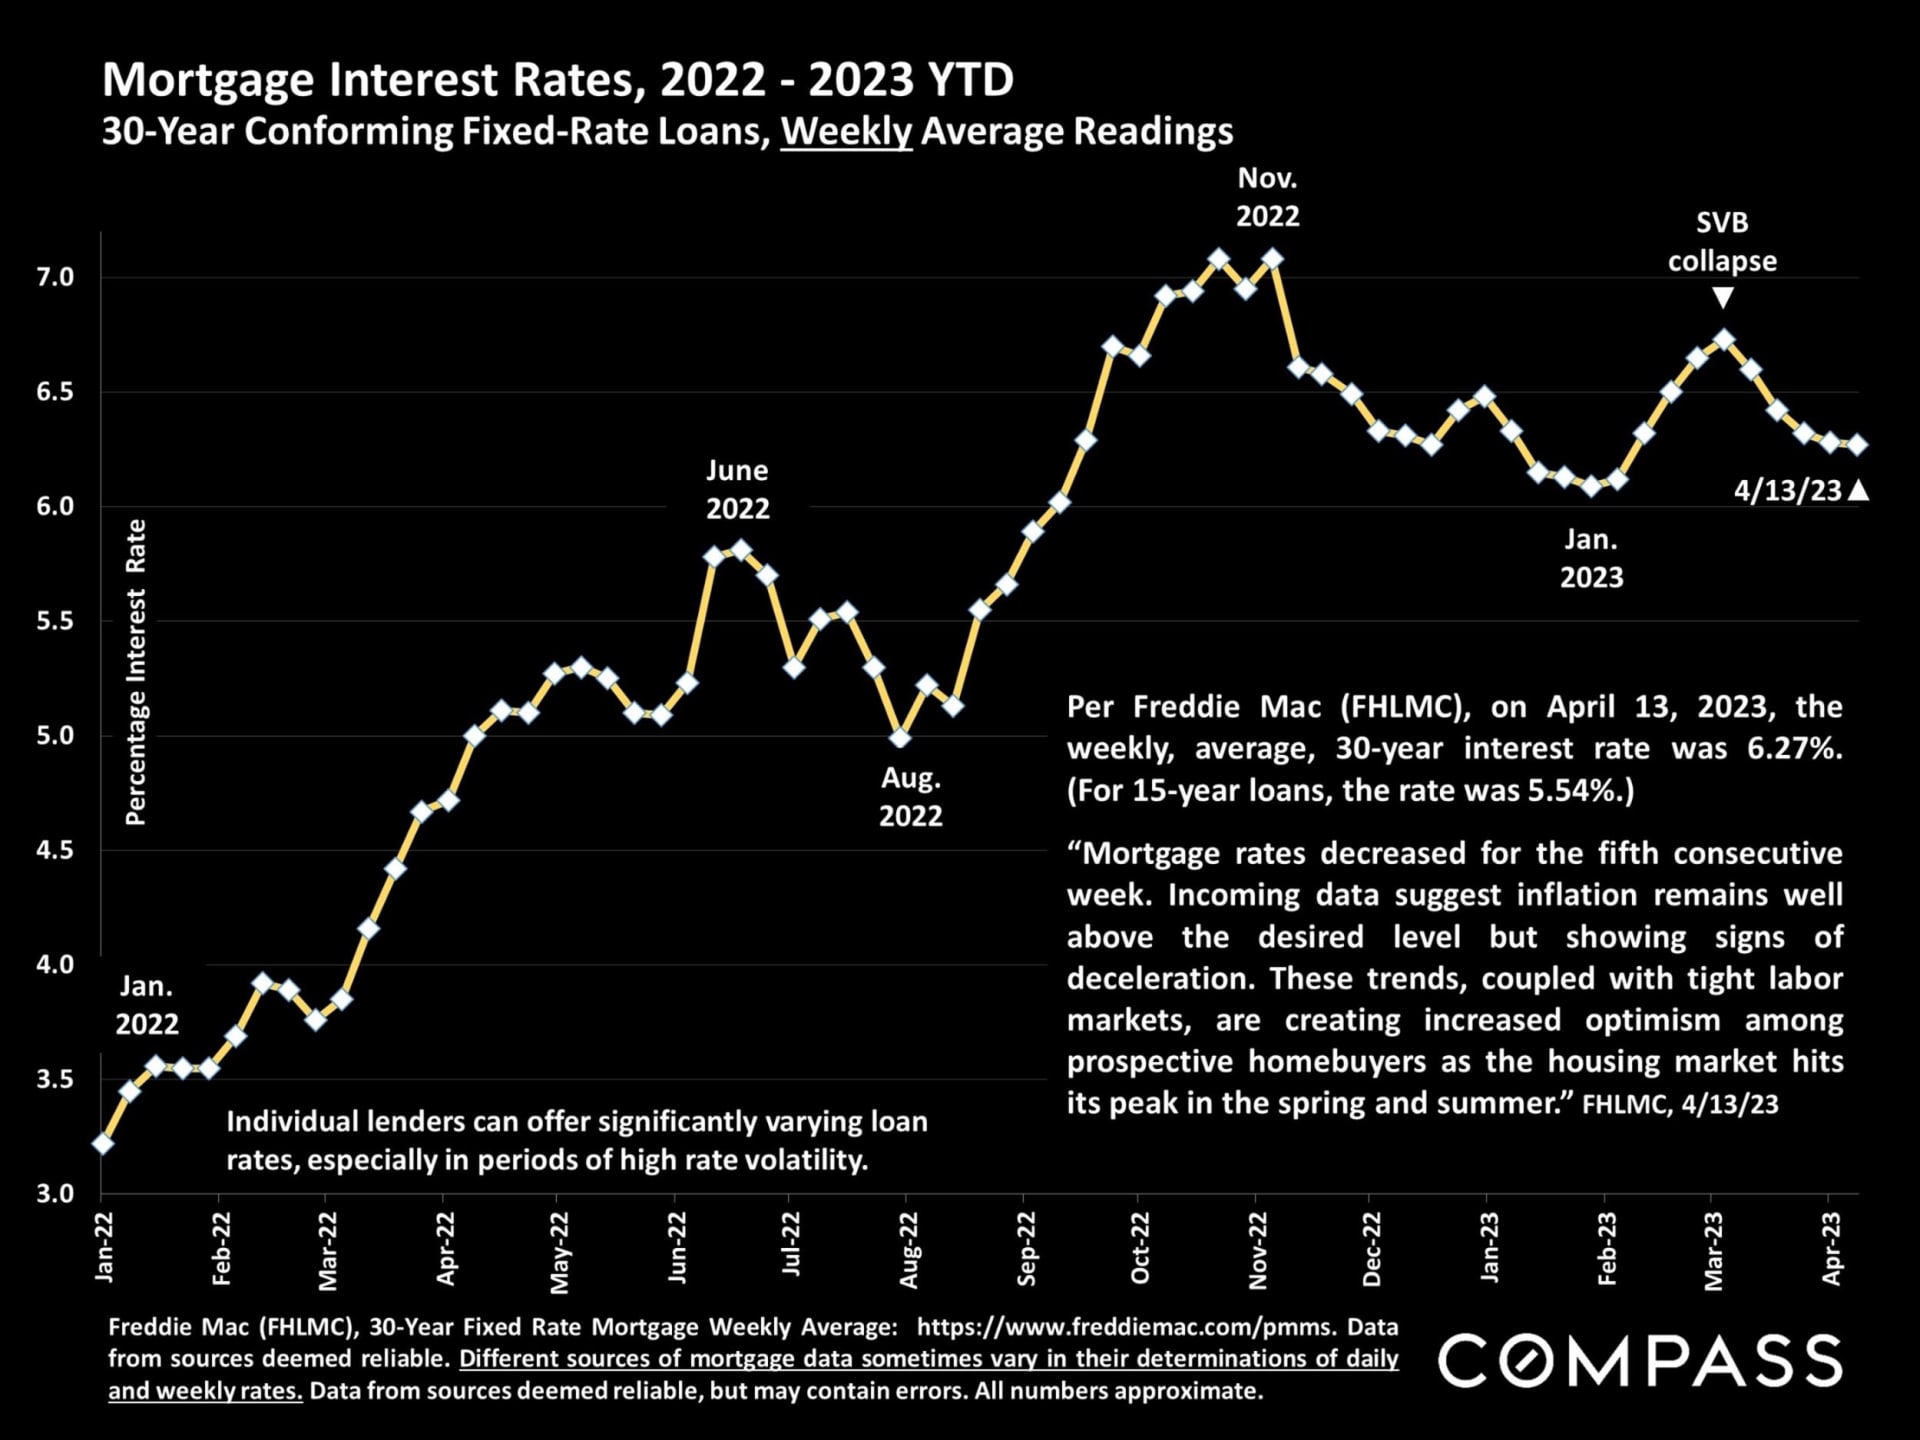
Chart of weekly 30-year mortgage rates from January 2022 to April 2023, peaking above 7% in November 2022.

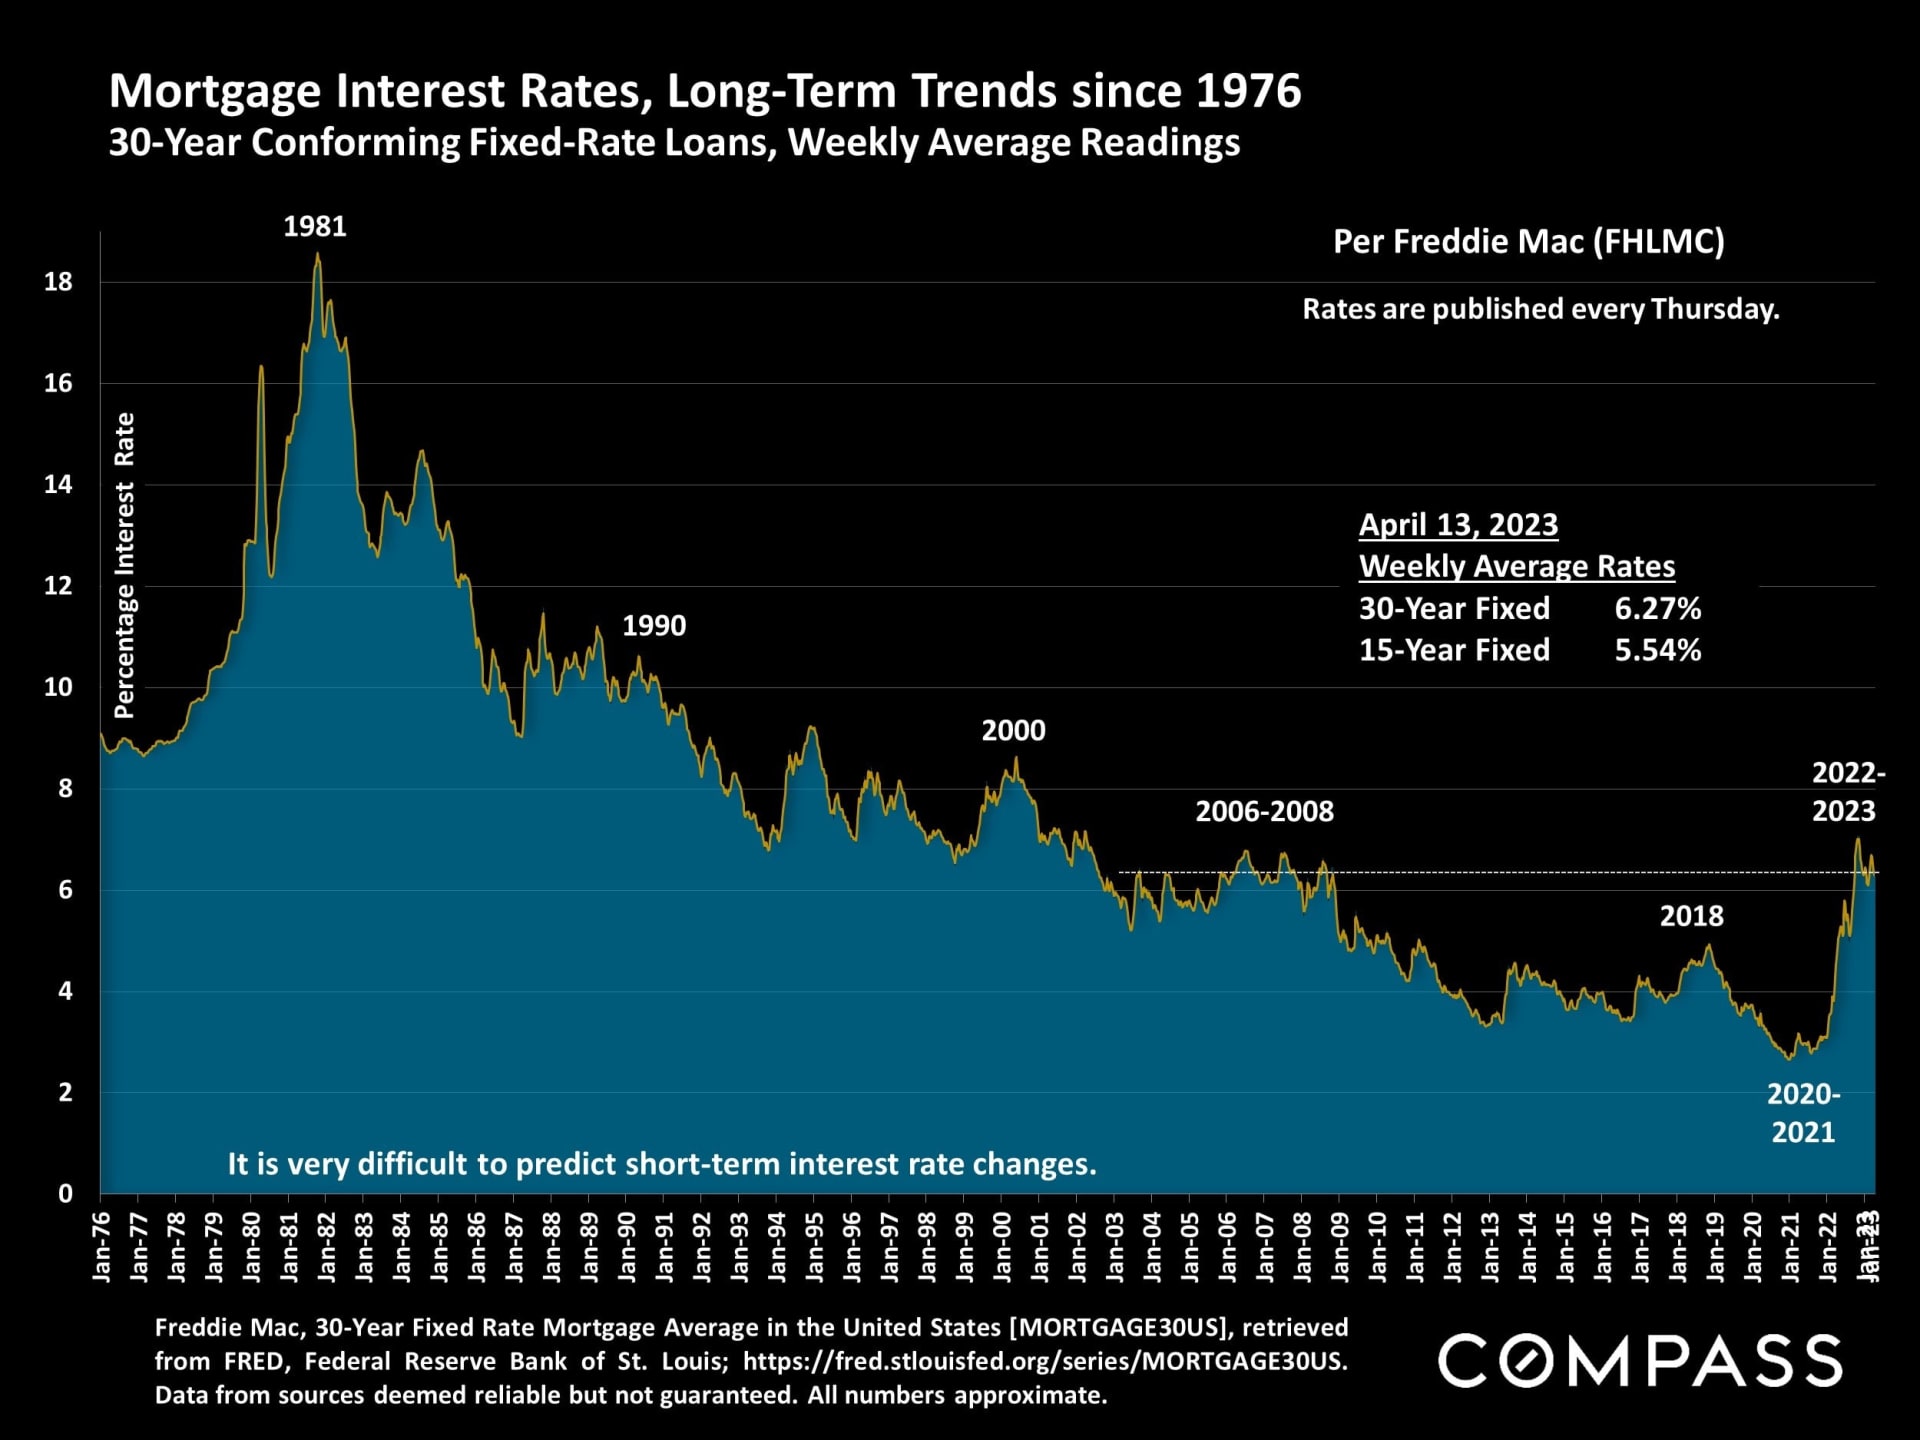
Chart of U.S. mortgage rates since 1976, showing the 1981 peak and a sharp rise in 2022–2023.

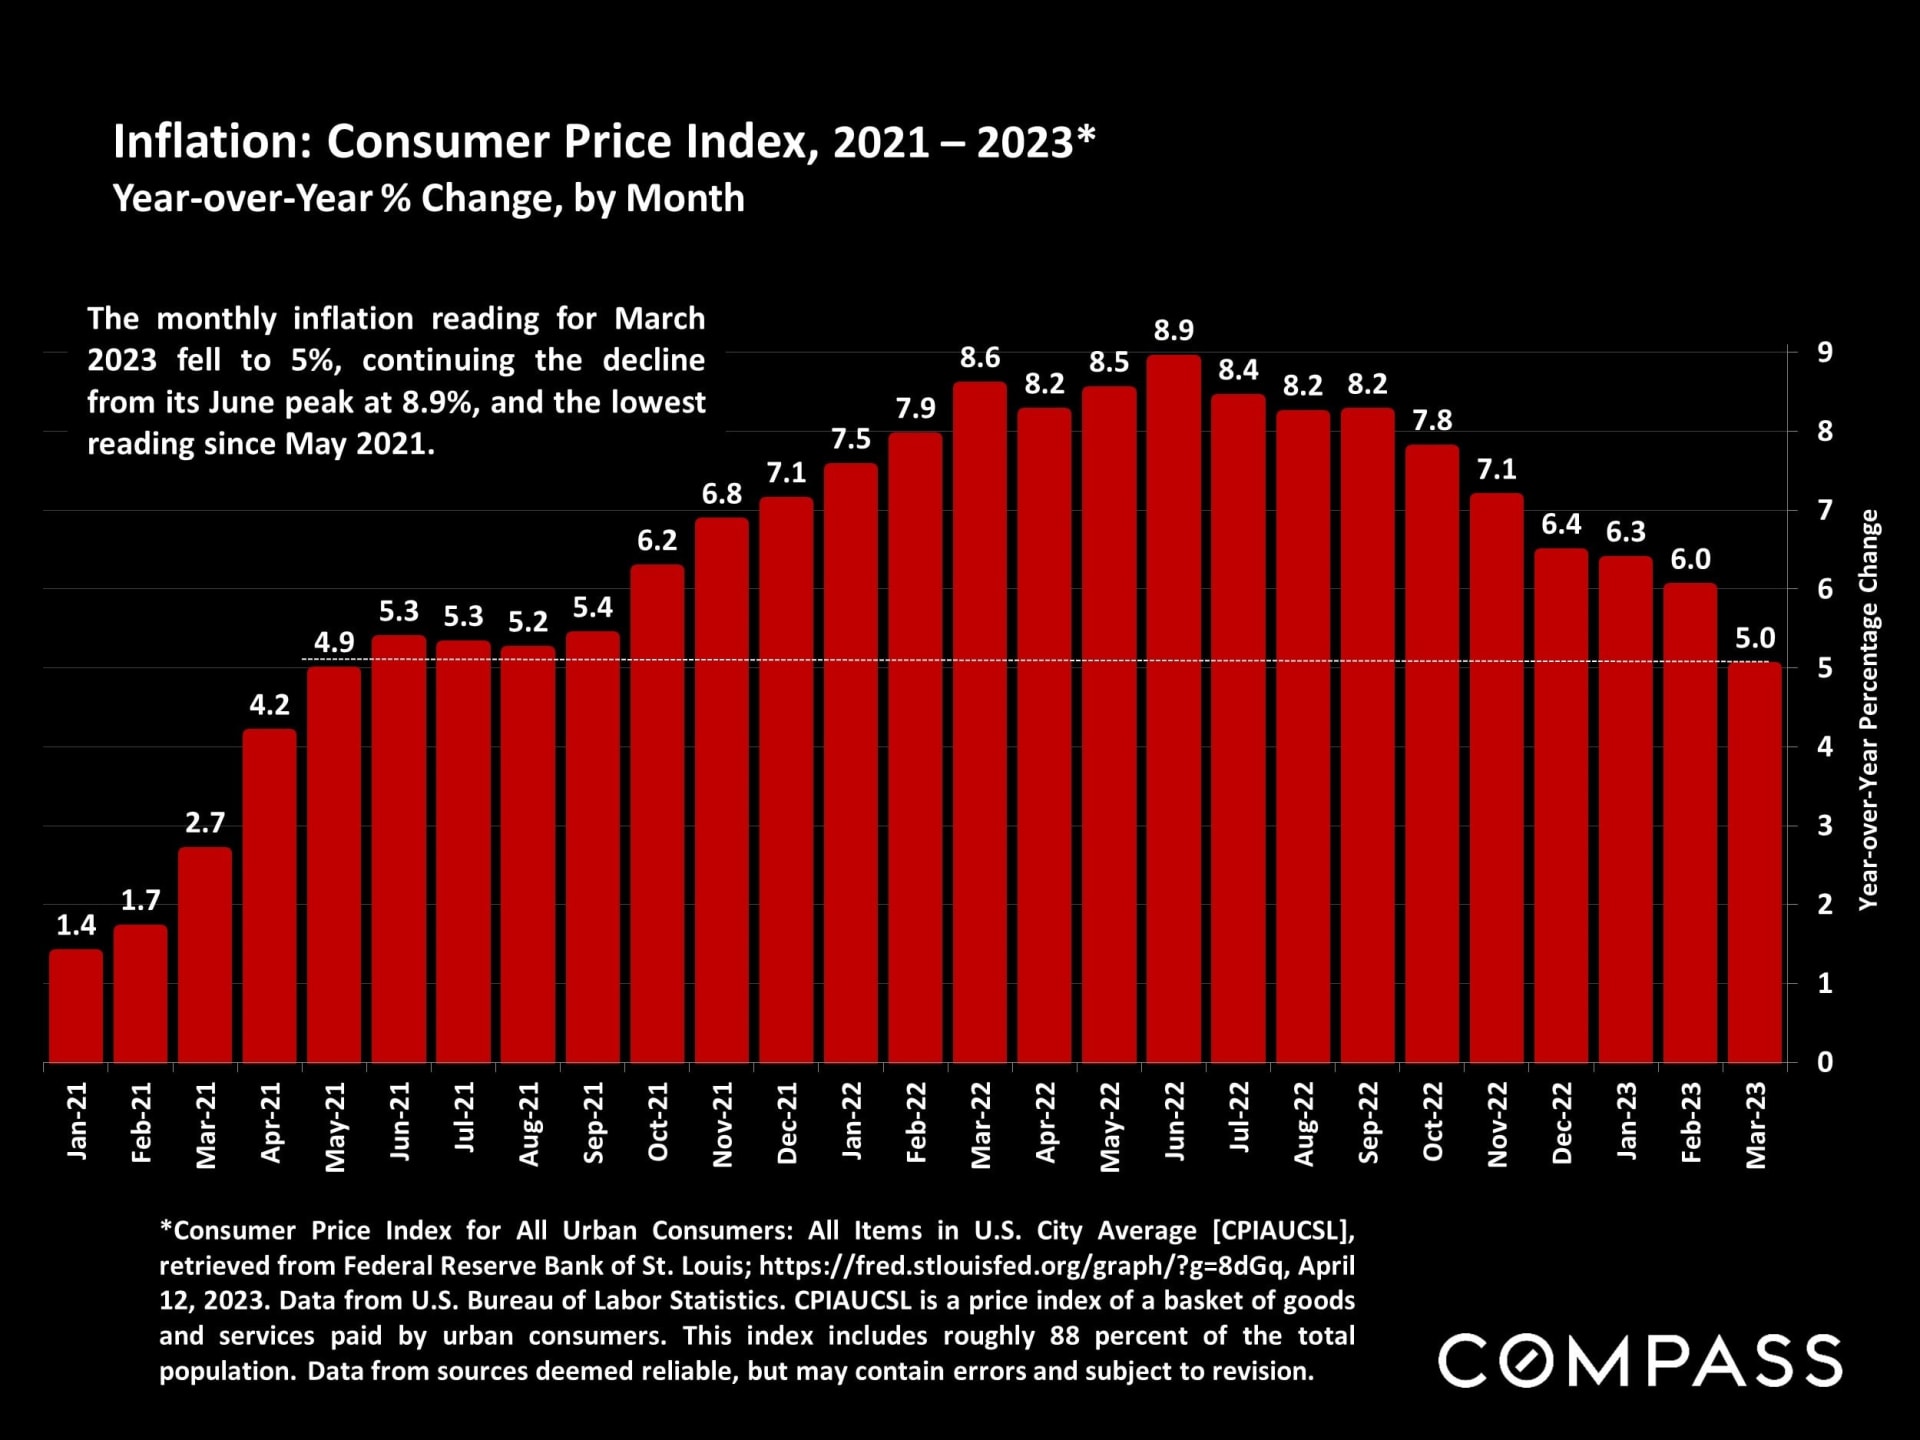
Bar chart of U.S. inflation, peaking at 8.9% in June 2022 before falling to 5.0% in March 2023.

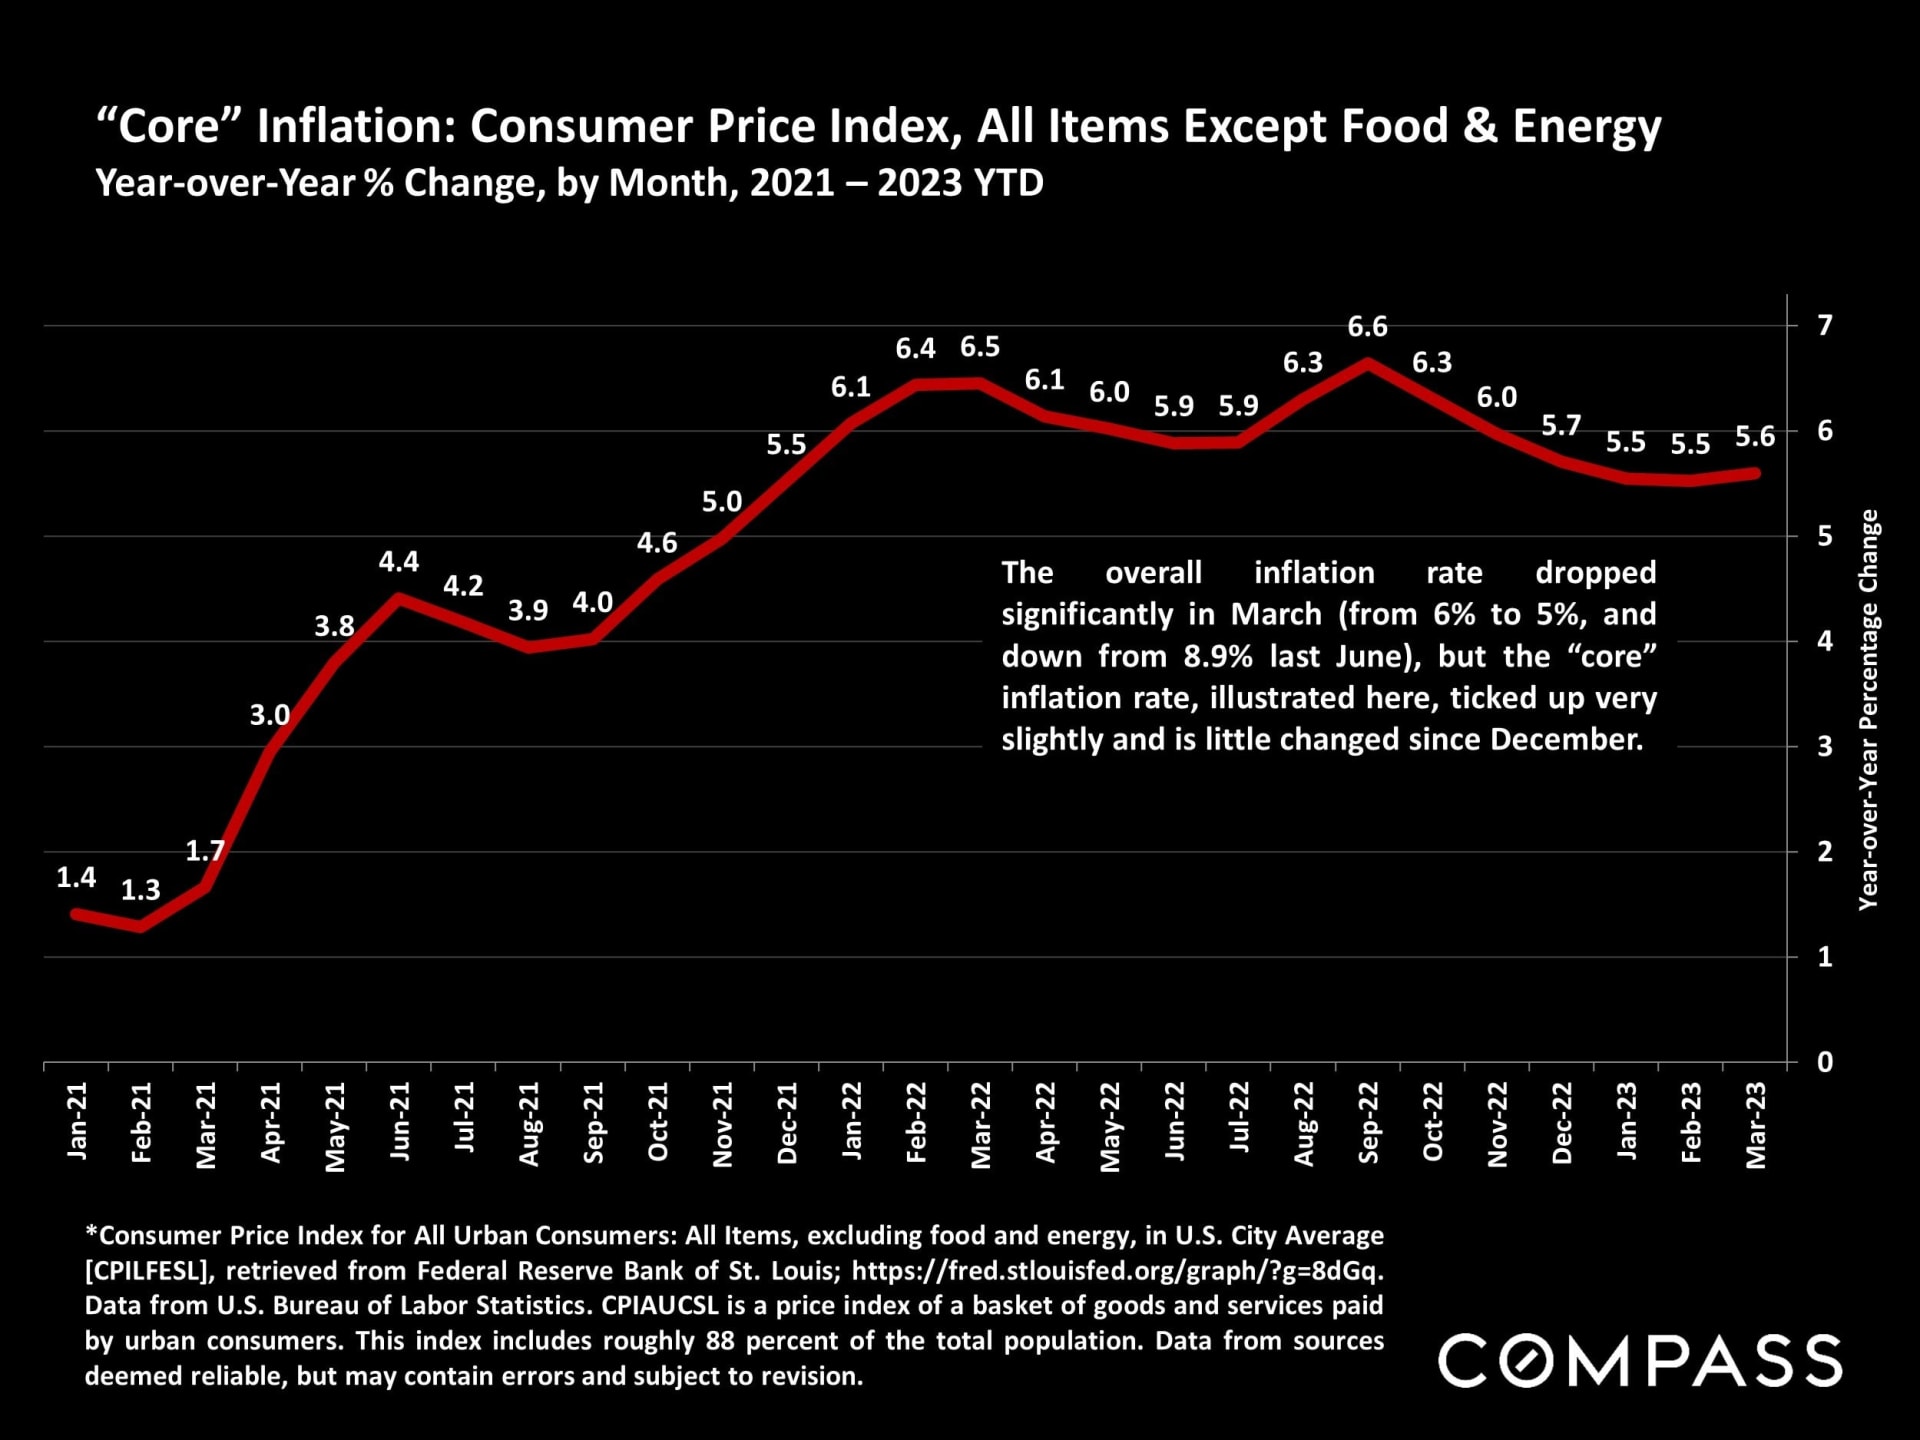
Chart of core inflation rising to 6.6% in September 2022, then easing to 5.6% by March 2023.

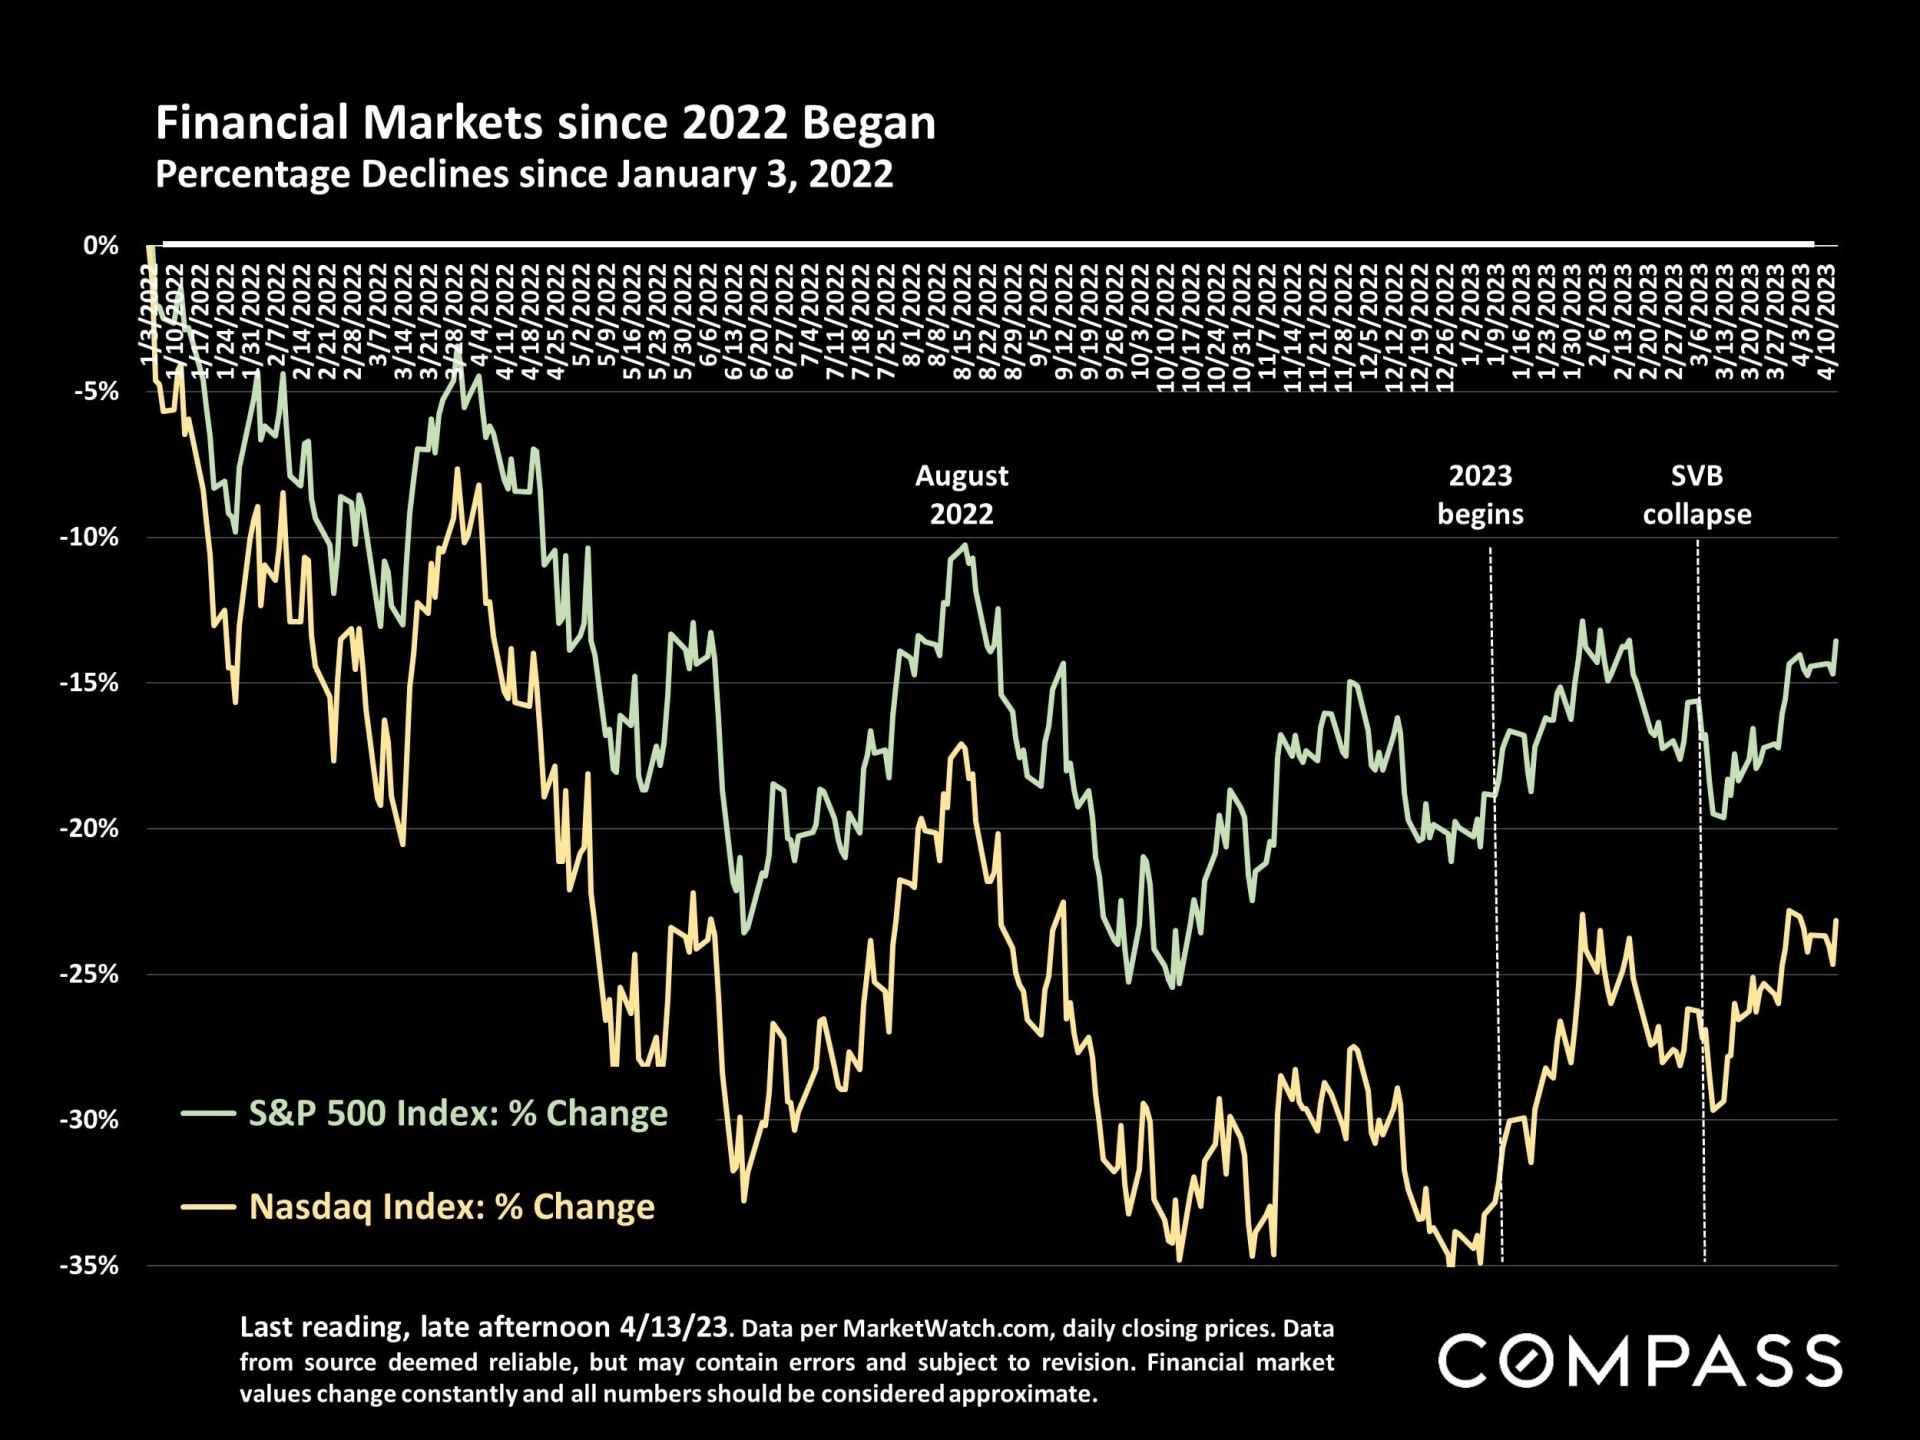
Chart comparing S&P 500 and Nasdaq declines from January 2022 to April 2023.

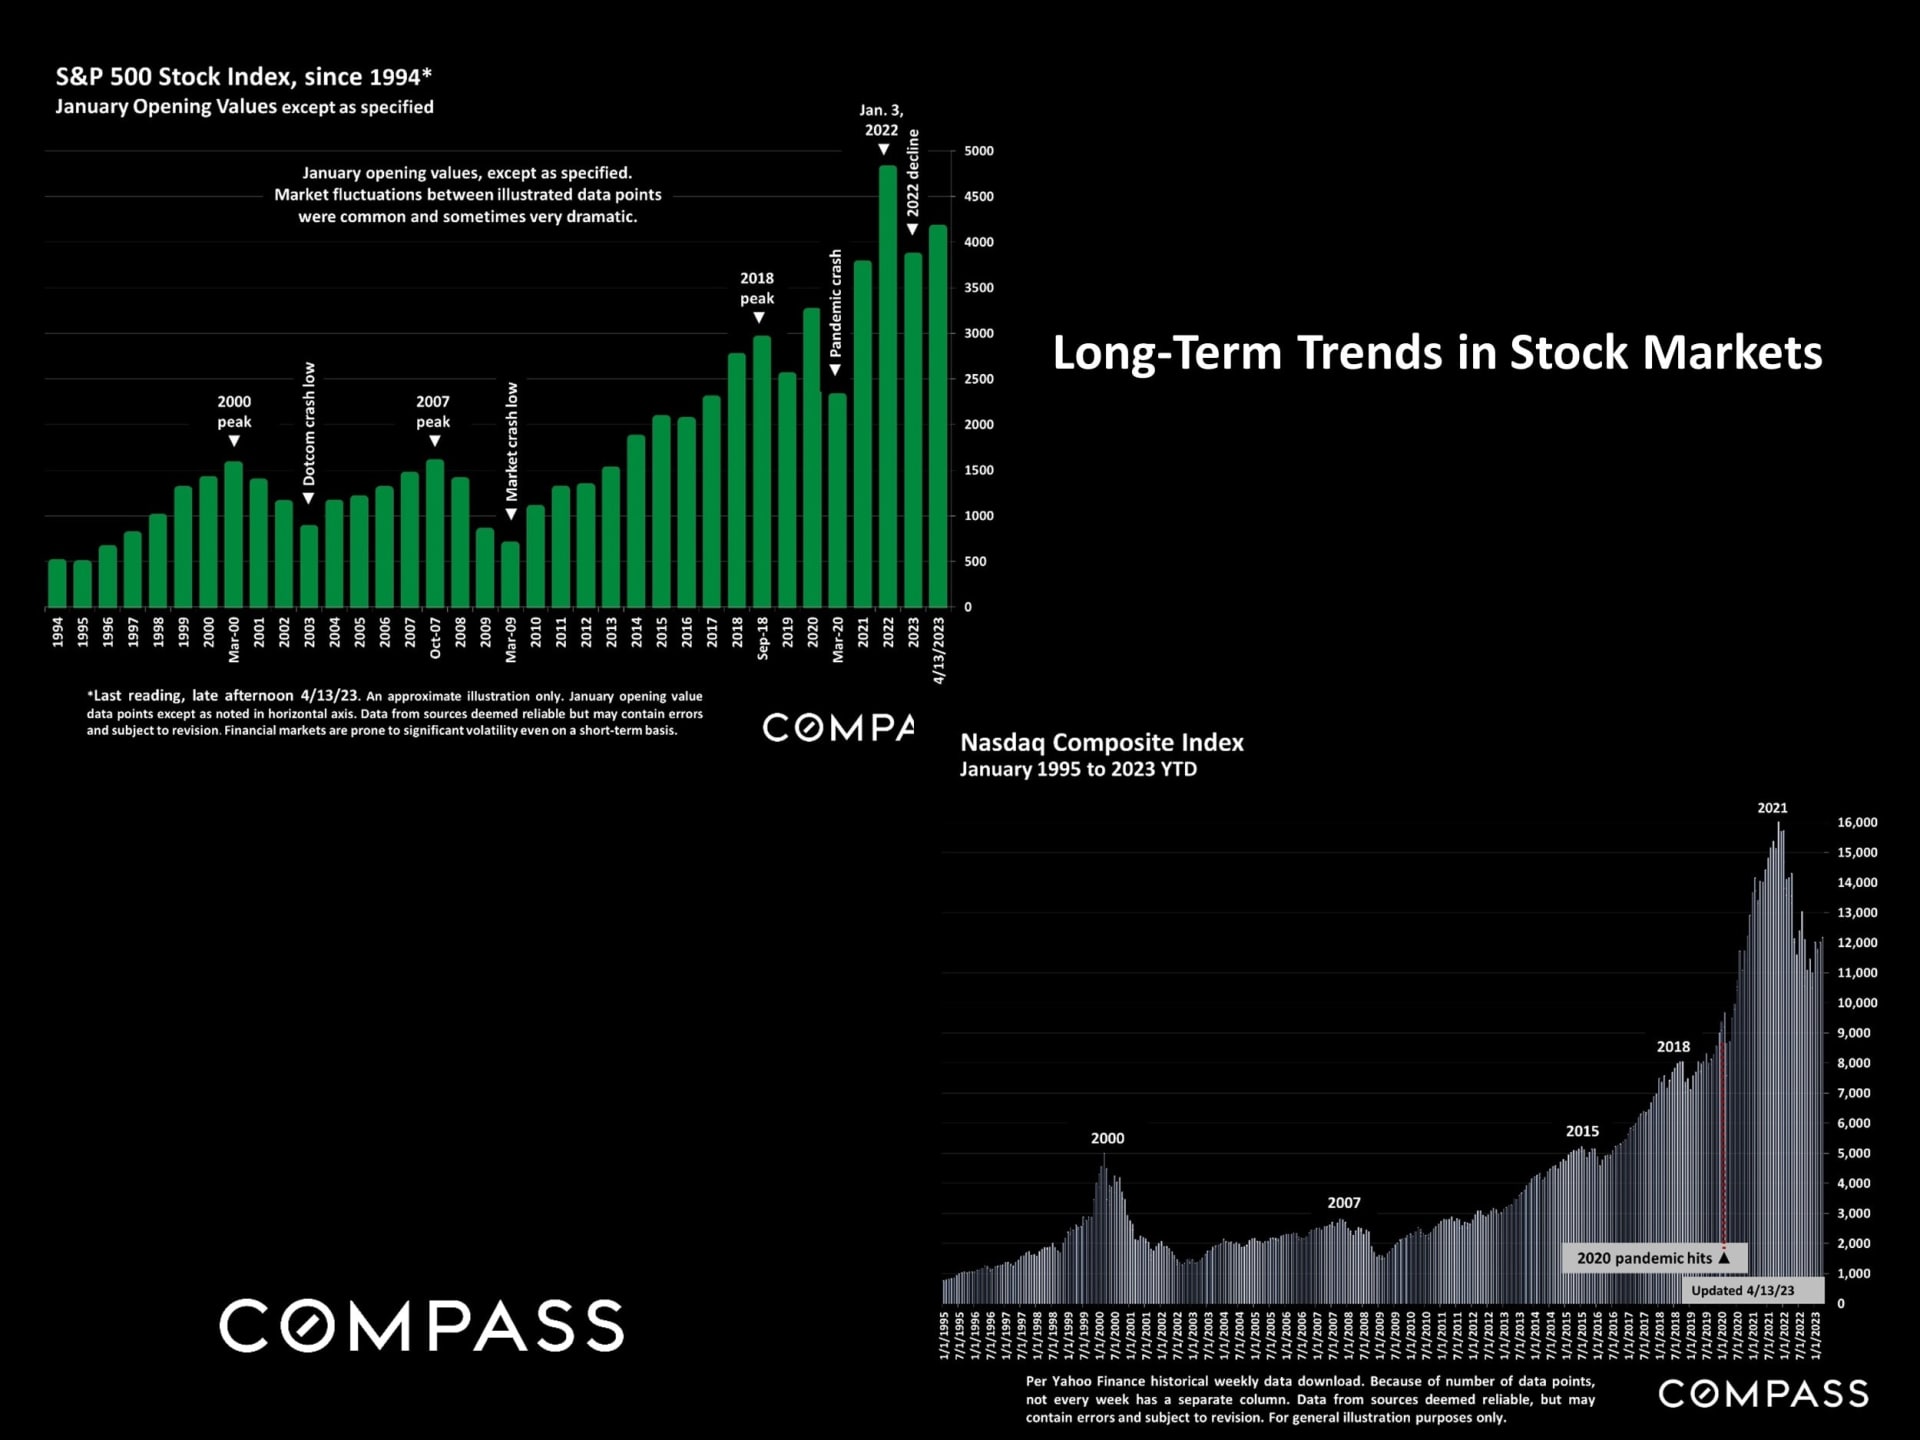
Stock market infographic comparing S&P 500 and Nasdaq trends, with historical peaks and downturns marked.

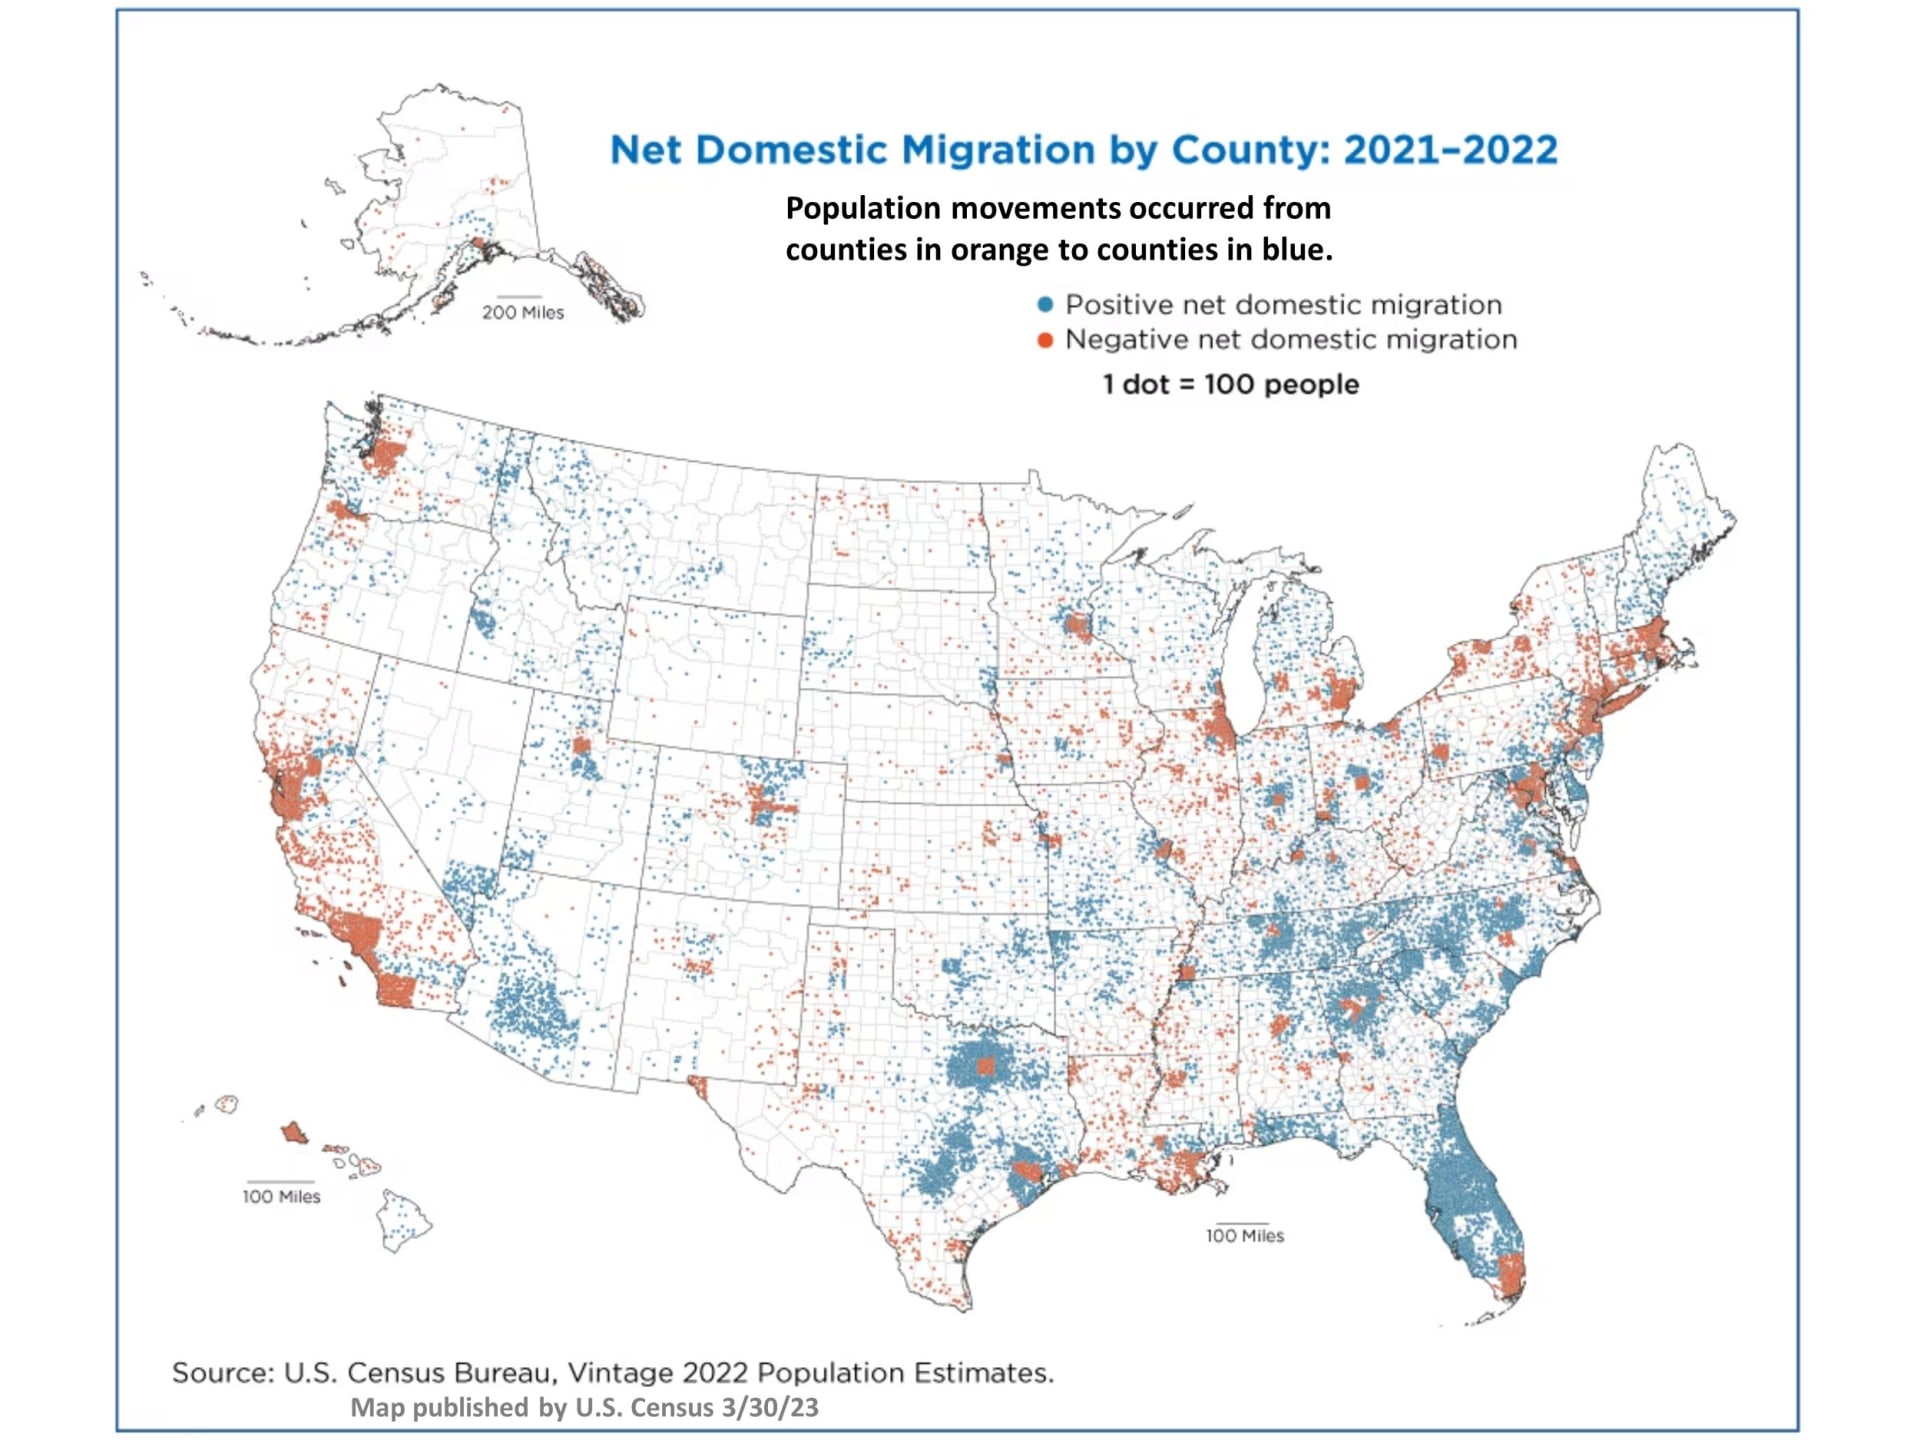
Map of 2021–2022 net domestic migration by county, with positive migration in blue and negative migration in orange.

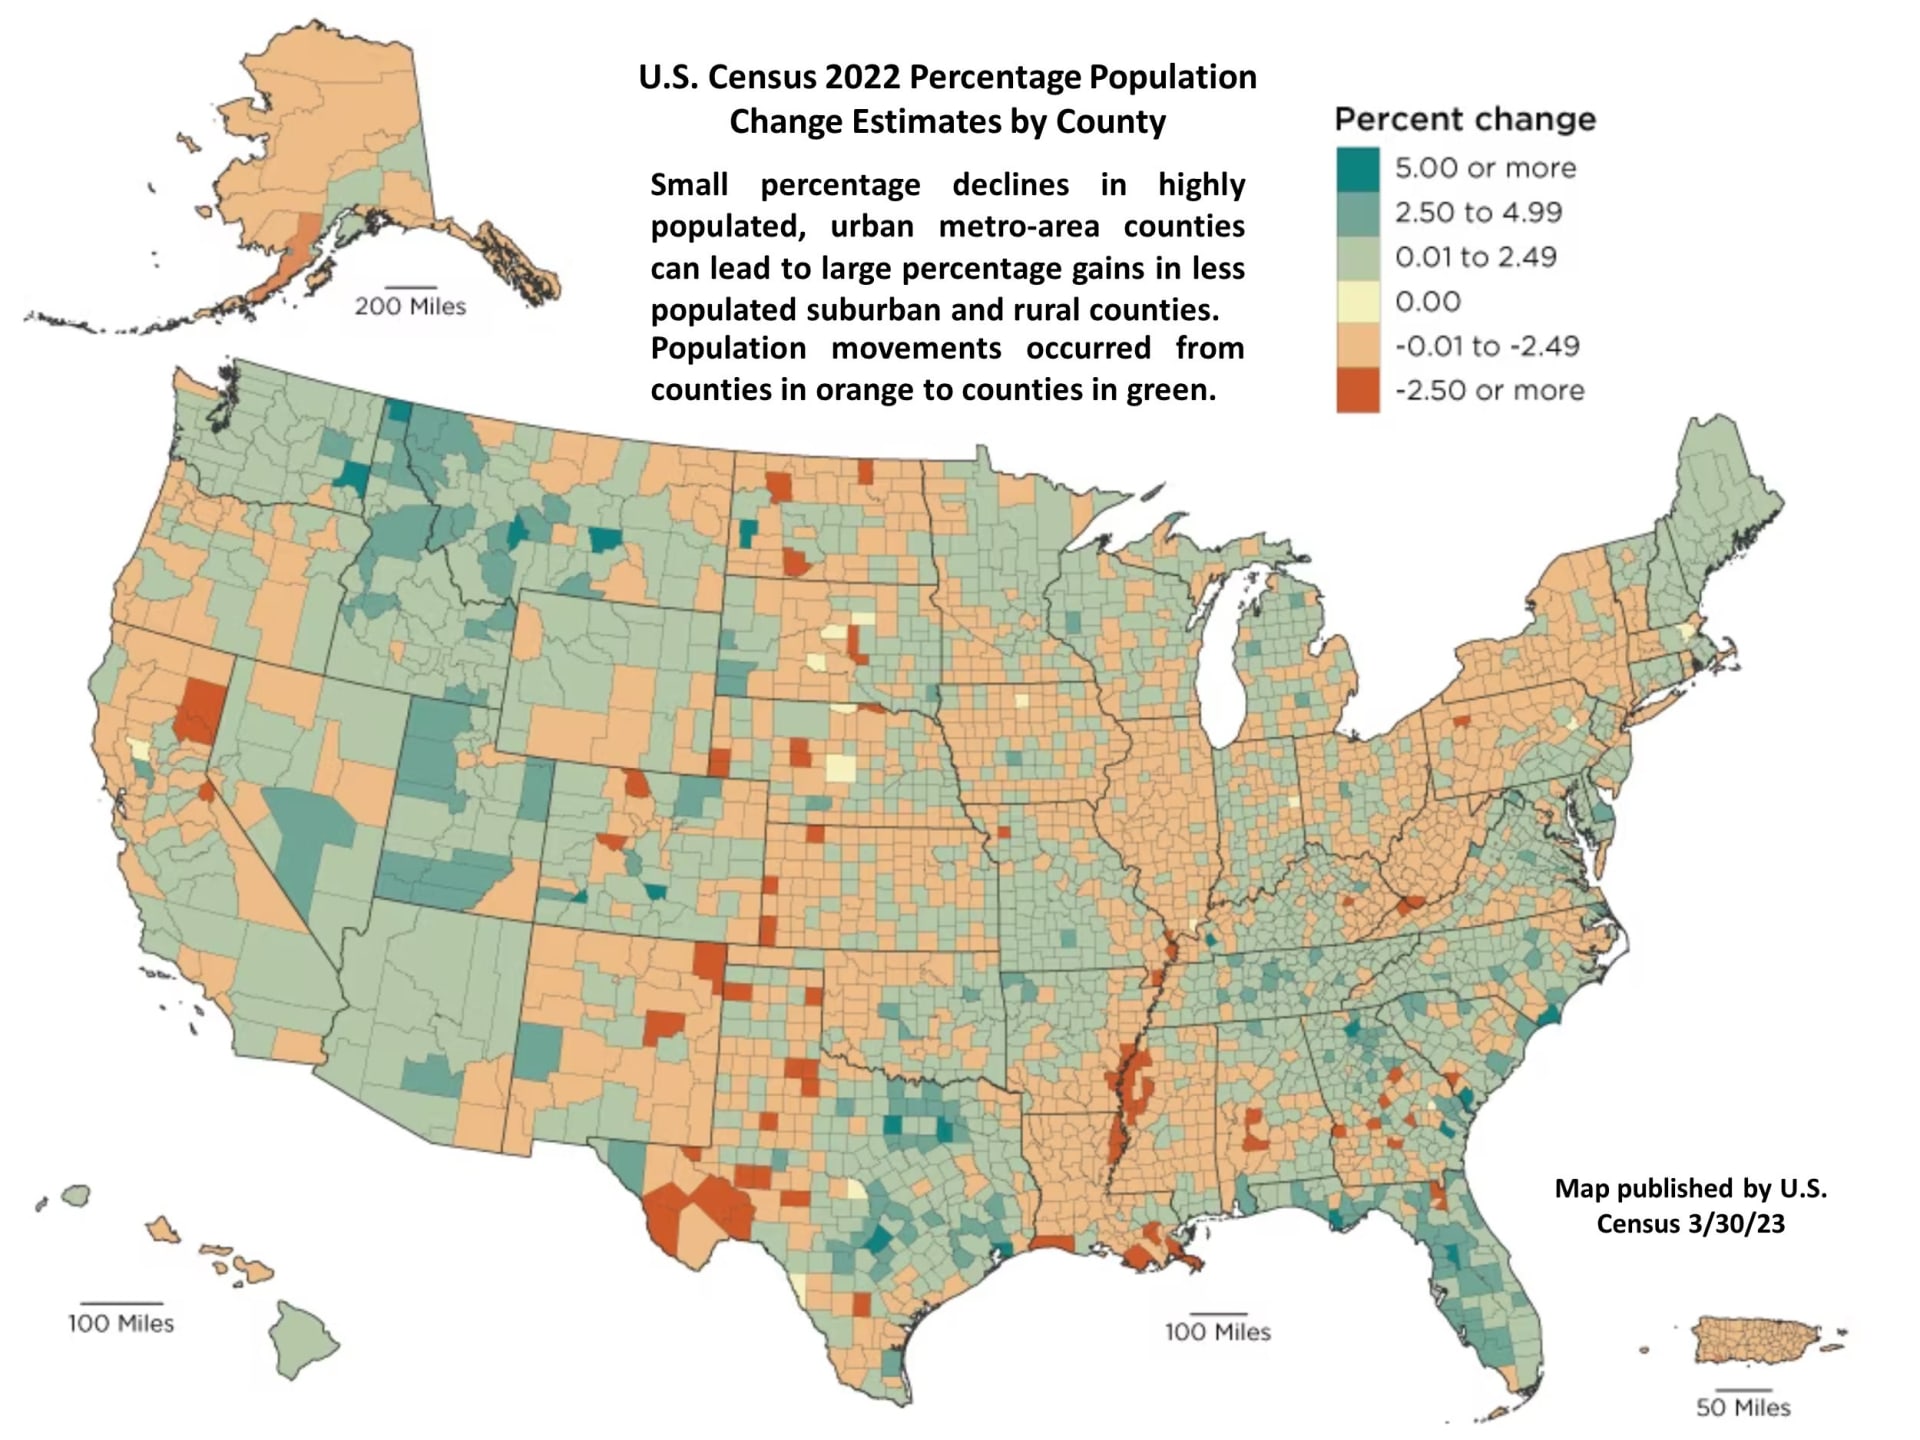
U.S. map of 2022 county population change estimates, shaded to show percentage increases and declines.

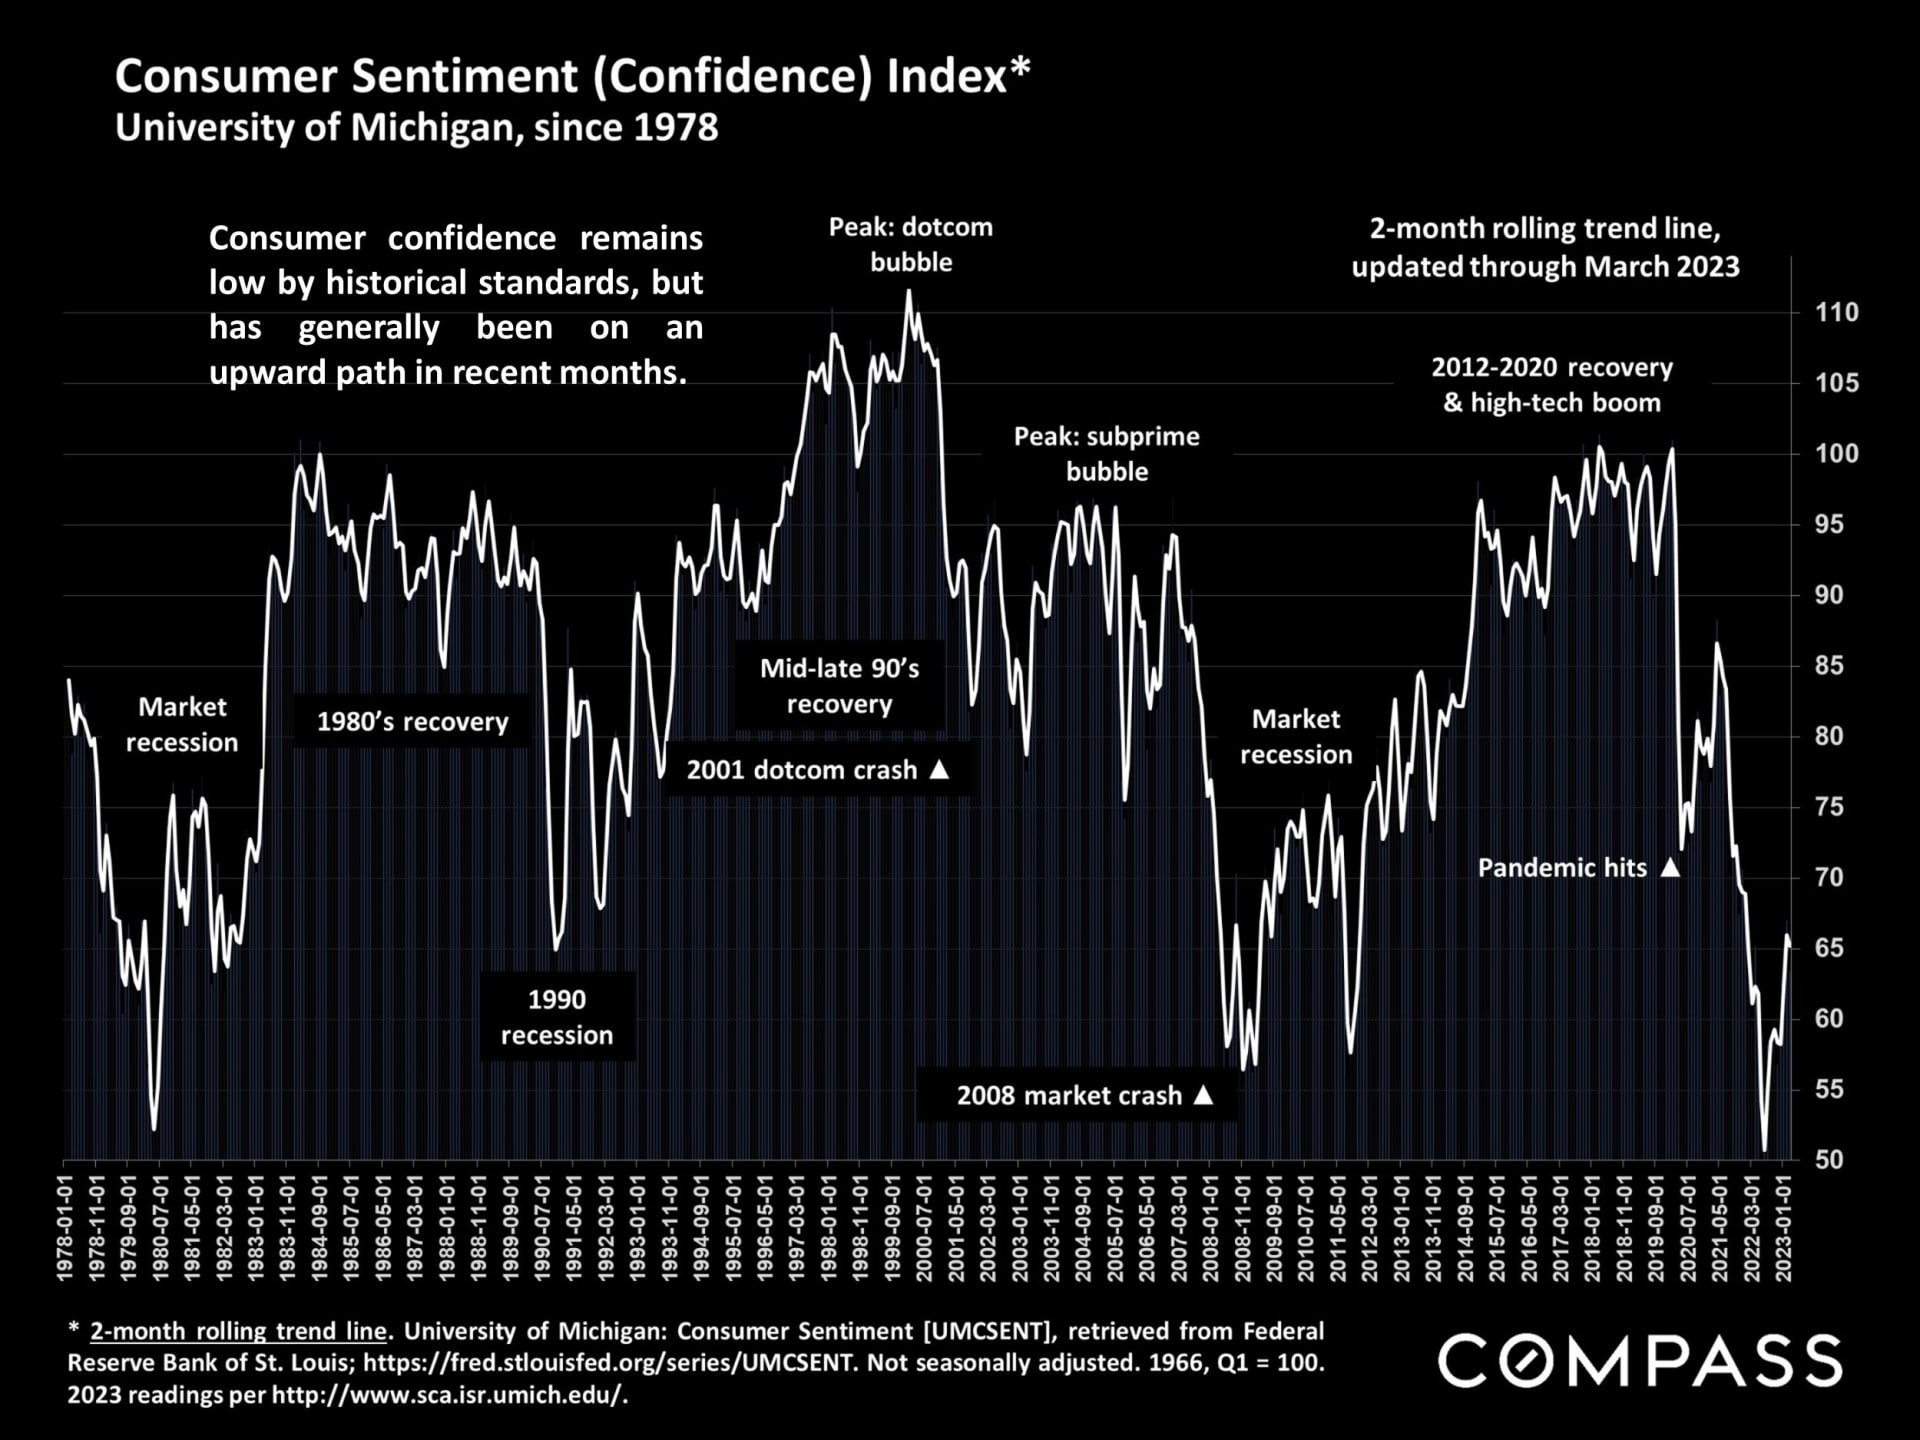
Chart of the University of Michigan Consumer Sentiment Index, 1978–2023, annotated with recessions and market events.

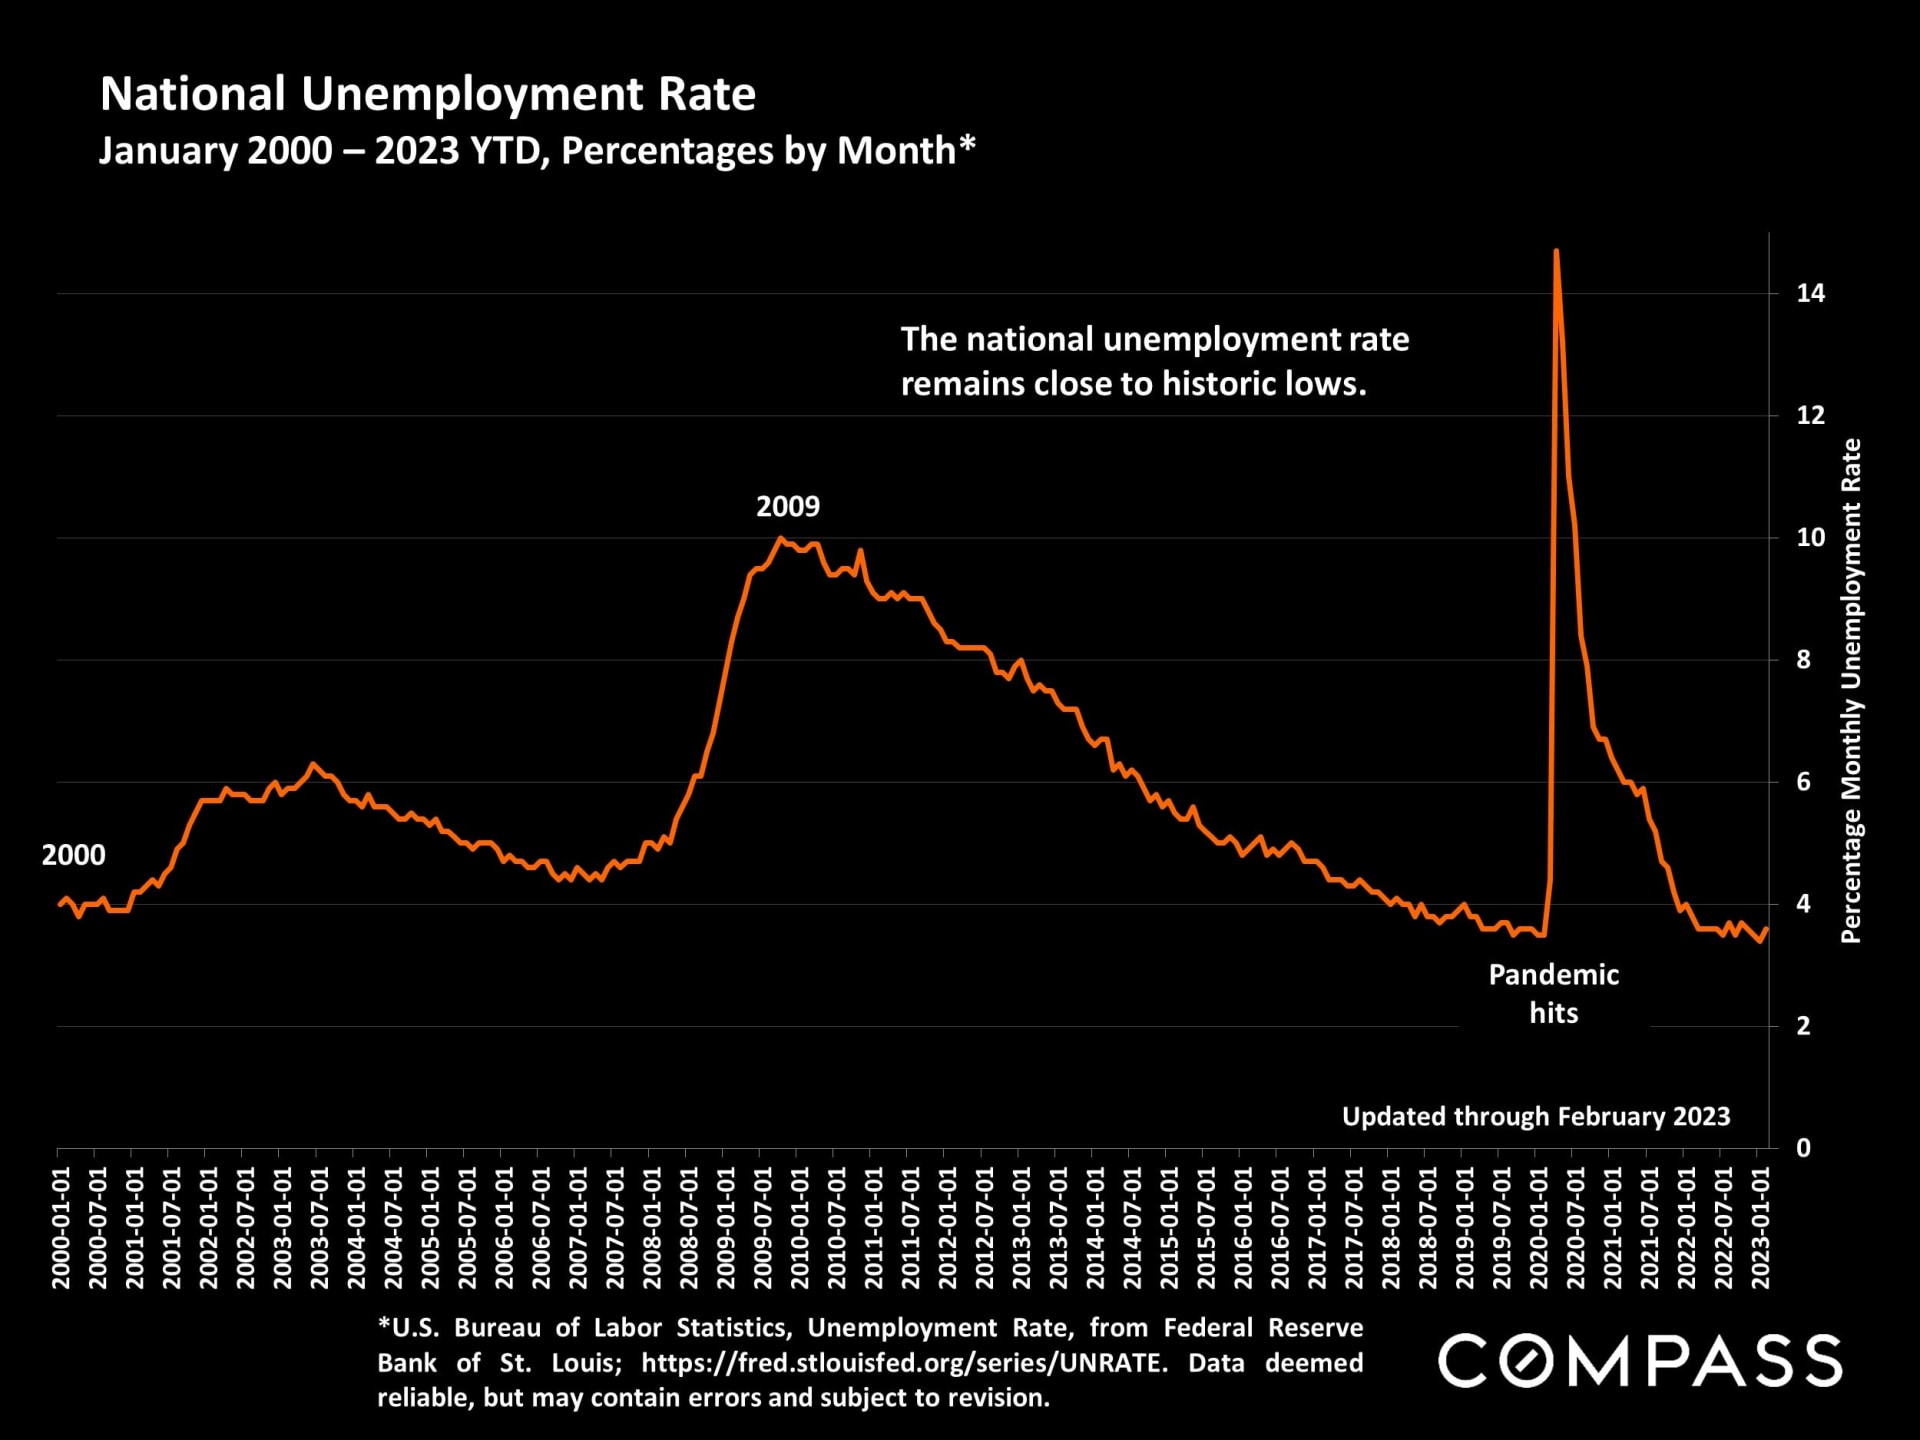
Chart of U.S. unemployment rates, 2000–2023, with a sharp pandemic-era spike and a decline to historic lows.

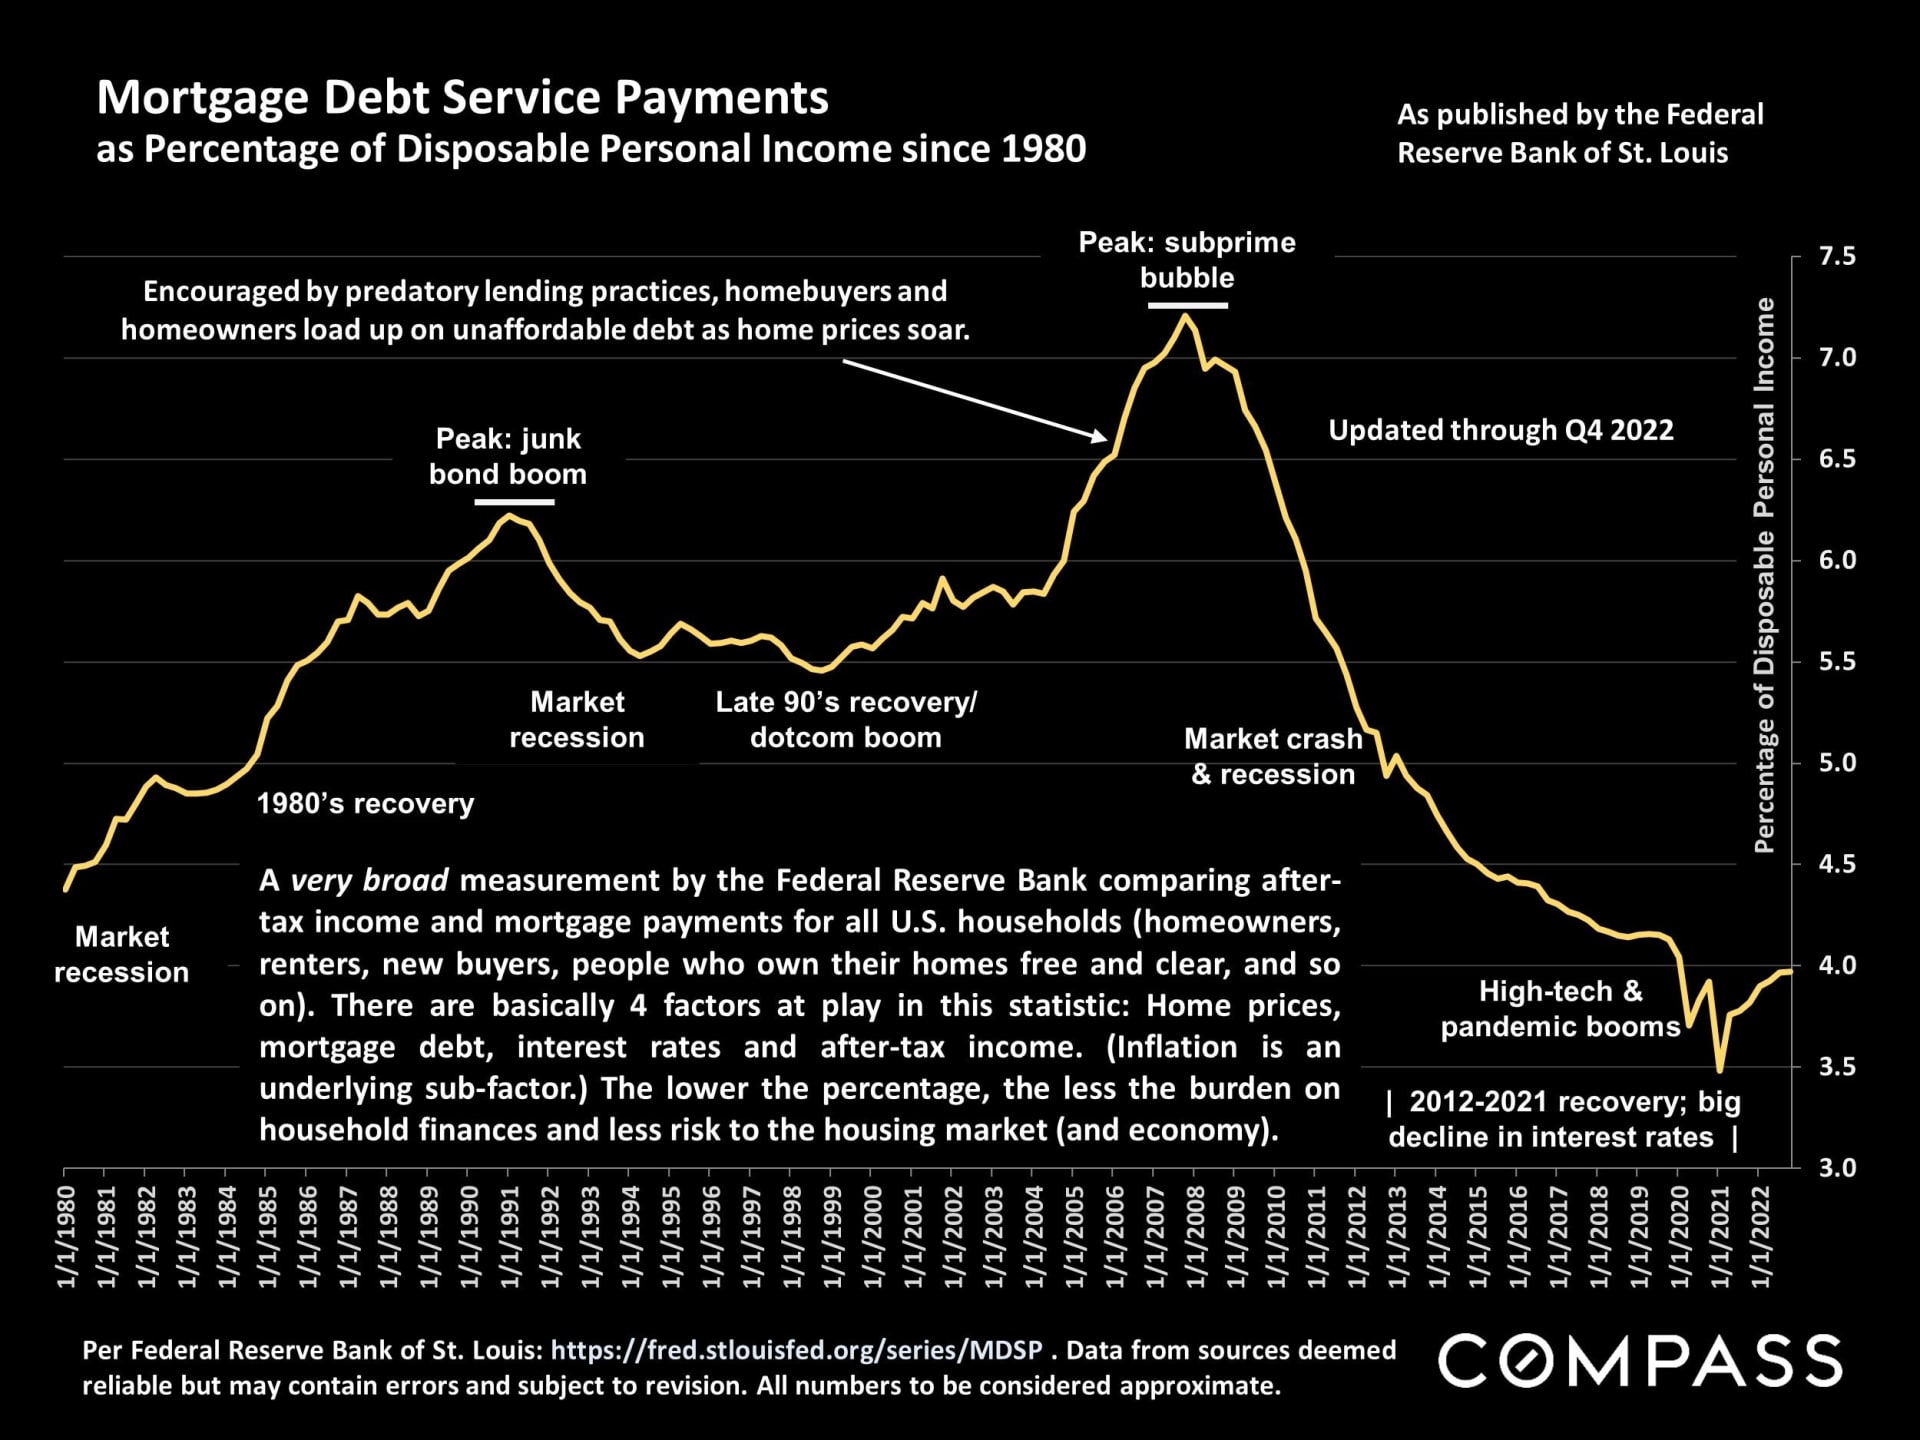
Chart of U.S. mortgage debt service as a share of disposable income, 1980–2022, with a yellow line and annotated peaks.

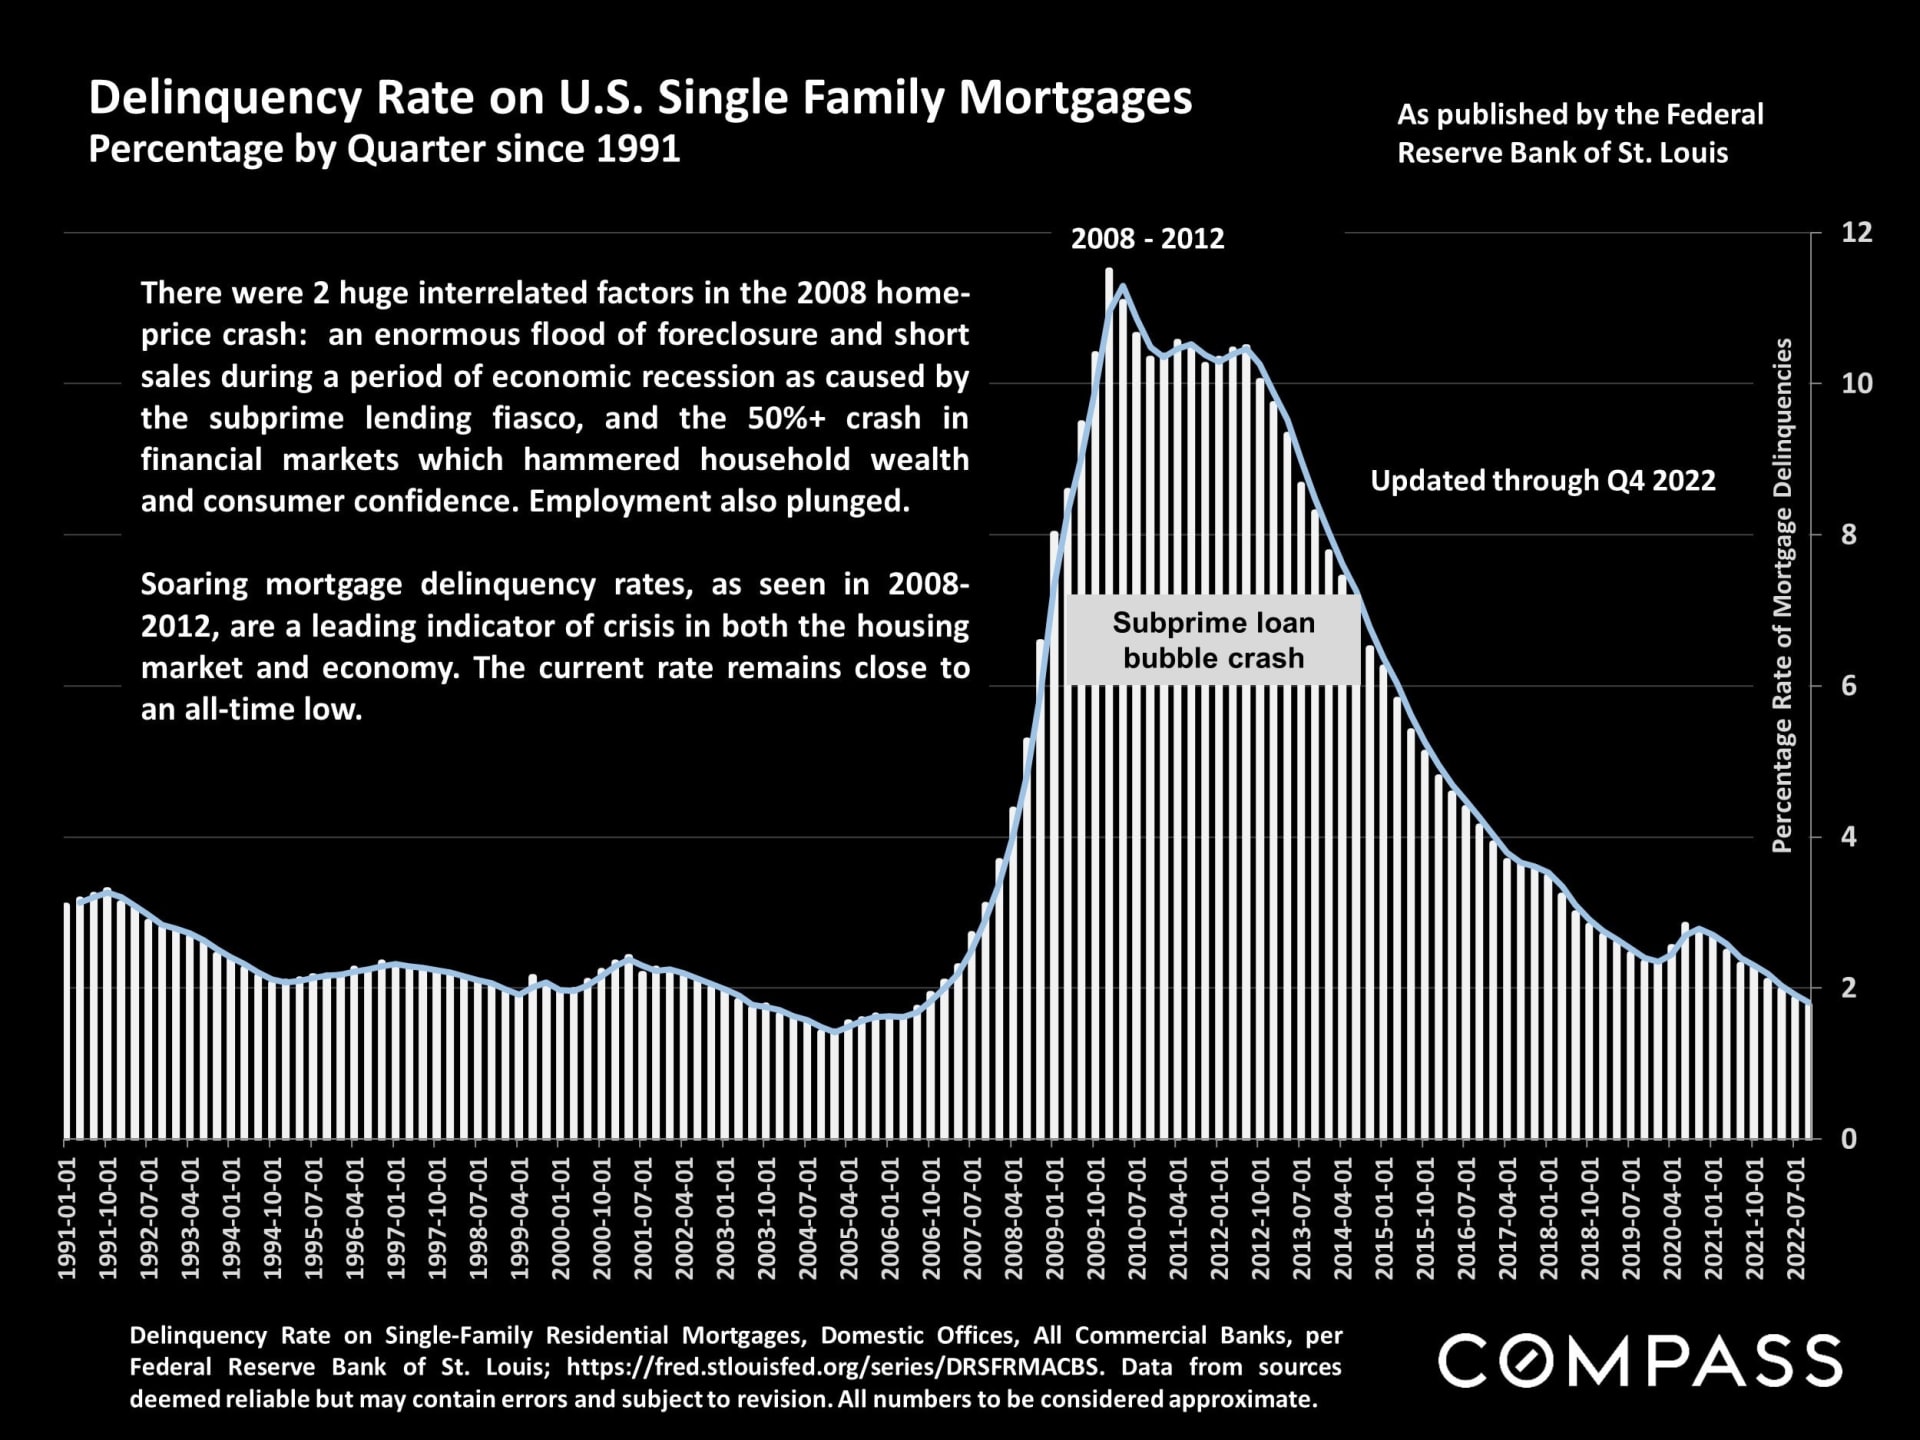
Chart of U.S. single-family mortgage delinquencies, showing the 2008–2012 peak and decline through Q4 2022.

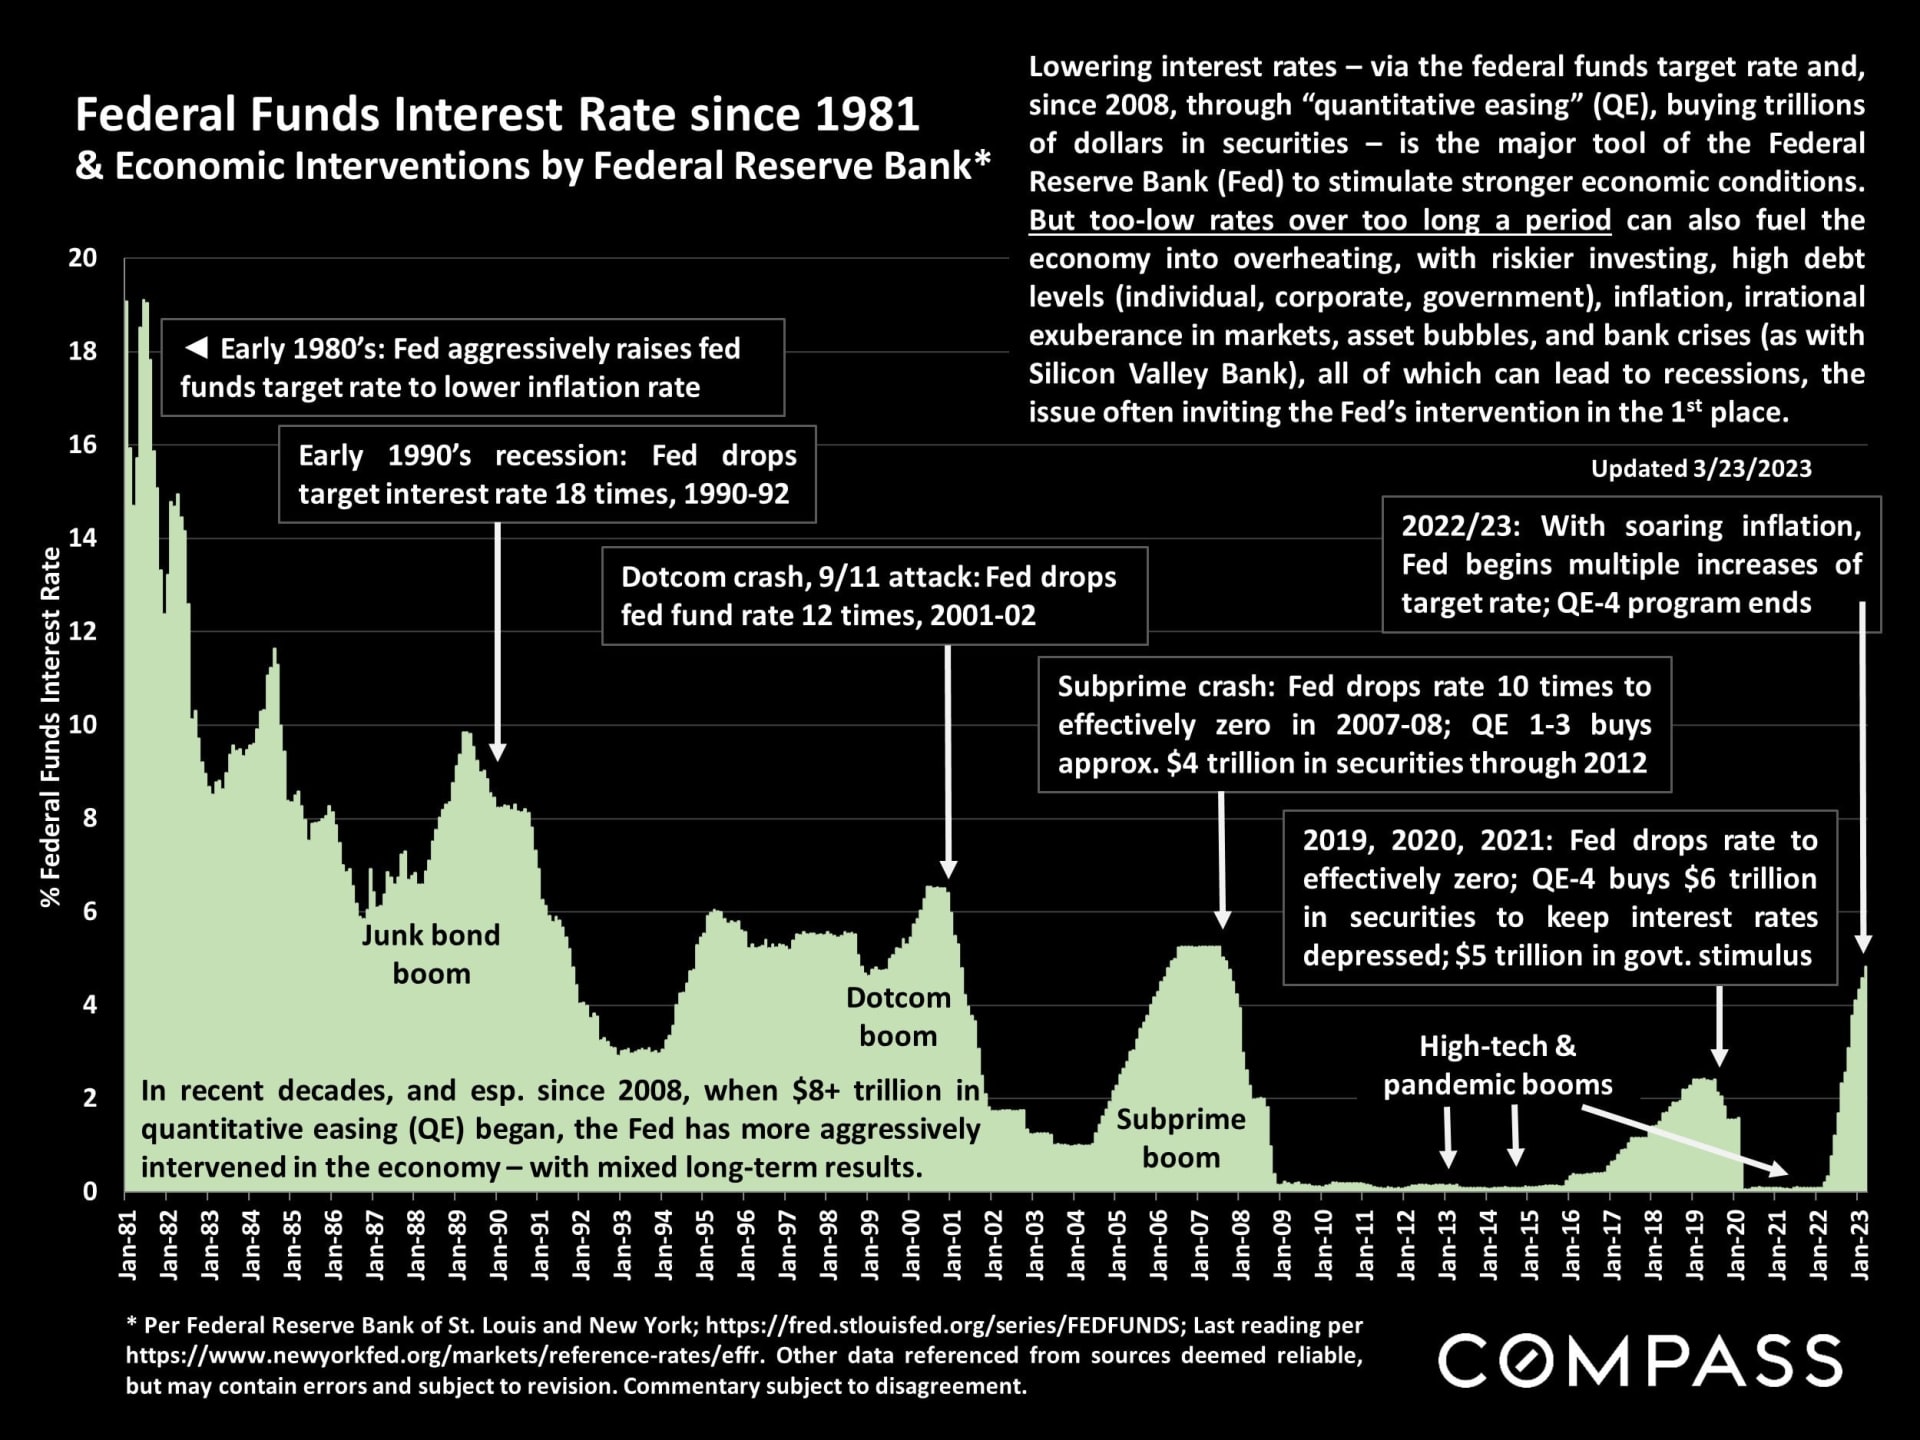
Infographic charting U.S. federal funds interest rates from 1981 to 2023, with annotations on recessions and Federal Reserve interventions.

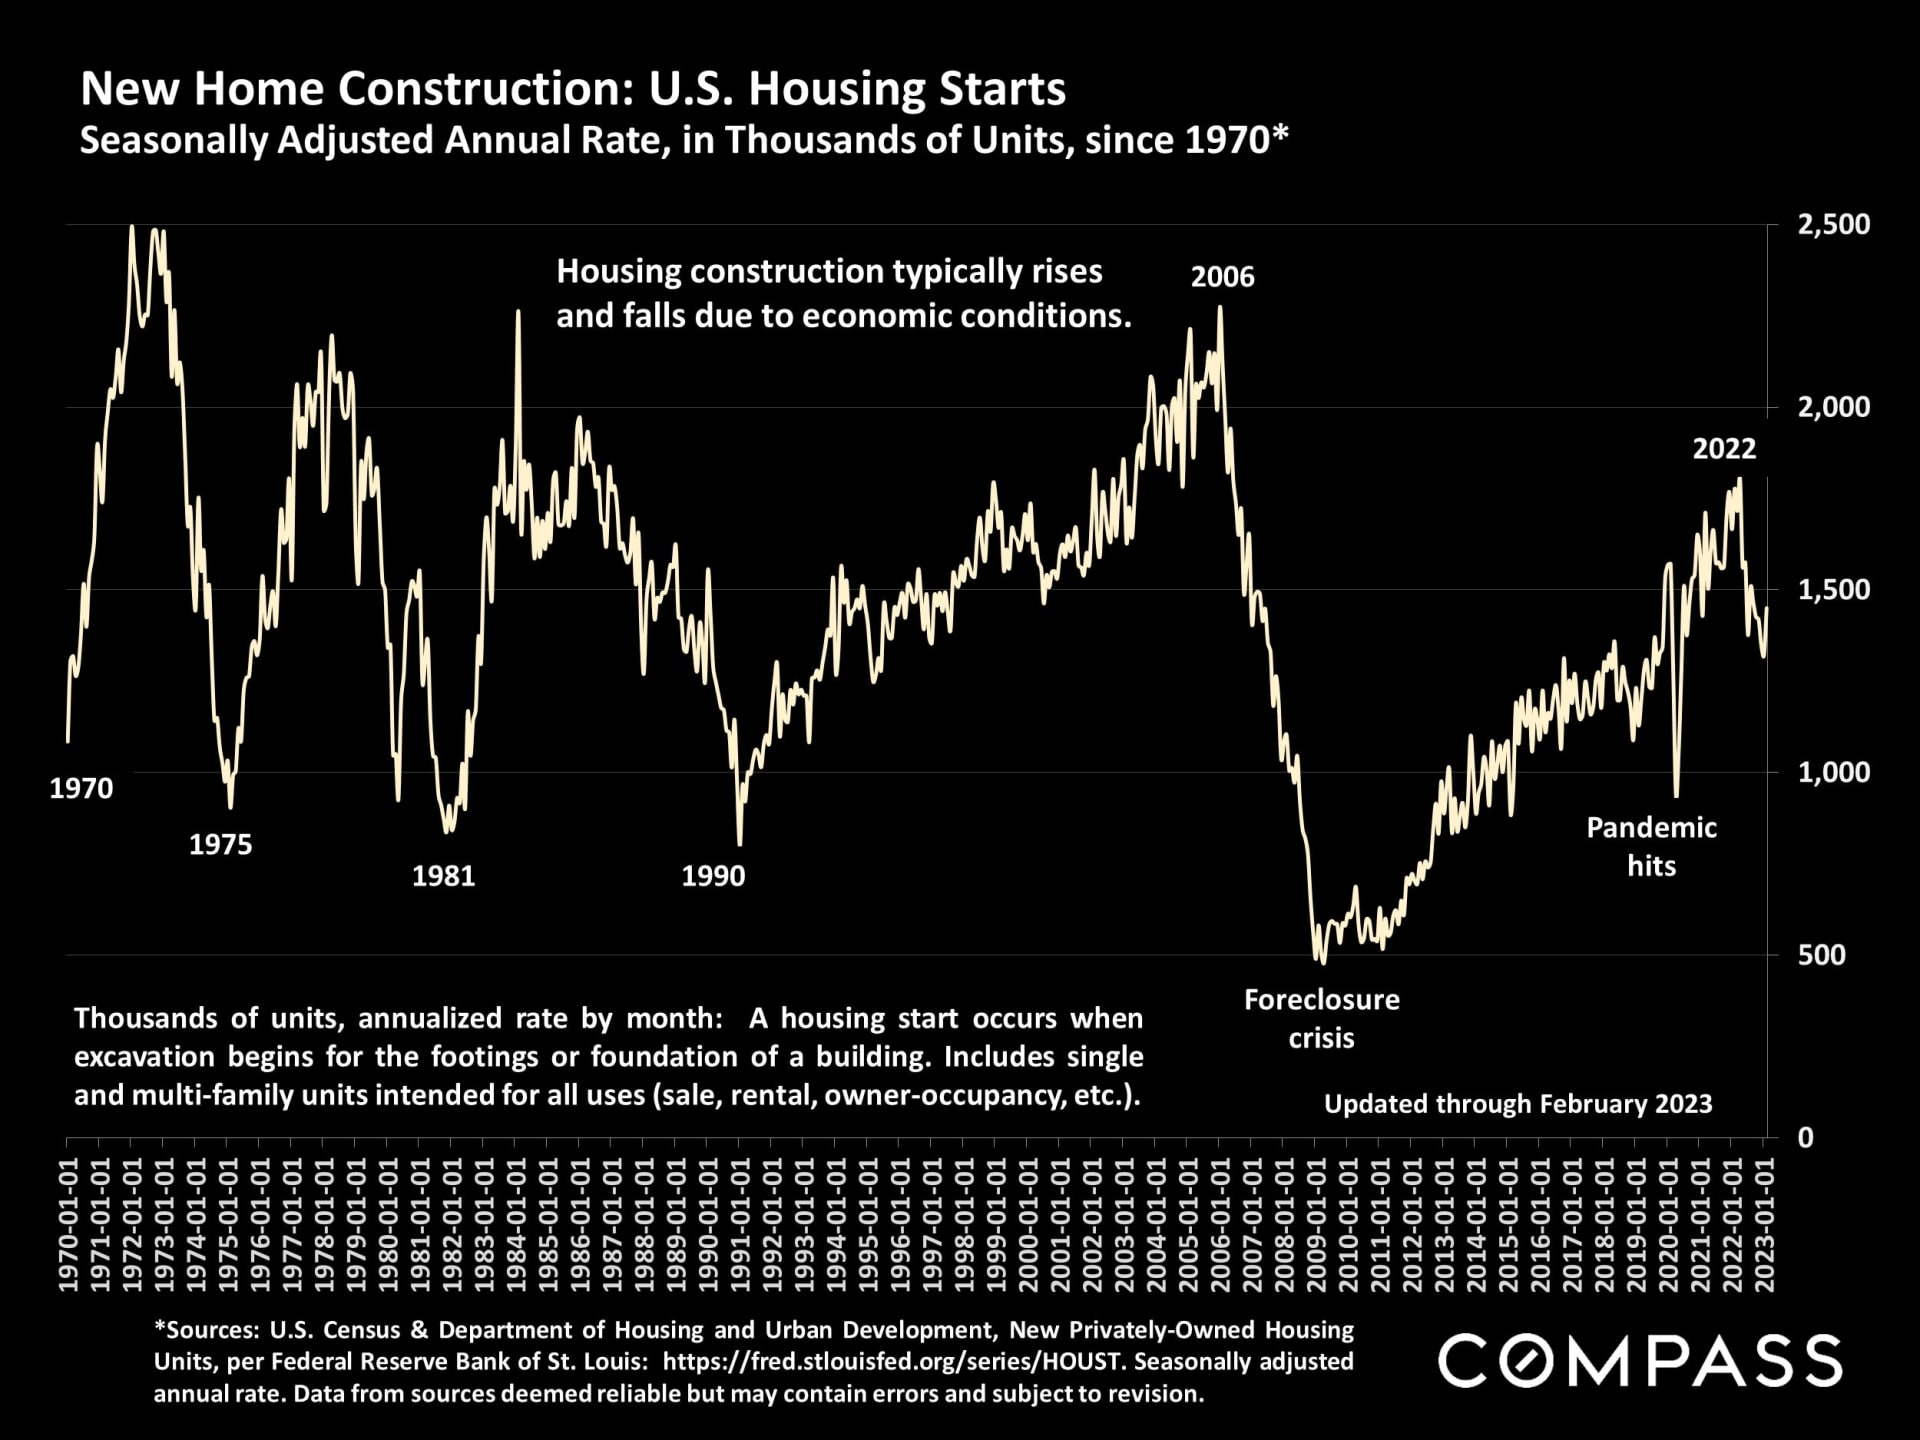
U.S. housing starts since 1970, with a steep decline during the foreclosure crisis and recovery through 2023.

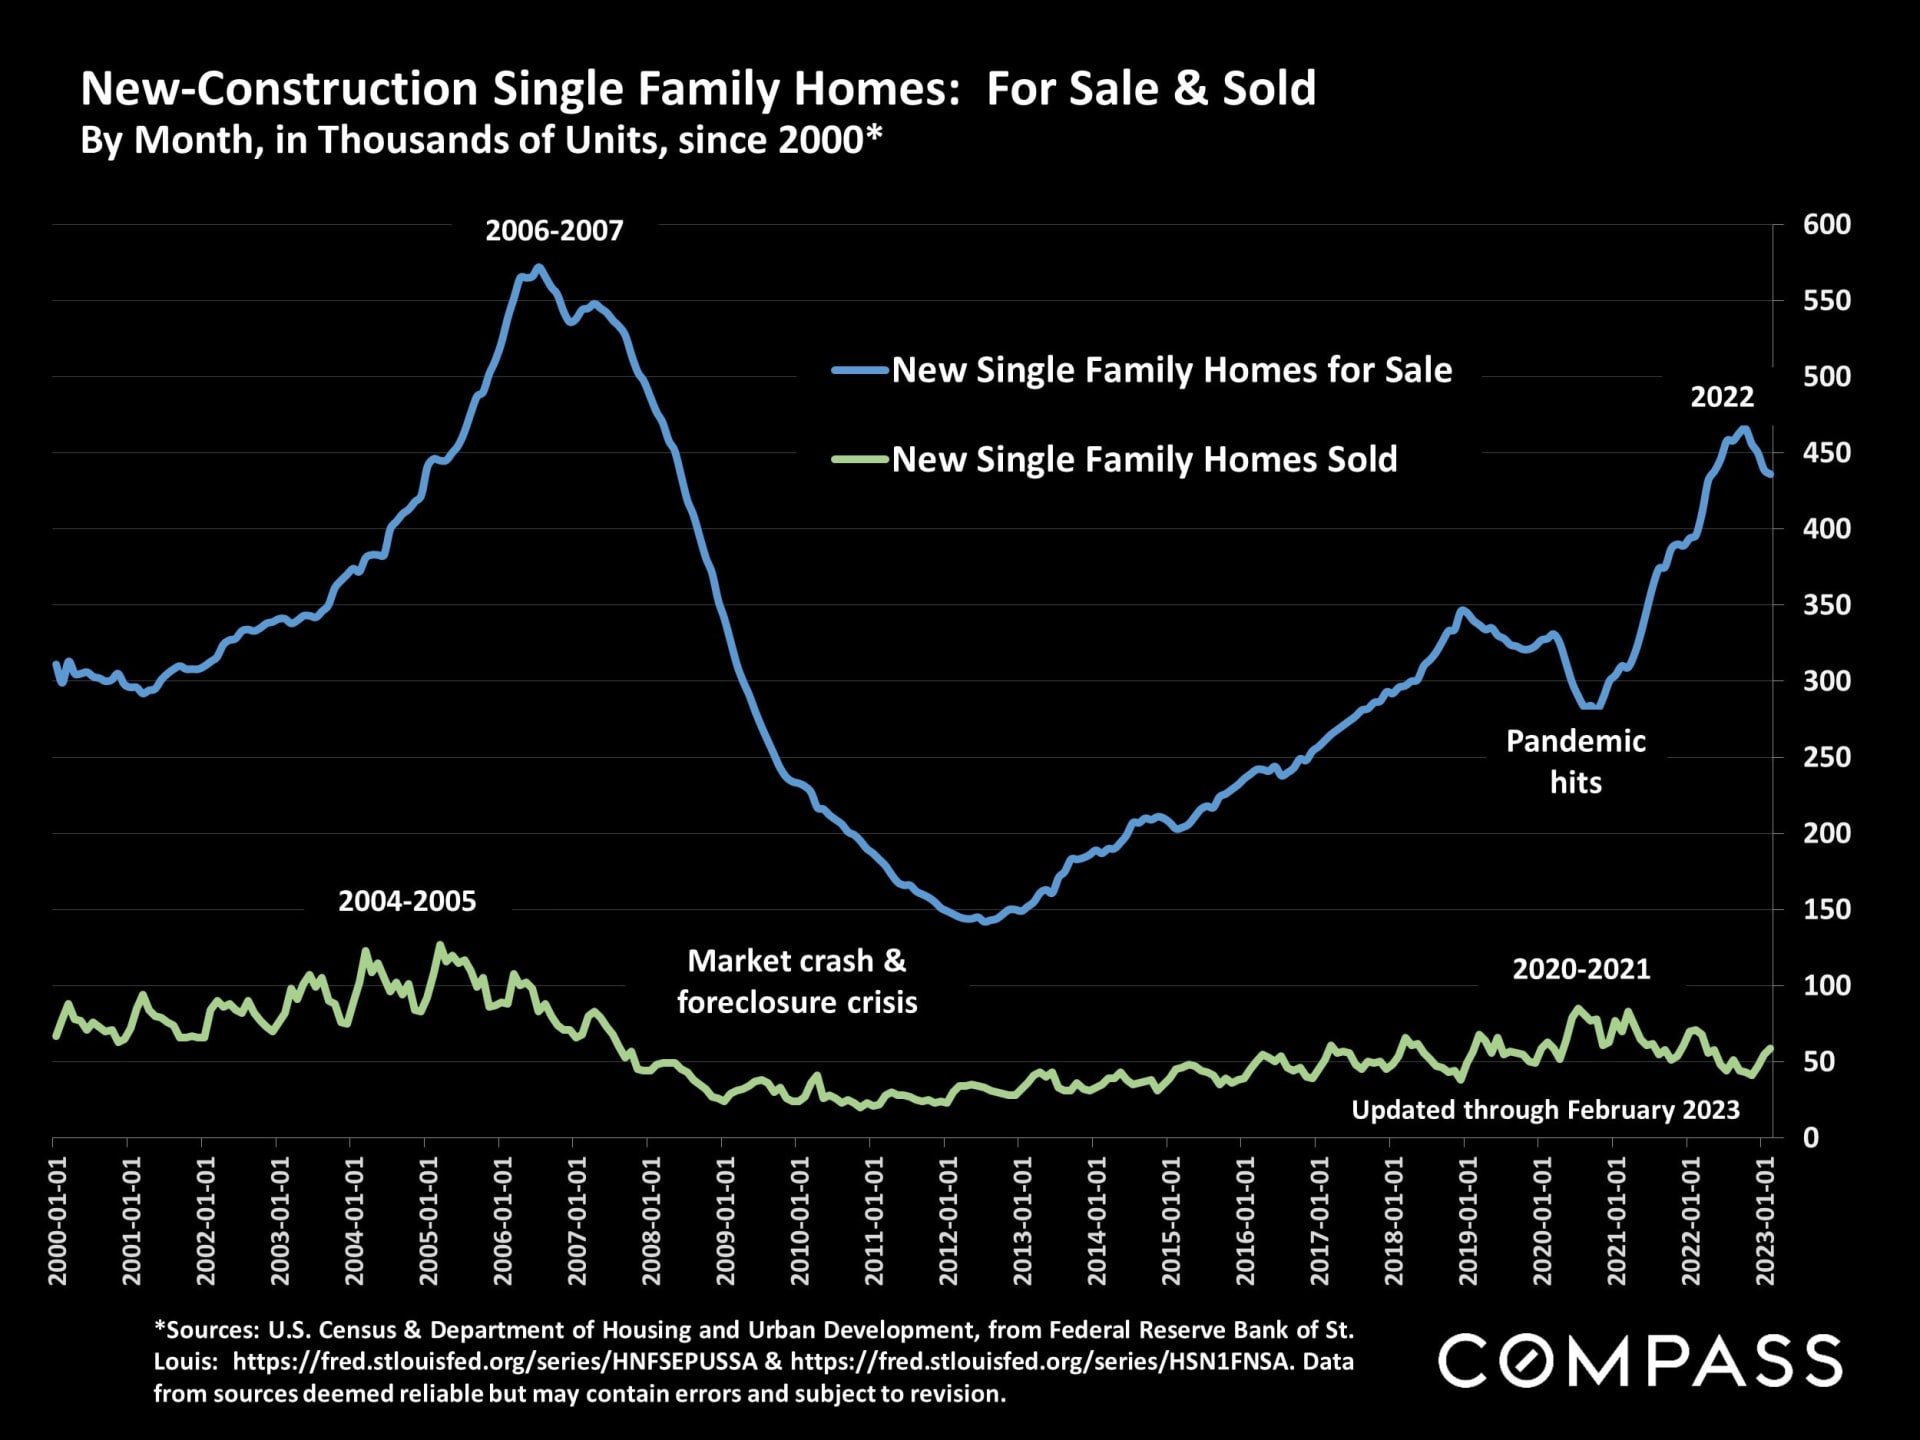
Chart of new-construction single-family homes for sale and sold monthly from 2000 through February 2023.

Report disclaimers above a dotted map of the United States and the Compass wordmark.

Alexander Lurie smiling in a dark blazer and striped shirt.

Meet Alexander

Meet Alexander Lurie

Alexander Fromm Lurie is a highly accomplished San Francisco real estate professional and the leader of The Lurie Group, a top-performing team recognized among the top 1% of agents in the city. With over a decade of experience in the real estate industry and California DRE License #01952347, Alexander has built a reputation for delivering exceptional results, with hundreds of homes sold and over $1 billion in total sales volume. Born and raised in San Francisco, he brings deep local expertise, generational knowledge of the Bay Area, and a strong connection to the community into every client relationship. His approach goes beyond transactions—focusing on helping clients build meaningful connections to neighborhoods, schools, and local culture while navigating the buying or selling process with confidence.

Alexander’s background in management consulting and entrepreneurship further strengthens his strategic approach to real estate, allowing him to provide clients with a competitive edge in pricing, negotiation, and marketing. Known for his integrity, discretion, and client-first mindset, he continues to be a trusted advisor for buyers, sellers, and investors across San Francisco’s dynamic real estate market.

Alexander Lurie

Founder | Real Estate Advisor
LICENSE NUMBER
01952347
ADDRESS
629 Divisadero Ave, San Francisco, CA 94117

Let's Work Together

Our passion is supporting clients who value exceptional results and client care. We look forward to the opportunity to work together.
Modern condo living and dining area with a geometric chandelier and Bay Bridge views through large windows.
link
Follow Us