
The Lurie Group
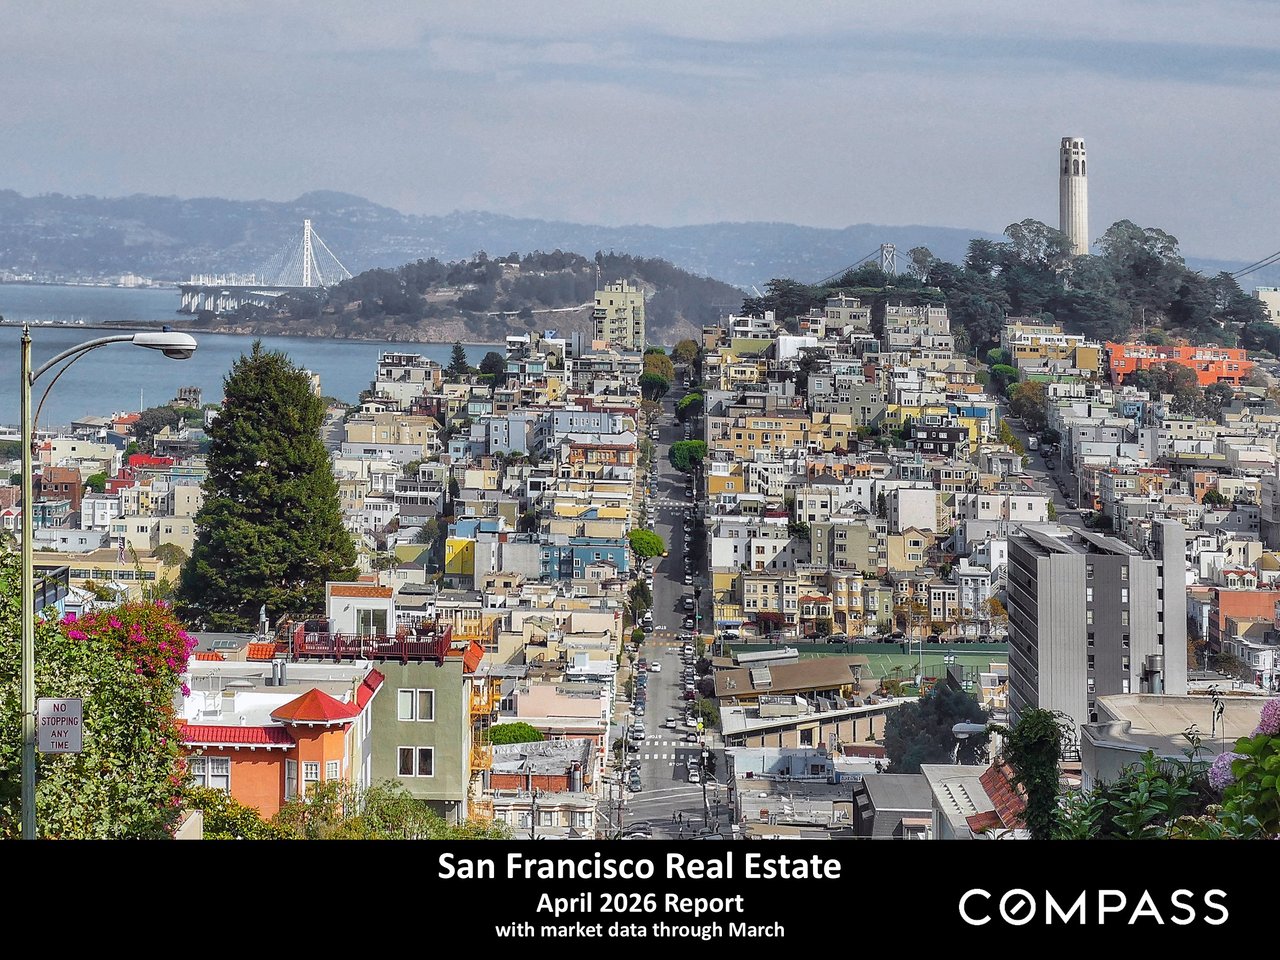
San Francisco Real Estate March 2025 Report, with data through February.

San Francisco 2025 March Real Estate Report

  • Alexander Lurie
  • March 18, 2025

San Francisco Real Estate
March 2025 Report

March 2025 Report
with market data through February

Market activity and demand – as defined by listings going into contract, speed of sale, and
overbidding of list price – rose in February. Unlike other Bay Area markets, San Francisco has not
seen a substantial increase in the number of homes for sale: The inventory of listings has
remained relatively stable on a year-over-year basis for the past 4 years. As has been the case
since the pandemic, the house market continues to be more heated than the condo market,
though luxury condo/co-op sales jumped dramatically in the first 2 months of 2025.

As of the first week of March, the latest inflation reading ticked up for the 4th month; the Fed kept
its benchmark rate unchanged; interest rates fell for the 7th week; and stock markets saw 2 weeks
of significant declines. National and international politics continue to be characterized by constant
and unpredictable change, and enormous uncertainty. And consumer confidence in February
dropped across all age, income and wealth groups as expectations for personal finances and both
short-term and long-term economic conditions all declined (per the University of Michigan’s
February “Surveys of Consumers”).

We are now moving into the spring selling season, typically the most heated of the year, and not
unusually seeing the calendar year’s highest median home sales prices.

This analysis and data were compiled by our friend Patrick Carlisle at Compass.

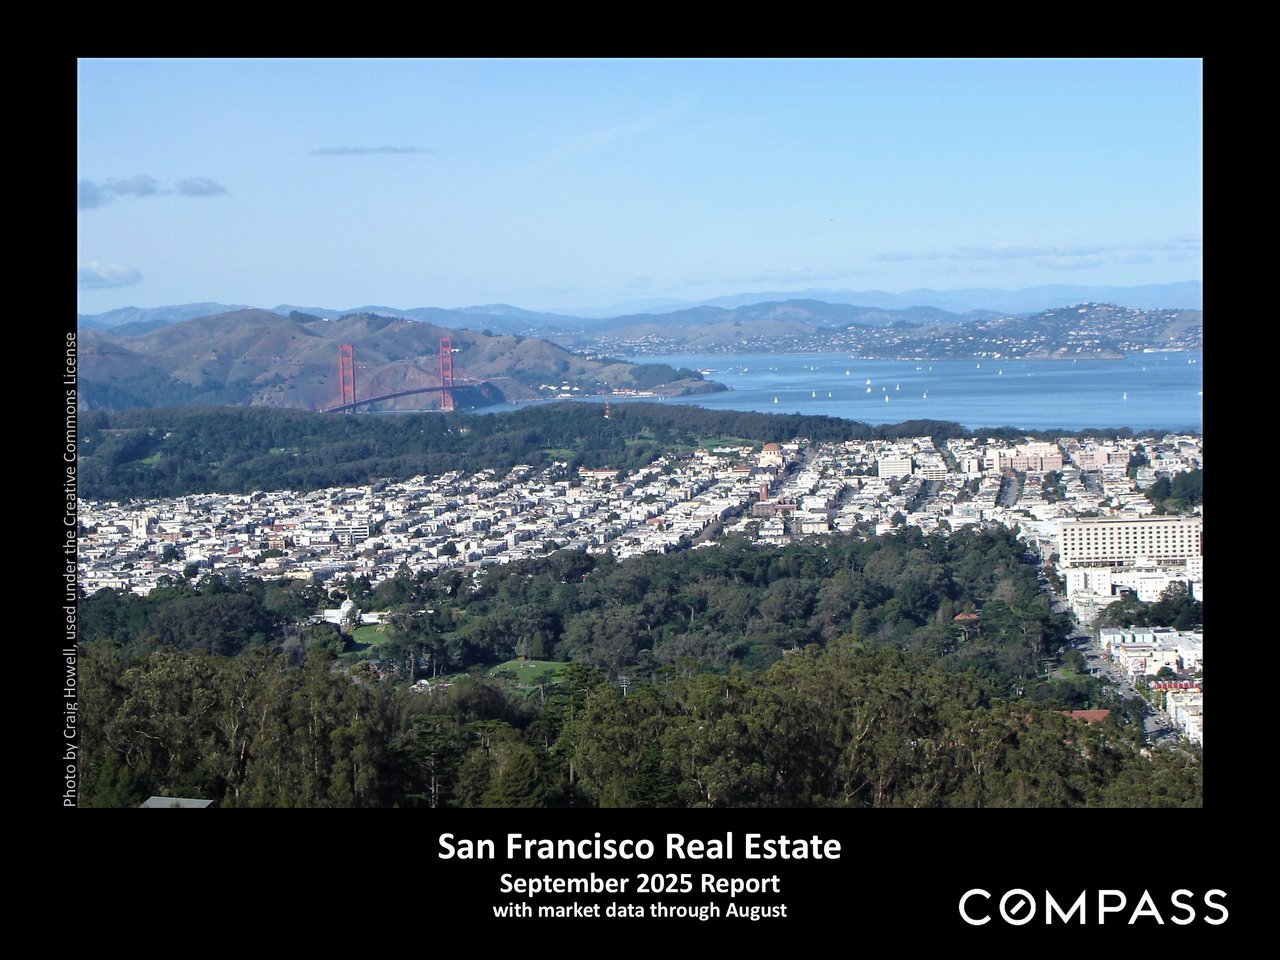
March 2025 San Francisco real estate report summarizing February market activity, inventory, economic conditions, and spring selling season.

Chart of weekly 30-year mortgage rates from 2023 to March 2025, showing a March 6, 2025 rate of 6.63%.

Line chart comparing Nasdaq and S&P 500 percentage changes from January 2024 through March 6, 2025.

San Francisco house prices, 1990–February 2025, shown in a monthly median-price bar chart.

San Francisco home price appreciation chart showing changes from 4% over one year to 290% over 25 years.

San Francisco house sales chart by construction era, with median home sizes and sale prices through February 2025.

Chart of San Francisco condo prices from 2005 to 2025, with recession, pandemic, and interest-rate annotations.

San Francisco condo price appreciation chart, with green bars showing gains from 1% over one year to 182% over 25 years.
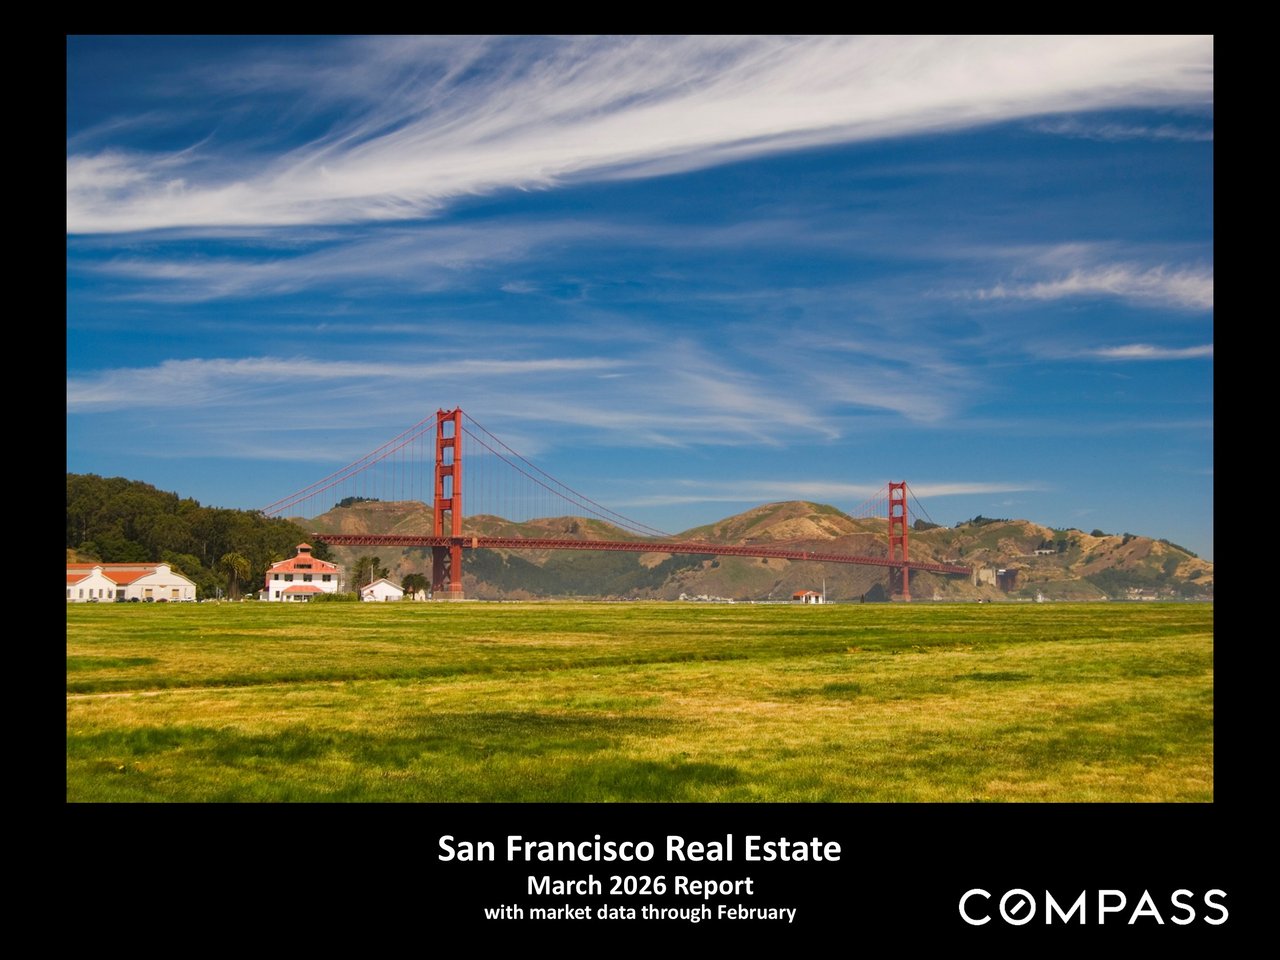
Chart comparing downtown and non-downtown San Francisco two-bedroom condo prices from 2005 through February 2025.

San Francisco median home values chart, comparing condo columns and house prices from 2005 through January 2025.

San Francisco residential market table comparing March 2025 activity by price segment and property type.

Bar chart of San Francisco new listings from 2021 to February 2025, with seasonal annotations and a February 2025 update.

Chart of San Francisco active and coming-soon home listings from February 2022 to March 2025, with counts and market notes.

San Francisco listings entering contract, August 2021–February 2025, with seasonal peaks and a new-year rebound.

San Francisco monthly absorption-rate bar chart, April 2022–February 2025, with February 2025 market notes.

Chart of San Francisco monthly home sales, January 2020–January 2025, with seasonal annotations and February 2025 update.

Chart of San Francisco $5 million-plus house sales, with monthly bars from 2018 to 2025 and a pandemic-boom peak.

Bar chart of San Francisco luxury condo and co-op sales from 2018 to February 2025, with a pandemic-era peak.

Chart of San Francisco active-listing price reductions from January 2018 to January 2025.

San Francisco average days on market chart comparing houses and condos from 2021 through February 2025.

San Francisco overbidding chart, showing the share of home sales closing above list price through February 2025.

San Francisco house and condo sale prices versus original list prices, 2020–February 2025.

VIX volatility index chart from September 2022 to February 2025, with a sharp spike in early August 2024.

Notes on real estate statistics, valuation measures, square-foot calculations, photo licensing, and report disclaimers.

Alexander Lurie smiling in a dark blazer and striped shirt.

Meet Alexander

Meet Alexander Lurie

Alexander Fromm Lurie is a highly accomplished San Francisco real estate professional and the leader of The Lurie Group, a top-performing team recognized among the top 1% of agents in the city. With over a decade of experience in the real estate industry and California DRE License #01952347, Alexander has built a reputation for delivering exceptional results, with hundreds of homes sold and over $1 billion in total sales volume. Born and raised in San Francisco, he brings deep local expertise, generational knowledge of the Bay Area, and a strong connection to the community into every client relationship. His approach goes beyond transactions—focusing on helping clients build meaningful connections to neighborhoods, schools, and local culture while navigating the buying or selling process with confidence.

Alexander’s background in management consulting and entrepreneurship further strengthens his strategic approach to real estate, allowing him to provide clients with a competitive edge in pricing, negotiation, and marketing. Known for his integrity, discretion, and client-first mindset, he continues to be a trusted advisor for buyers, sellers, and investors across San Francisco’s dynamic real estate market.

Alexander Lurie

Founder | Real Estate Advisor
LICENSE NUMBER
01952347
ADDRESS
629 Divisadero Ave, San Francisco, CA 94117

Let's Work Together

Our passion is supporting clients who value exceptional results and client care. We look forward to the opportunity to work together.
Modern condo living and dining area with a geometric chandelier and Bay Bridge views through large windows.
link
Follow Us