The Lurie Group
San Francisco 2024 January Real Estate Report

San Francisco 2024 January Real Estate Report

  • Alexander Lurie
  • January 9, 2024

San Francisco Real Estate
January 2024 Report

Dramatically Improving Economic Indicators
Suggest a Brighter 2024 Housing Market

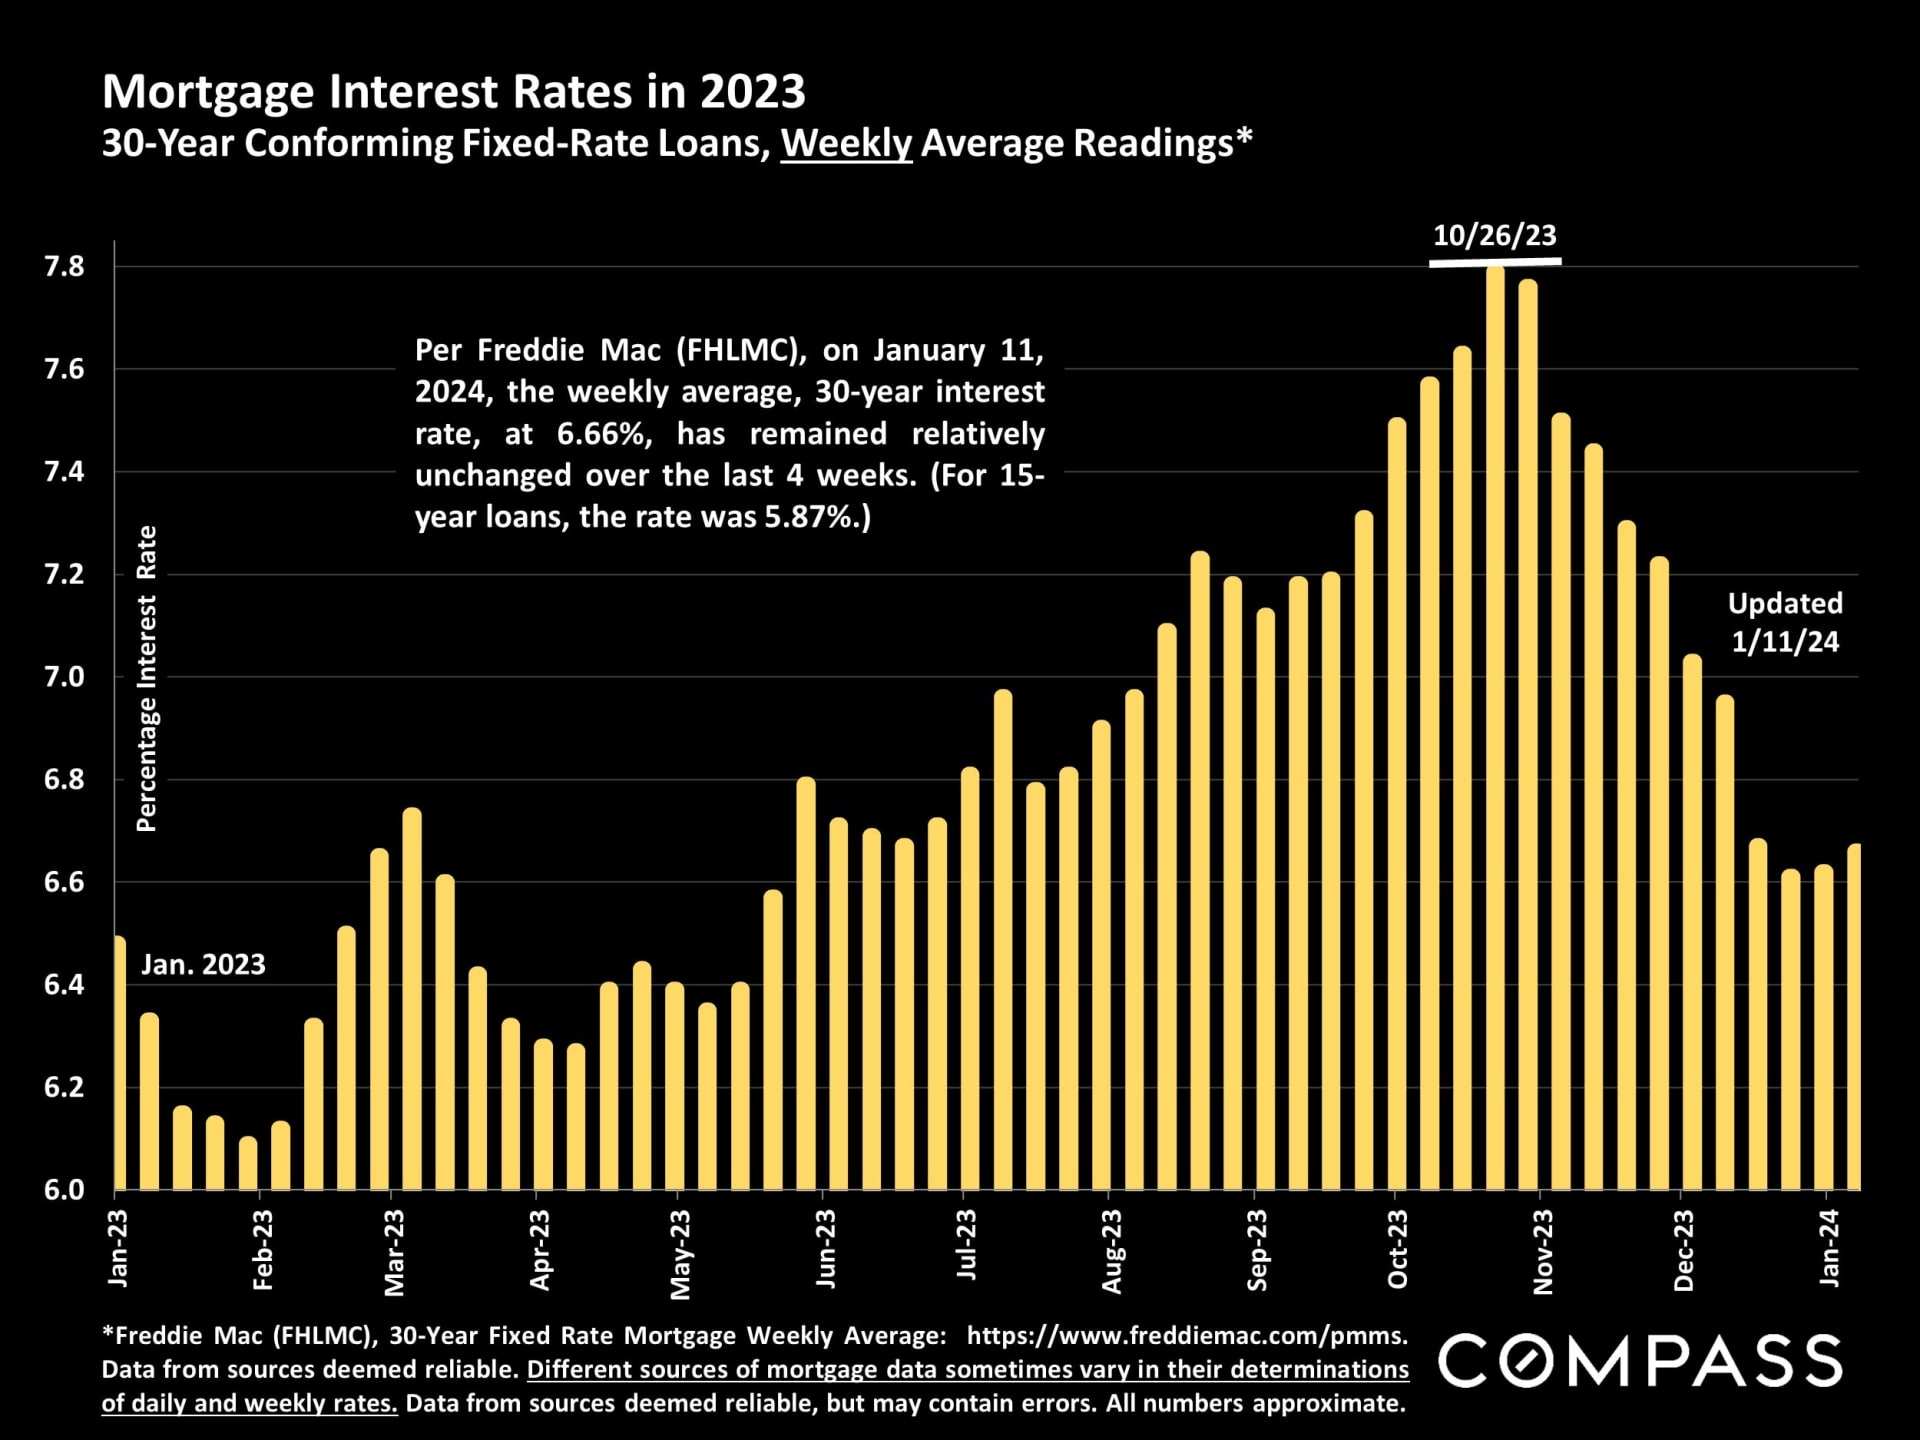
  • In the last 2 months of 2023, the average, weekly, 30-year mortgage interest rate dropped
    from 7.79% to 6.61%. With the fall in inflation this past year, the Fed is widely expected to
    begin dropping its benchmark rate, probably in multiple steps, in 2024. The consensus
    forecast among analysts is for further declines in mortgage interest rates.

  • After its end-of-year rally, the S&P Index was up 25% and the Nasdaq up 45% in 2023 (though
    it has ticked down in early 2024). This plays a major role in Bay Area household wealth.

  • On an annual basis, the 2023 median house sales price was down 13% from 2022, while on a
    quarterly basis, the Q4 price was down less than 1% year-over-year.

The 2023 market was characterized by high interest rates, financial market uncertainty, negative
media “doom-loop” narratives (terribly overdone), social/economic issues pertaining to the
downtown district, and a low supply of new listings in most neighborhoods – generally much
lower for houses than for condos. Total sales volume plunged, while for many prospective sellers,
the motivation to move was reduced by the mortgage lock-in effect. With interest rates falling,
media coverage turning more positive, AI companies expanding in downtown, and economic
conditions and consumer confidence rebounding, the direction is trending positive for San
Francisco real estate.

Note: As often seen in recent years, the complex economic, political and social factors
affecting interest rates, inflation, consumer confidence, and housing and financial
markets can change quickly in unexpected ways. Forecasts and predictions are best
guesses based on the interpretation of recent economic data and trends.

Report graphic summarizes improving economic indicators and the outlook for the 2024 San Francisco housing market.

Real estate market report quotes describe inflation, consumer sentiment, housing activity, mortgage rates, and sales data timing.

Bar chart of 2023 mortgage rates, peaking near 7.8% in October and falling to 6.66% by January 2024.

Chart of San Francisco median house prices, 1993–2023, showing a 2021 peak and a 13% decline in 2023.

San Francisco quarterly median house prices, 2012–2023, peaking at $2 million in Q2 2022.

Chart of San Francisco median condo prices, 1993–2023, peaking in 2021 before declining.

San Francisco quarterly median condo prices, 2012–2023, peaking at $1.3 million in Q2 2022.

Chart comparing median San Francisco condo prices by year, 2005–2023, for downtown and other neighborhoods.

Chart comparing San Francisco condo and TIC median prices from 2000 to 2023, with market-period annotations.

San Francisco median home values per square foot, comparing houses and condos from 2005 to 2023.

Bar chart of San Francisco annual new listings, falling to a decades-low 6,233 in 2023.

Chart of San Francisco home sales from 2005 to 2023, with annual bars and a 27% decline in 2023.

San Francisco 2023 home sales price-segment chart, with a pie chart and property-type breakdown.

San Francisco 2023 inventory chart comparing house and condo MSI across five price ranges.

Chart of San Francisco luxury home sales from 2005–2023, with gold bars for $5 million-plus and a green line for $10 million-plus.

Stacked bar chart of 2023 San Francisco luxury house sales by district and price range.

Chart of 2023 San Francisco luxury home sales by district and price segment.

San Francisco luxury home market infographic comparing top 2023 sales, active or pending listings, and selected neighborhood sales.

Chart of San Francisco active and coming-soon listings, February 2022–January 2024, with January totals highlighted at 752.

Chart of San Francisco listings going into contract monthly from 2020 to 2023, with spring peaks and seasonal trends.

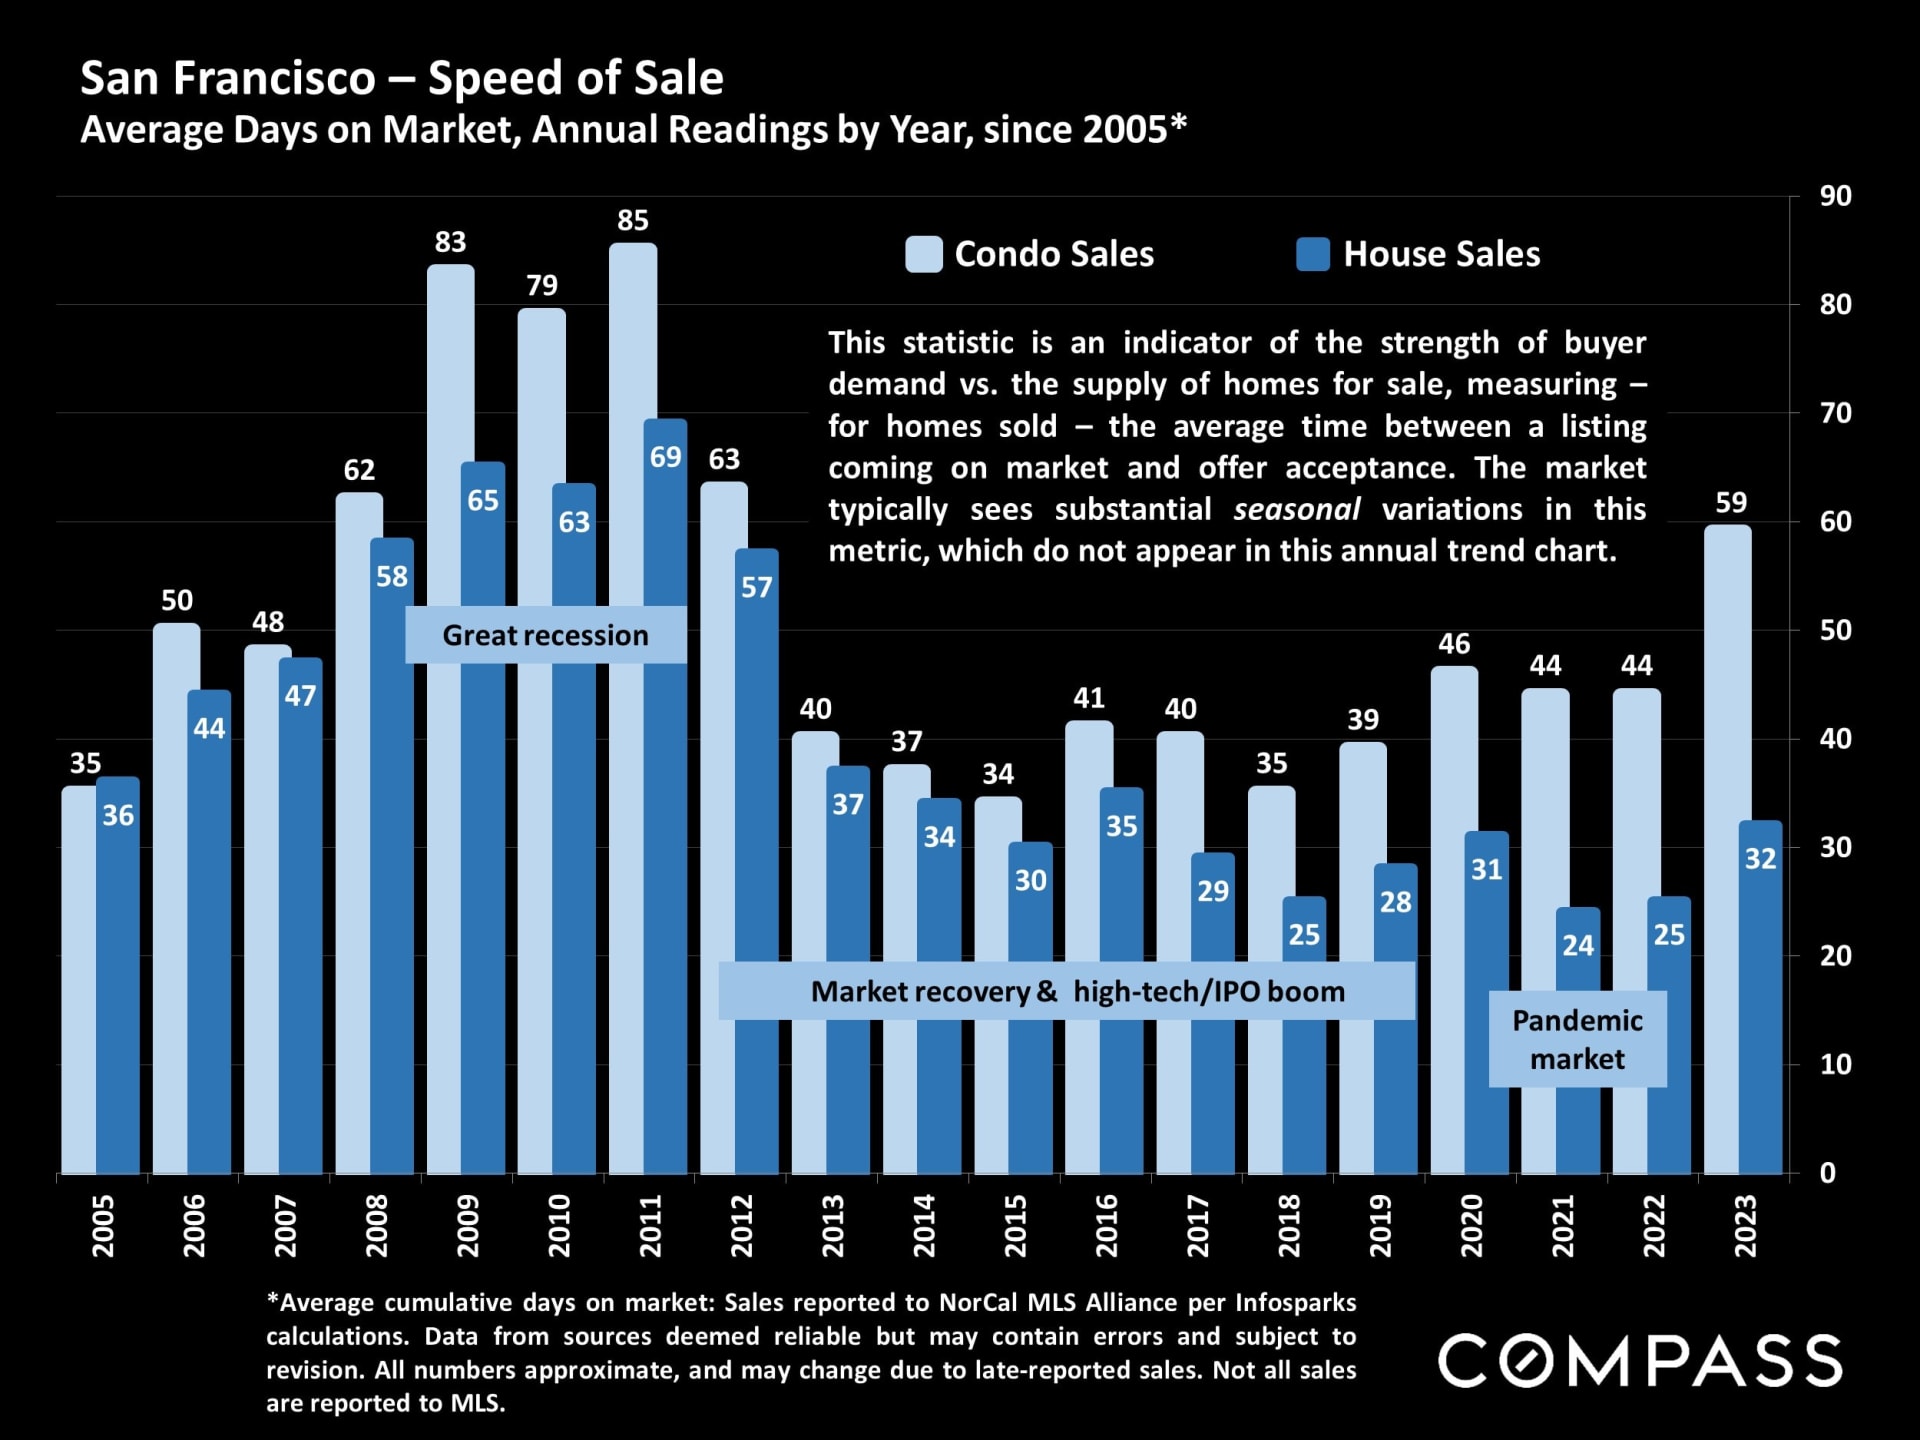
Chart comparing San Francisco condo and house average days on market from 2005 to 2023.

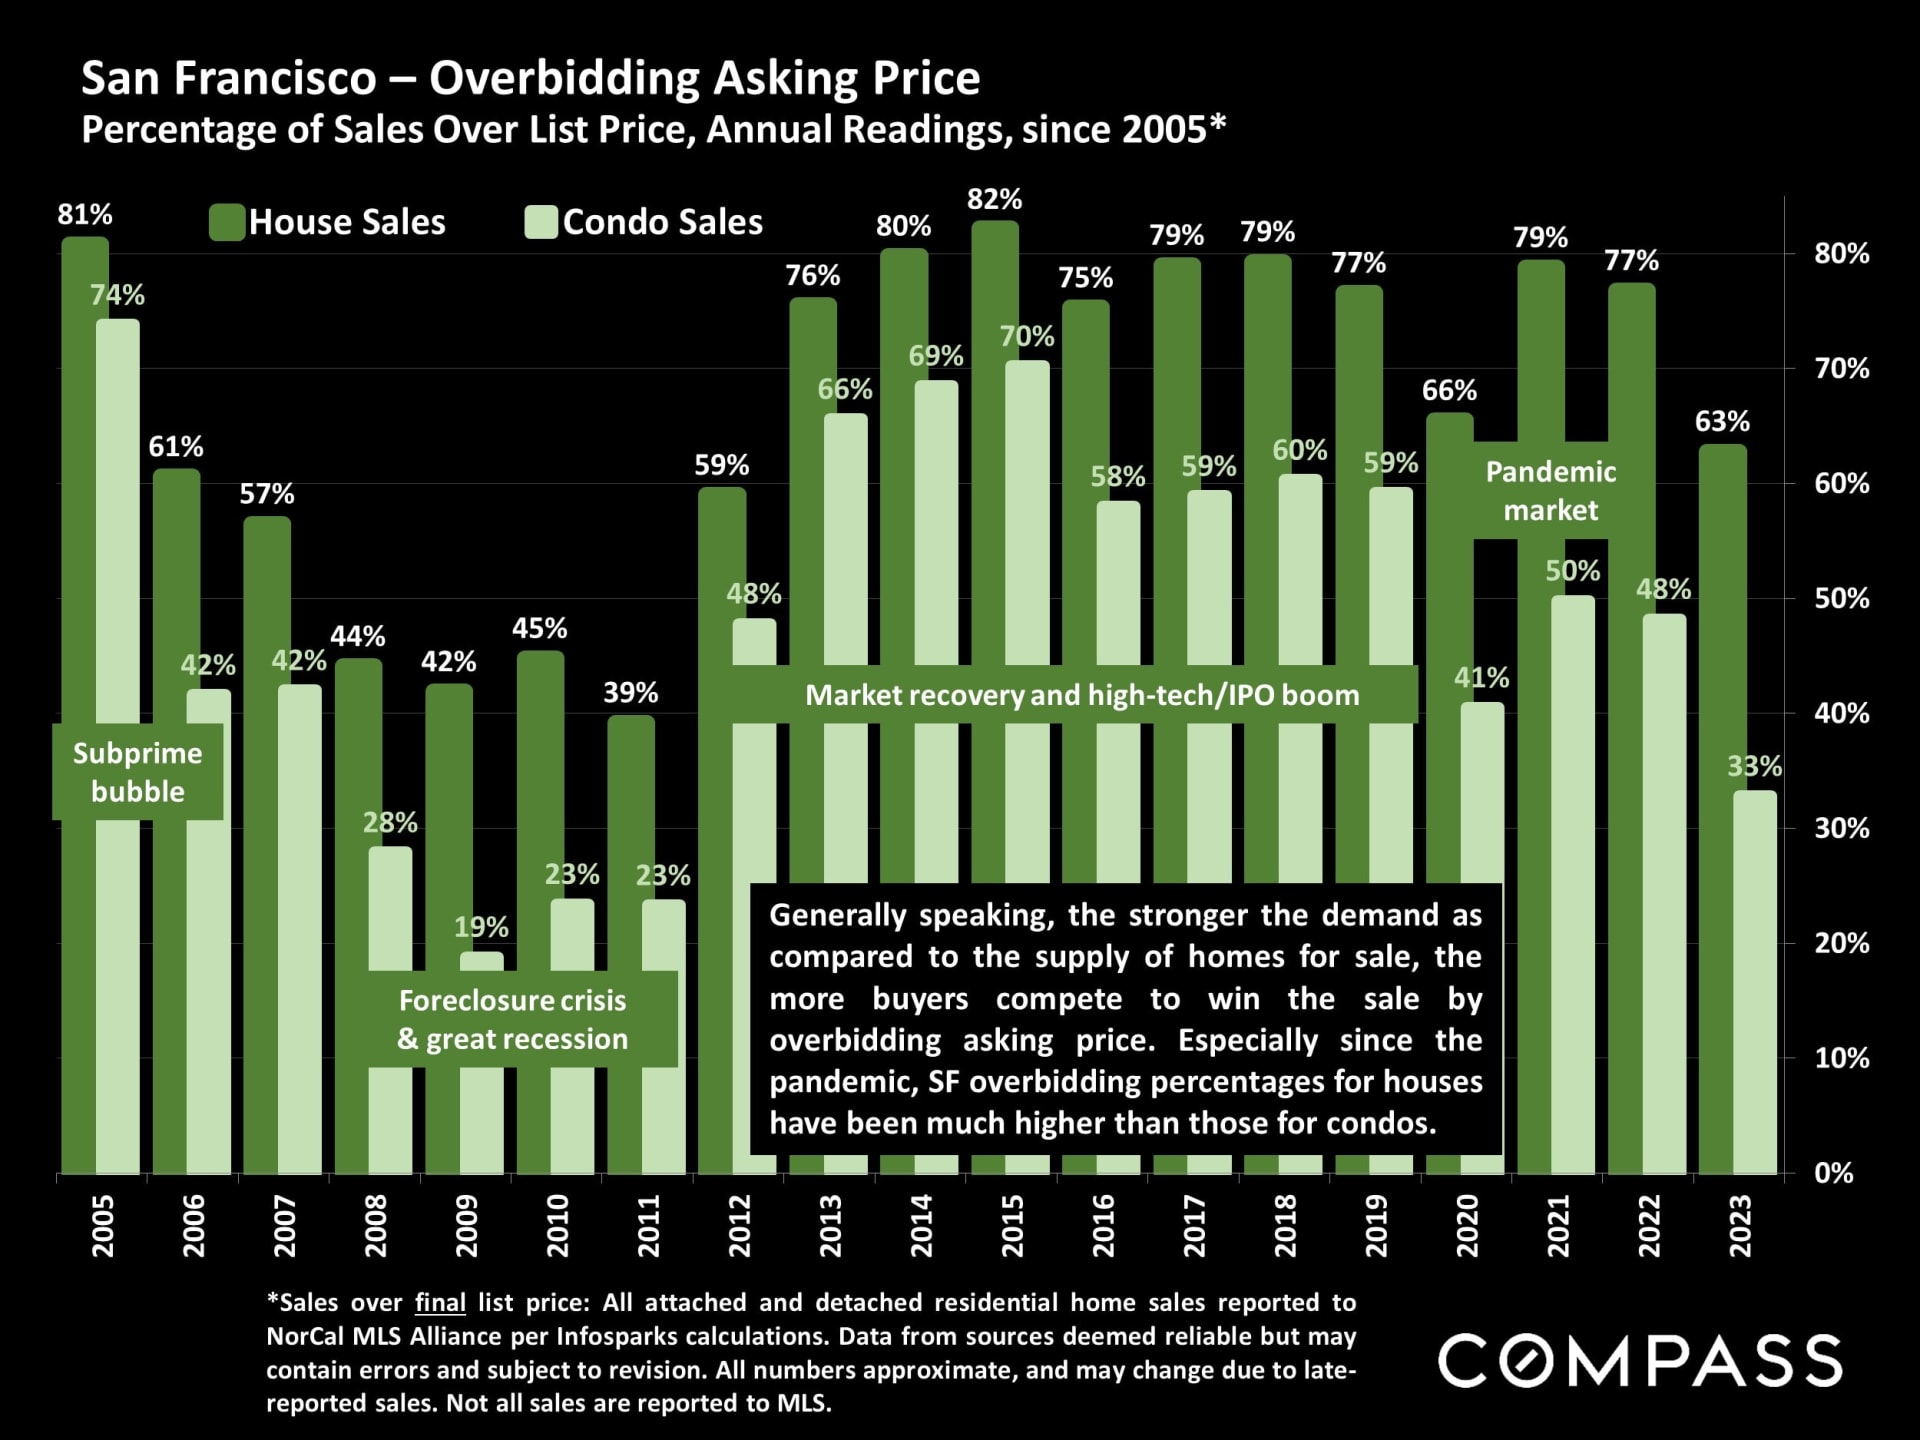
Chart comparing San Francisco house and condo sales over list price from 2005 to 2023, with houses higher in most years.

Chart comparing San Francisco house and condo sale prices to list prices from 2005 to 2023.

Bar chart showing U.S. all-cash buyer percentages from 2015 to 2023, rising to nearly 28% in 2023.

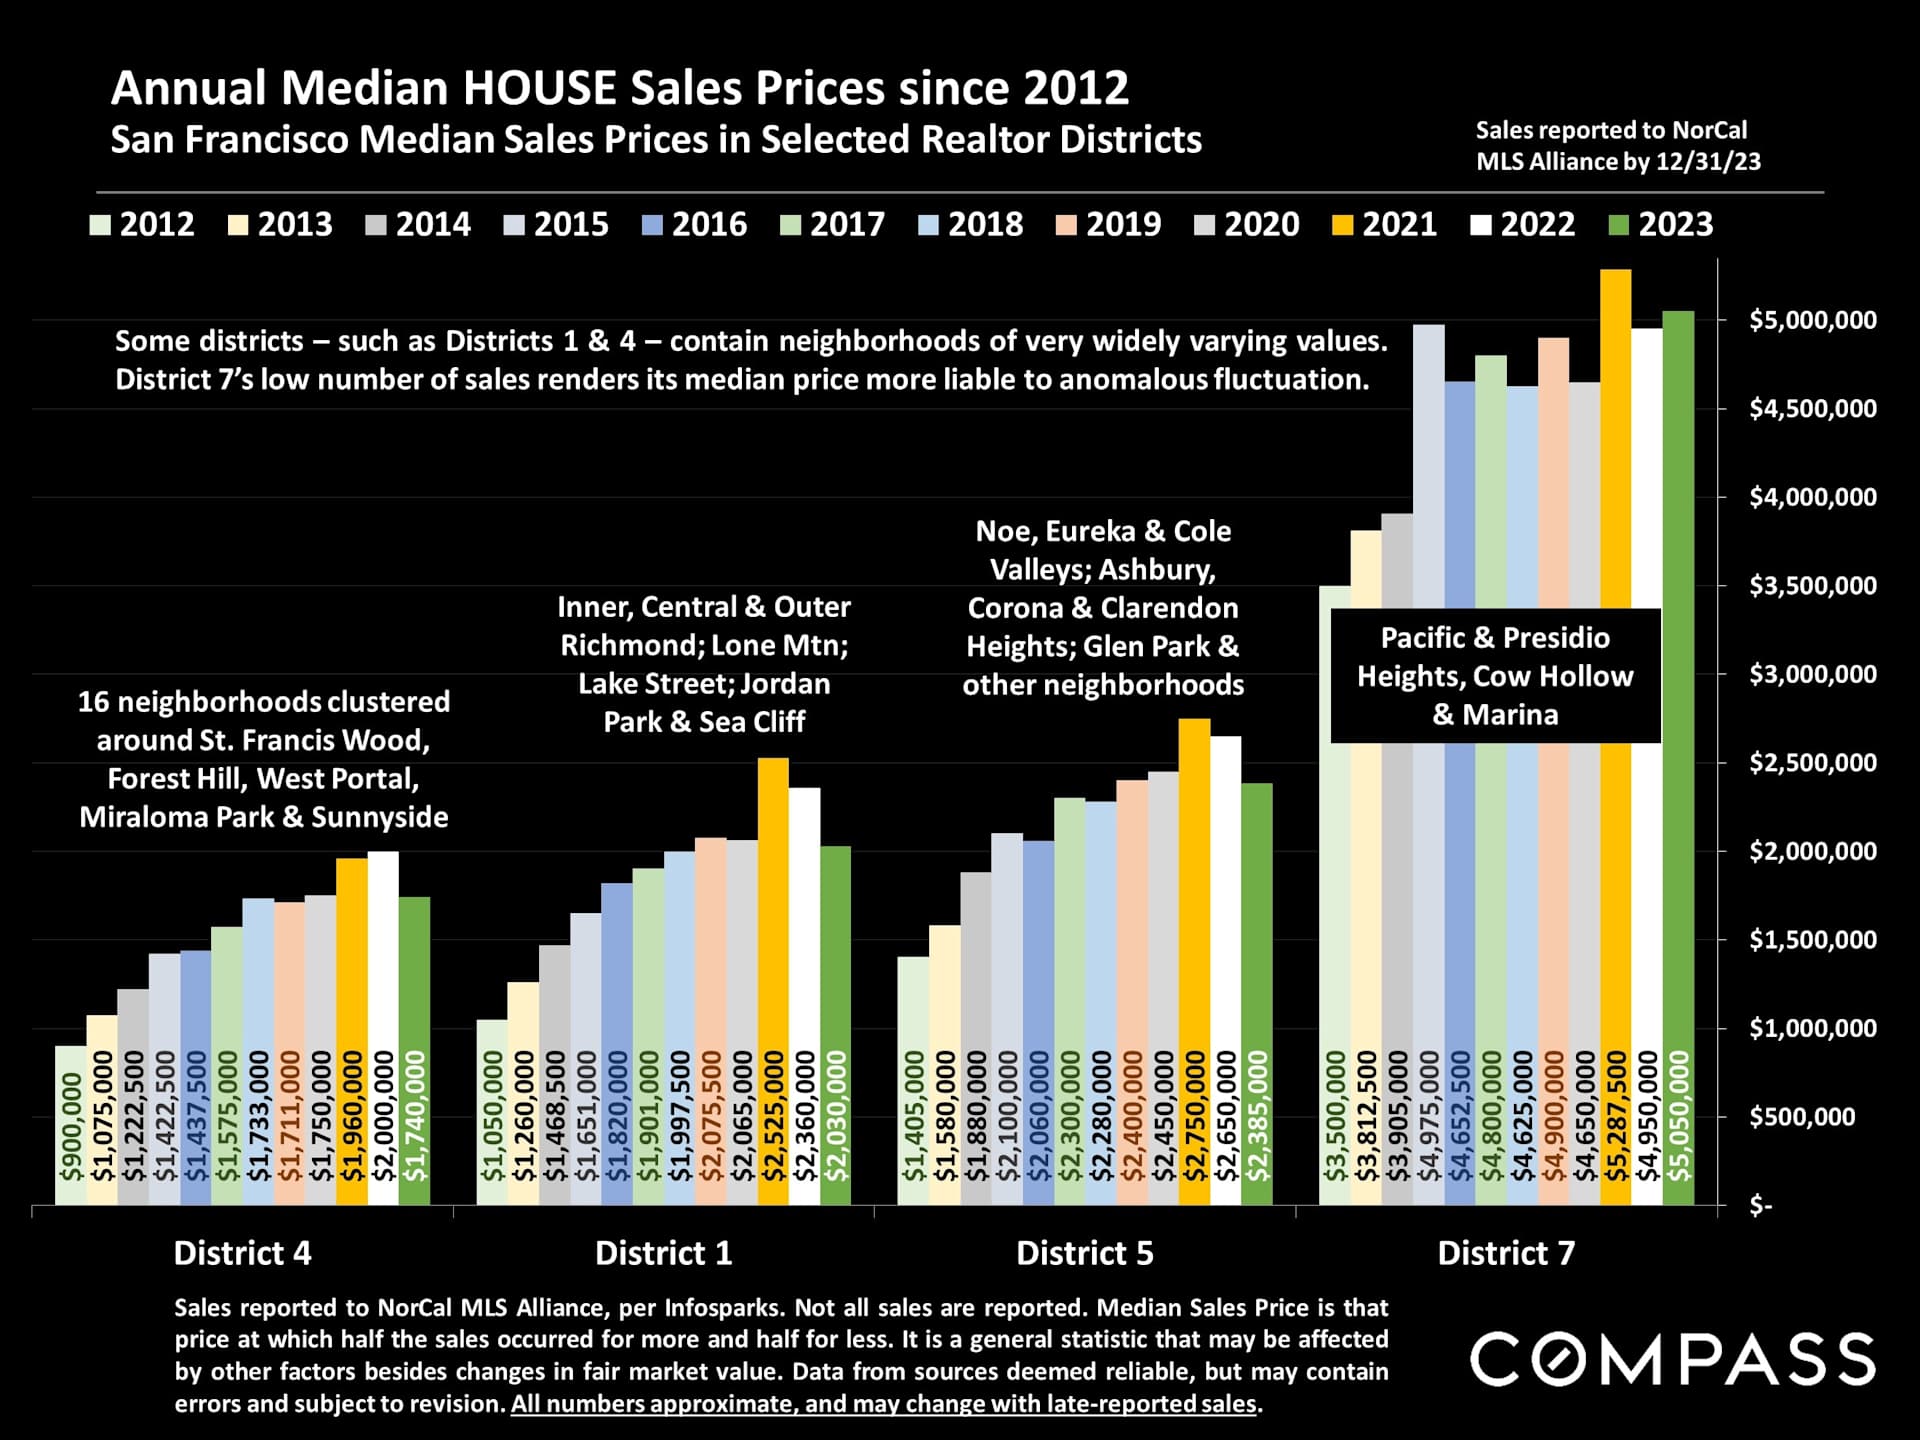
Bar chart comparing annual median house prices from 2012 to 2023 in four San Francisco districts.

Chart comparing annual median house sale prices from 2012 to 2023 across four San Francisco districts.

Bar chart of annual median condo sale prices in five San Francisco districts, 2012–2023.

Chart comparing Bay Area county home values by bedroom and bathroom count, with San Francisco highlighted.

Chart comparing second-half 2023 median home prices, square footage, and price per square foot across 11 Bay Area counties.

Chart comparing Bay Area condo and townhouse median prices, square footage, and price per square foot by county.

Chart of federal funds rates from 1981 to 2023, annotated with major economic events and Federal Reserve actions.

Chart of California population change, 2020–2023: domestic migration losses outweighed gains from foreign migration and natural growth.

Real estate report notes explaining statistics, home values, dollar per square foot, and Compass disclaimers.

Inflation readings as of the morning of January 11: 

Chart of monthly CPI and Core CPI changes from January 2021 to December 2023, with December readings of 3.3% and 3.9%.

S&P and Nasdaq indices, as of mid-day (EST) today: Started the year with small declines, but recovering.

Chart comparing 2023 Nasdaq and S&P 500 gains, ending near 44% and 24%, respectively.

The Census published new, state population data on 12/19/23. These 2 charts look at population changes from April 1, 2020 (just as the pandemic was impacting the country) to July 1, 2023.
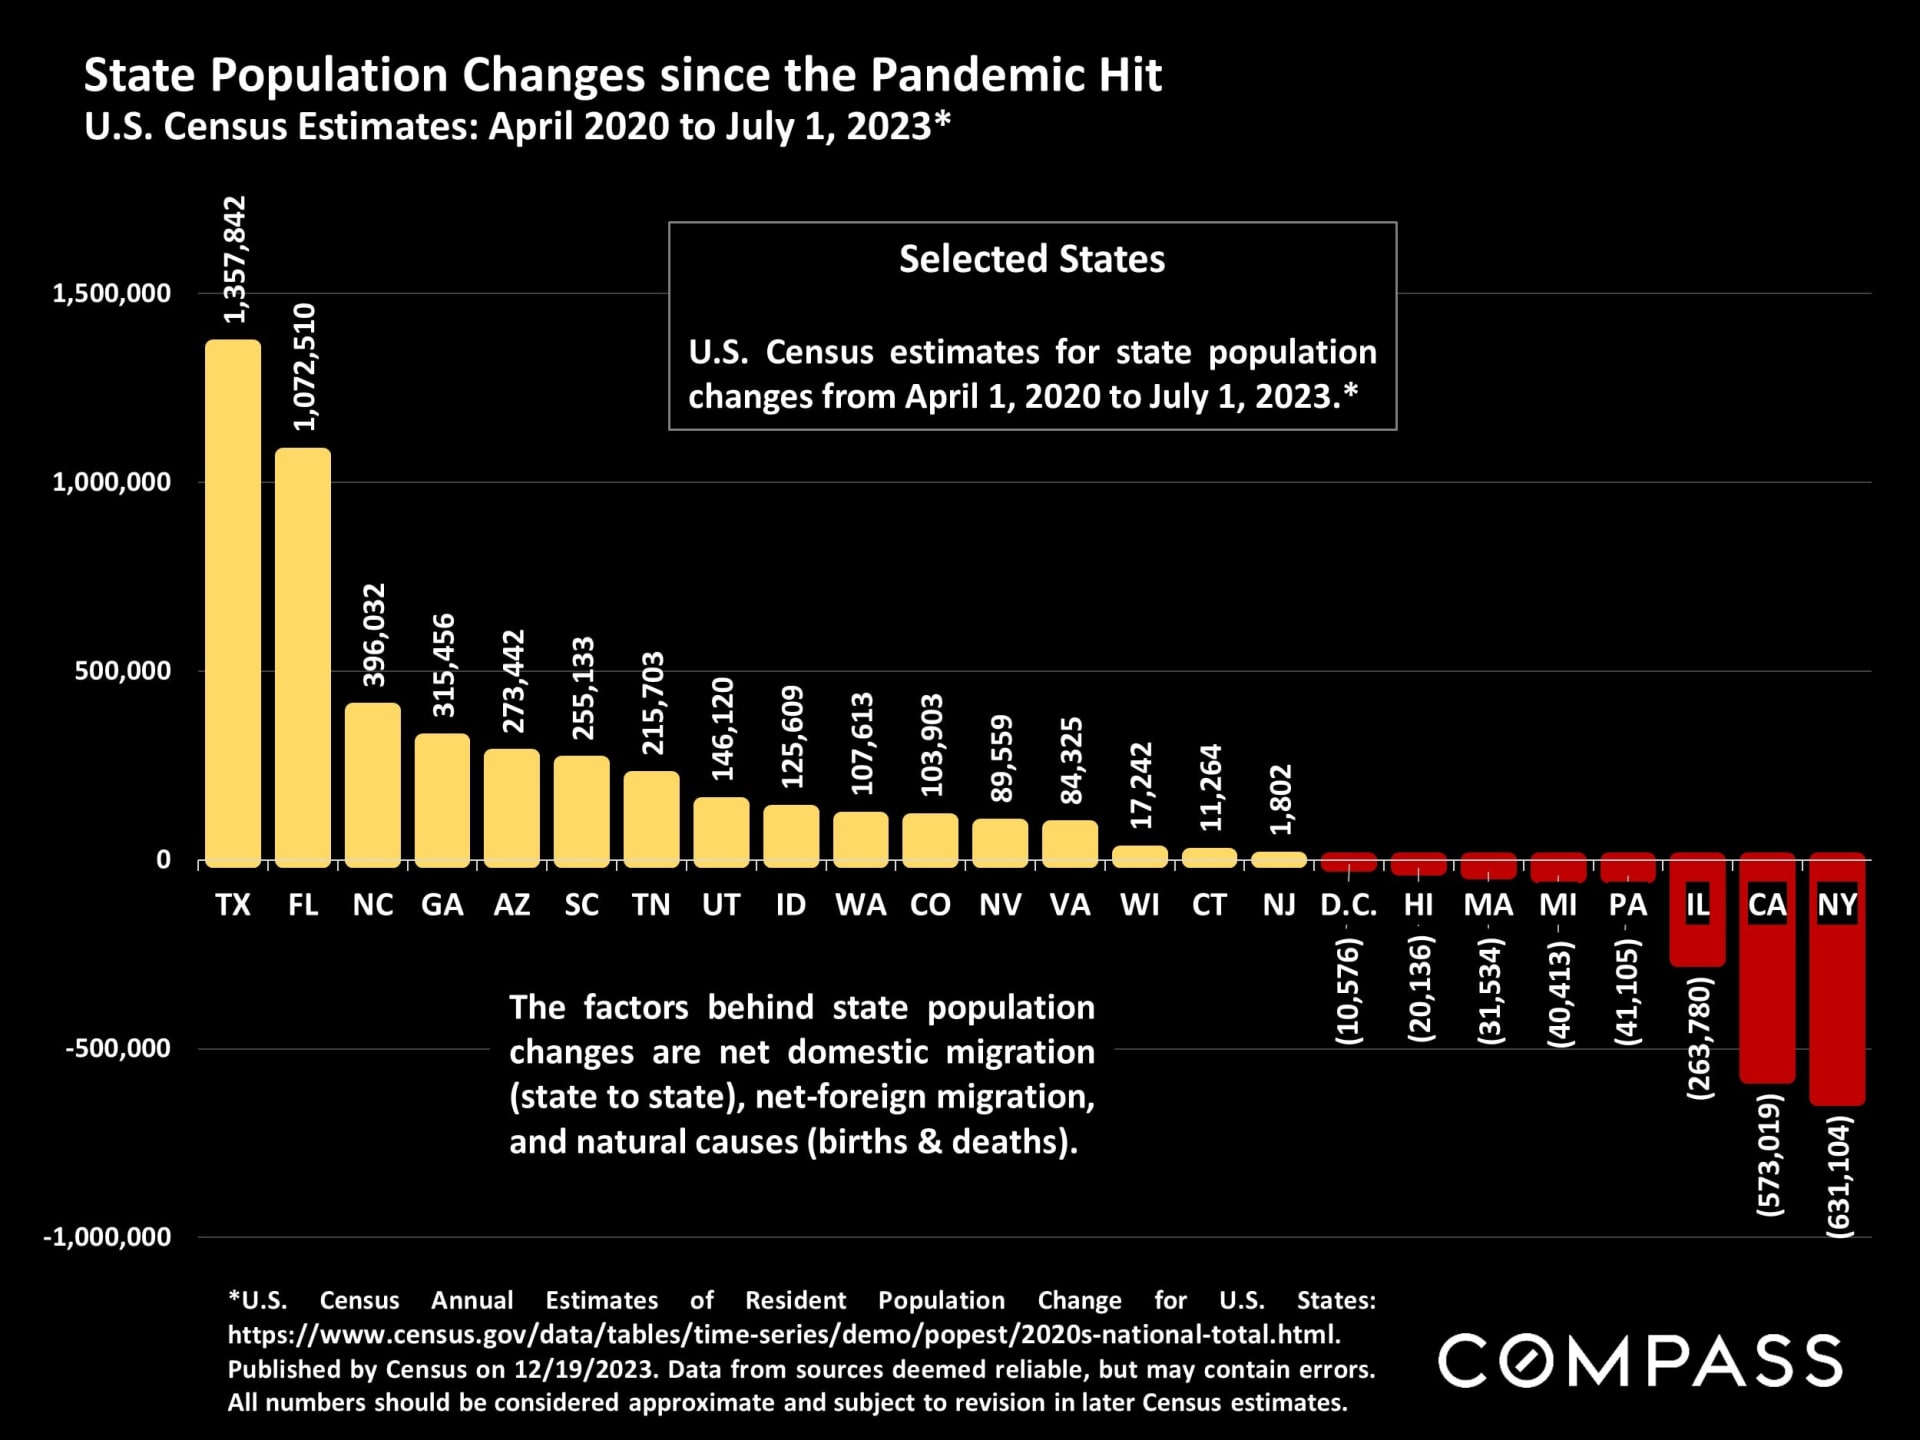
Chart of state population changes from 2020 to 2023, with gains in Texas and Florida and losses in California and New York.

Bar chart of state population changes since 2020; Idaho leads gains, while New York has the largest decline.
Maps of the last 2 years of percentage population changes:  

Infographic comparing state population changes across the United States from 2021–2022 and 2022–2023.

Alexander Lurie smiling in a dark blazer and striped shirt.

Meet Alexander

Meet Alexander Lurie

Alexander Fromm Lurie is a highly accomplished San Francisco real estate professional and the leader of The Lurie Group, a top-performing team recognized among the top 1% of agents in the city. With over a decade of experience in the real estate industry and California DRE License #01952347, Alexander has built a reputation for delivering exceptional results, with hundreds of homes sold and over $1 billion in total sales volume. Born and raised in San Francisco, he brings deep local expertise, generational knowledge of the Bay Area, and a strong connection to the community into every client relationship. His approach goes beyond transactions—focusing on helping clients build meaningful connections to neighborhoods, schools, and local culture while navigating the buying or selling process with confidence.

Alexander’s background in management consulting and entrepreneurship further strengthens his strategic approach to real estate, allowing him to provide clients with a competitive edge in pricing, negotiation, and marketing. Known for his integrity, discretion, and client-first mindset, he continues to be a trusted advisor for buyers, sellers, and investors across San Francisco’s dynamic real estate market.

Alexander Lurie

Founder | Real Estate Advisor
LICENSE NUMBER
01952347
ADDRESS
629 Divisadero Ave, San Francisco, CA 94117

Let's Work Together

Our passion is supporting clients who value exceptional results and client care. We look forward to the opportunity to work together.
Modern condo living and dining area with a geometric chandelier and Bay Bridge views through large windows.
link
Follow Us