The Lurie Group
San Francisco 2022 September Real Estate Report

San Francisco 2022 September Real Estate Report

  • Alexander Lurie
  • September 21, 2022

San Francisco Real Estate
September 2022 Report

In early August, we mentioned agents reporting that buyer activity – renewed interest in getting
back into the market, visits to open houses, and so on – was picking up due to a number of
issues: Price reductions, less competition, the drop in interest rates, and the dramatic recovery
in stock markets. And a small rebound in SF sales did show up in August data – sales usually tick
down in August from July – though volume was still well below last year.

Across the Bay Area, year-over-year, home-price appreciation rates and overbidding statistics
have continued to drop, and days-on-market to climb. In August, the number of new listings
coming on market was lower year over year, and the number of active listings for sale declined,
though still significantly higher than last year. There is usually a dramatic jump in new listing
activity after Labor Day: In fact, September is typically the single month with the highest number
of new listings, which then fuels autumn sales.

As of early September, interest rates have increased again and stock markets declined once
more: They continue to see substantial short-term volatility and it remains difficult to
confidently predict their future movements and effects on real estate markets. The next major
indicator of buyer and seller psychology and market dynamics will be what occurs during the
next 2 months of the autumn selling season, prior to the mid-November to mid-January holiday
slowdown, typically the slowest market of the year.

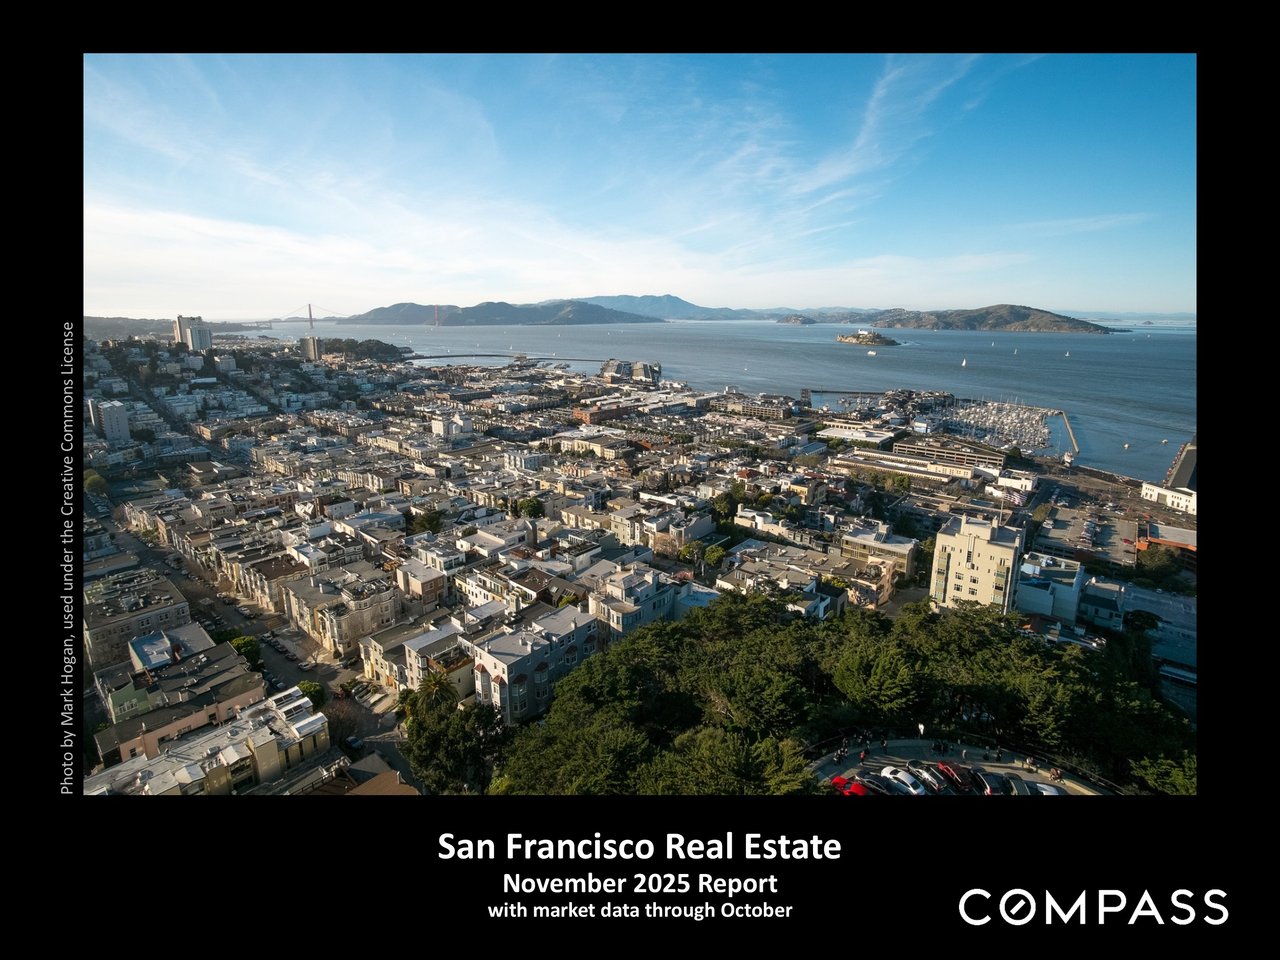
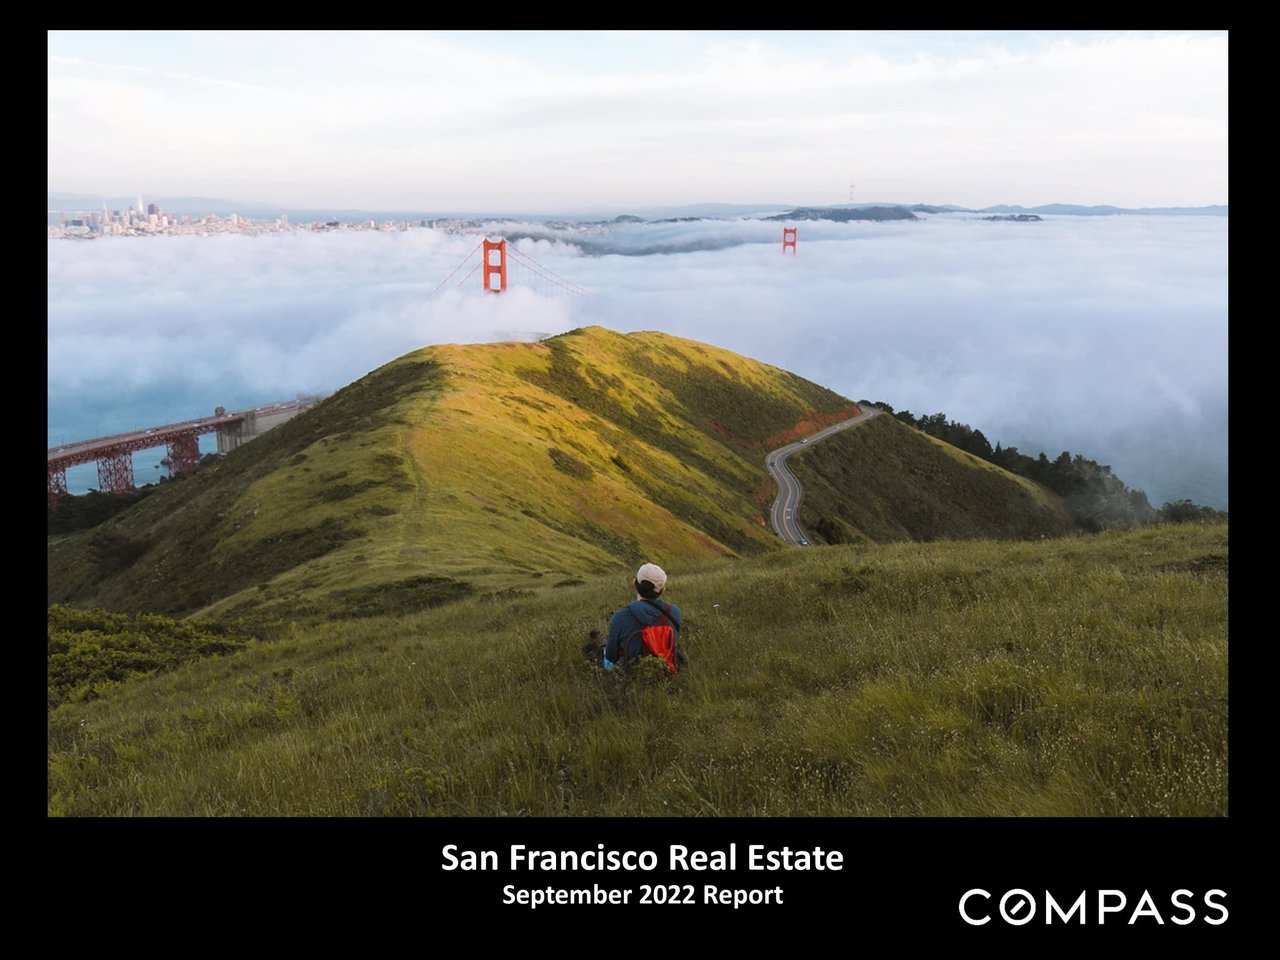
San Francisco September 2022 real estate report cover with the Golden Gate Bridge above the fog

San Francisco market report discussing August sales, Bay Area listings, interest rates, and autumn real estate trends.

Bar chart of San Francisco median house prices, showing monthly trends from 2018 through August 2022.

San Francisco year-over-year house appreciation chart, with values dropping to -7% by August 2022.

Chart of San Francisco median condo prices, January 2018–August 2022, with seasonal peaks and pandemic annotation.

Bar chart of San Francisco condo price changes from January 2020 to August 2022, with monthly gains and declines.

San Francisco residential sales pie chart: 3,982 condos, 2,842 houses, 555 small buildings, 363 TICs, and 77 co-ops.

Line chart compares San Francisco new listings in 2021 and 2022, highlighting an 11% August year-over-year decline.

San Francisco new listings seasonality chart, showing spring rises, summer declines, fall spikes, and winter lows from 2018 to 2022.

San Francisco active listings chart compares 2021 and 2022, with 2022 peaking in June before declining.

San Francisco active listings chart, January 2018–August 2022, showing a sharp inventory surge after COVID-19.

Chart compares San Francisco listings going into contract in 2021 and 2022; August 2022 was down about 25%.

Chart of San Francisco listings accepting offers, January 2019–August 2022, with seasonal trends and pandemic annotations.

Chart comparing San Francisco active-listing price reductions in 2021 and 2022, with 2022 peaking in June before falling.

Chart of monthly San Francisco active-listing price reductions, with October peaks and a sharp 2020 rise.

Chart comparing San Francisco monthly home sales in 2021 and 2022, with August sales at 612 and 435, respectively.

San Francisco monthly home sales chart, January 2019–August 2022, showing seasonal patterns and pandemic-era fluctuations.

Chart comparing monthly San Francisco home sales of $3 million or more in 2021 and 2022.

Chart of San Francisco $3 million-plus home sales, showing monthly seasonal fluctuations from 2018 through August 2022.

Table comparing 2022 large-home sales and median prices across Bay Area counties, with San Francisco highlighted.

Chart of San Francisco home sales closing over list price, showing monthly trends from 2018 to August 2022.

San Francisco chart comparing house and condo sale prices to original list prices from 2019 through August 2022.

San Francisco average days-on-market chart comparing houses and condos from January 2019 to August 2022.

Real estate report notes explain statistics, median sales price, price per square foot, and Compass disclaimers.


Alexander Lurie smiling in a dark blazer and striped shirt.

Meet Alexander

Meet Alexander Lurie

Alexander Fromm Lurie is a highly accomplished San Francisco real estate professional and the leader of The Lurie Group, a top-performing team recognized among the top 1% of agents in the city. With over a decade of experience in the real estate industry and California DRE License #01952347, Alexander has built a reputation for delivering exceptional results, with hundreds of homes sold and over $1 billion in total sales volume. Born and raised in San Francisco, he brings deep local expertise, generational knowledge of the Bay Area, and a strong connection to the community into every client relationship. His approach goes beyond transactions—focusing on helping clients build meaningful connections to neighborhoods, schools, and local culture while navigating the buying or selling process with confidence.

Alexander’s background in management consulting and entrepreneurship further strengthens his strategic approach to real estate, allowing him to provide clients with a competitive edge in pricing, negotiation, and marketing. Known for his integrity, discretion, and client-first mindset, he continues to be a trusted advisor for buyers, sellers, and investors across San Francisco’s dynamic real estate market.

Alexander Lurie

Founder | Real Estate Advisor
LICENSE NUMBER
01952347
ADDRESS
629 Divisadero Ave, San Francisco, CA 94117

Let's Work Together

Our passion is supporting clients who value exceptional results and client care. We look forward to the opportunity to work together.
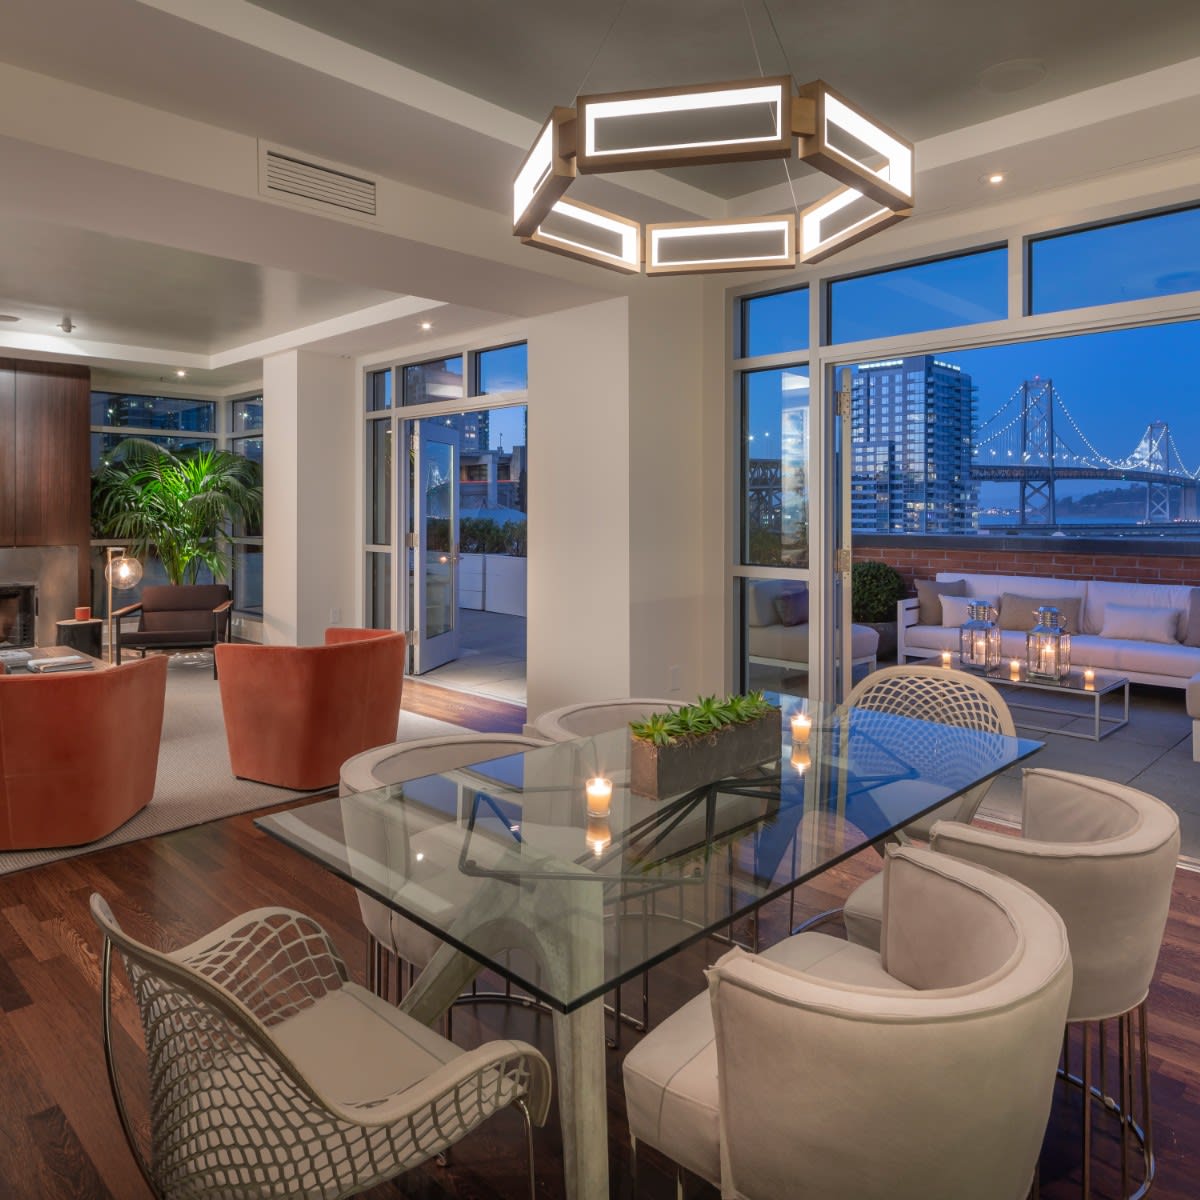
Modern condo living and dining area with a geometric chandelier and Bay Bridge views through large windows.

link
Follow Us