
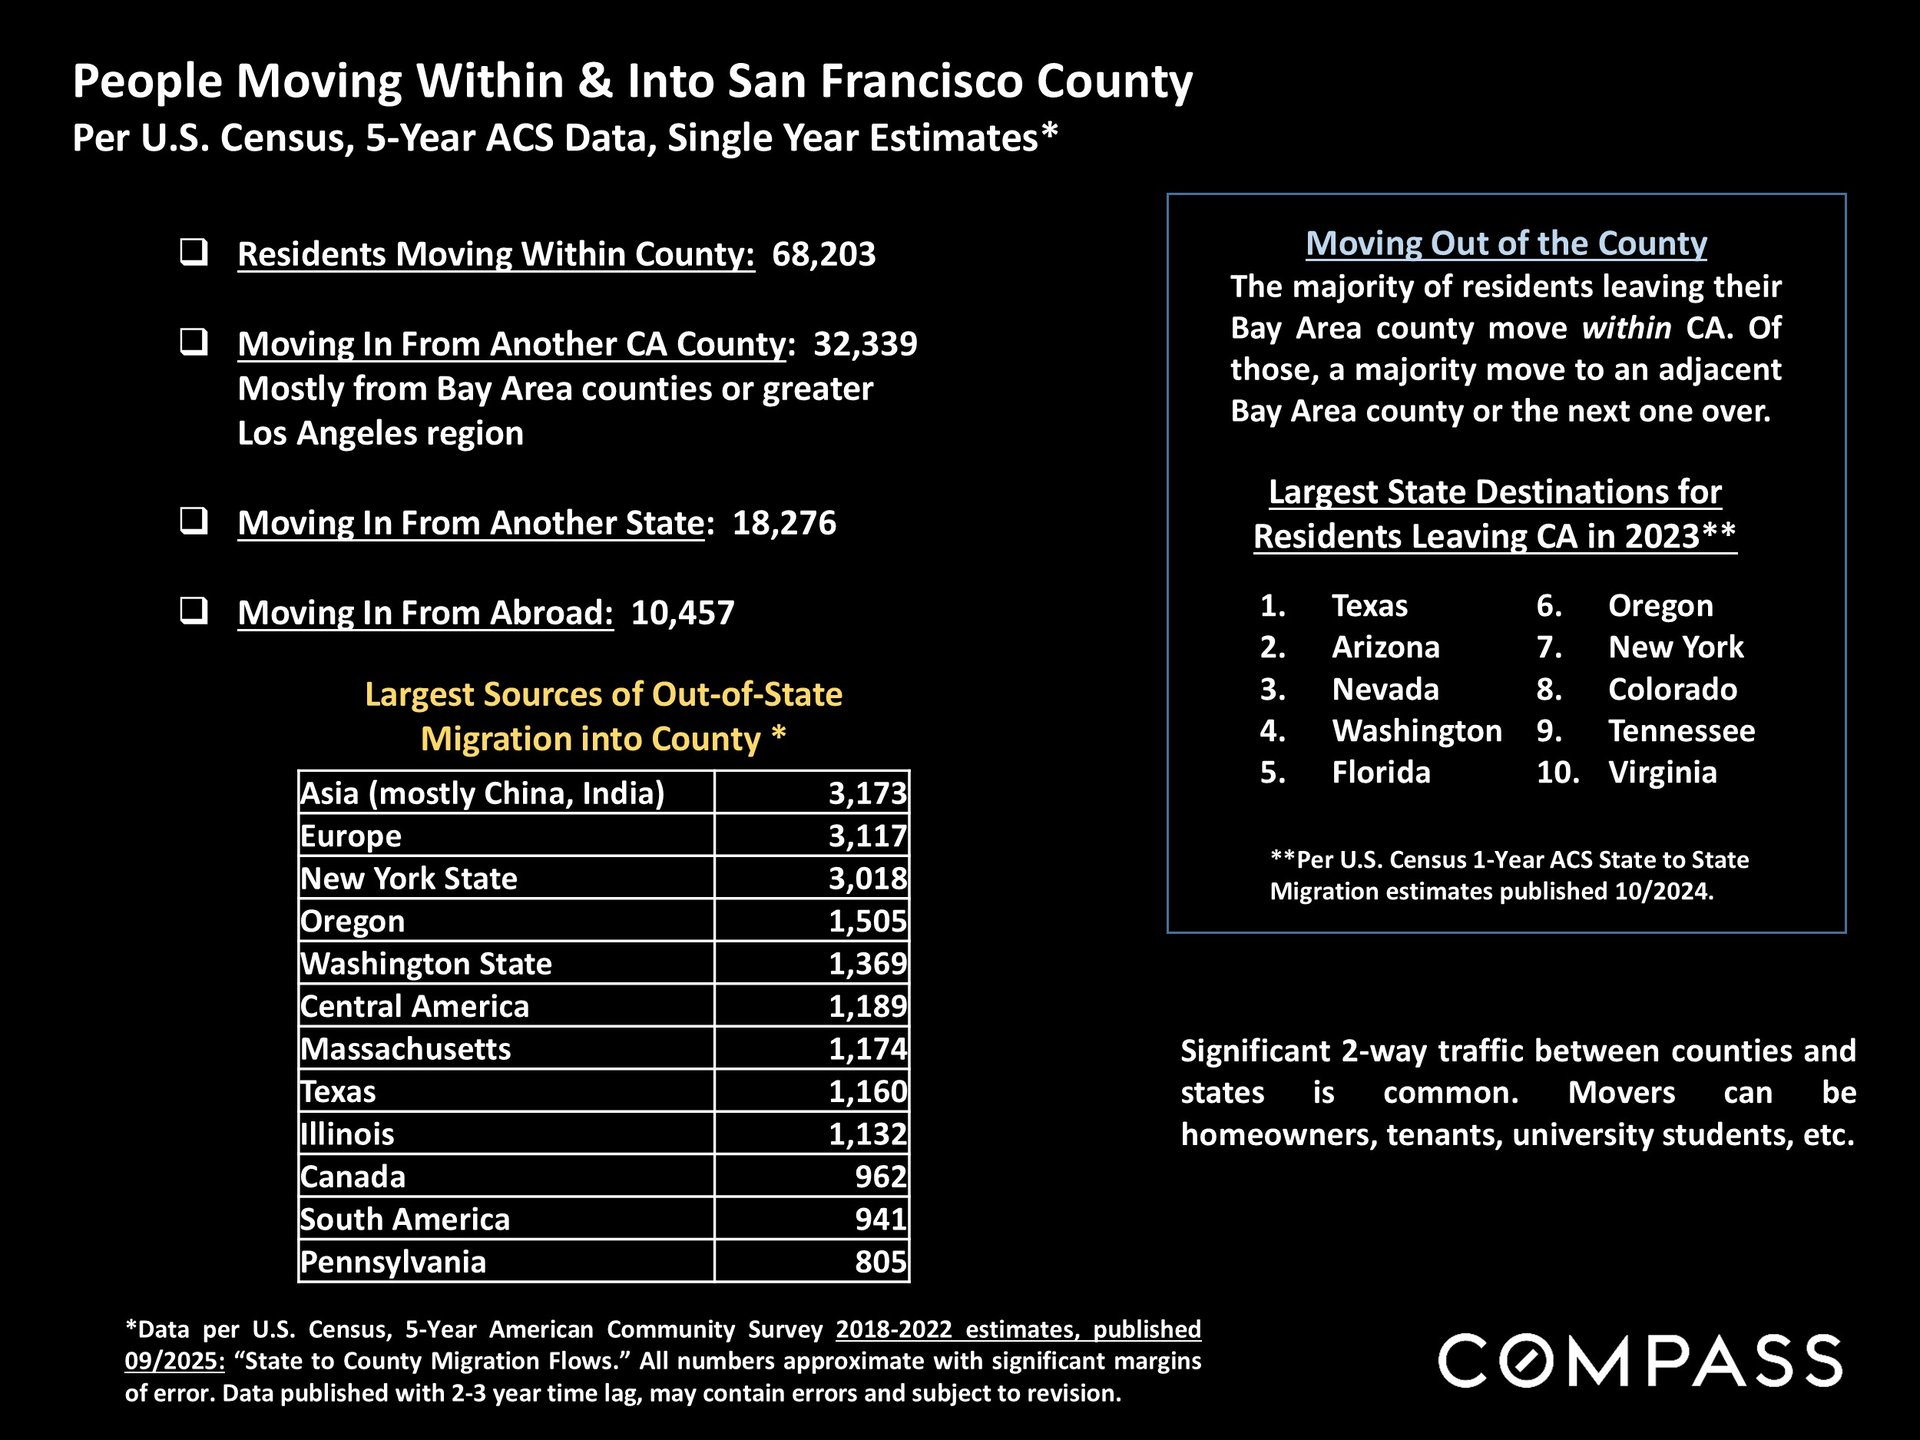
The Census just released new data on state to county migration trends. Unfortunately, the data is always 2-3 years old, and very approximate. By far the largest group of buyers come from within each county; then the next largest group comes from other CA counties, most often adjacent counties (or LA region); then a much smaller group (typically 10% to 15% of buyers) comes from the other 49 states; and finally international buyers. (The situation with foreign buyers may shift dramatically with new immigration and visa constraints.) Generally speaking, buyers coming from out of state mostly come from big eastern/midwestern urban areas (NY, Chicago, Boston), other big high-tech centers (Texas, Washington), or adjacent states (Oregon, Nevada). (Florida and southeast states sometimes rank relatively high as well.)
This analysis and data were compiled by our friend Patrick Carlisle at Compass.
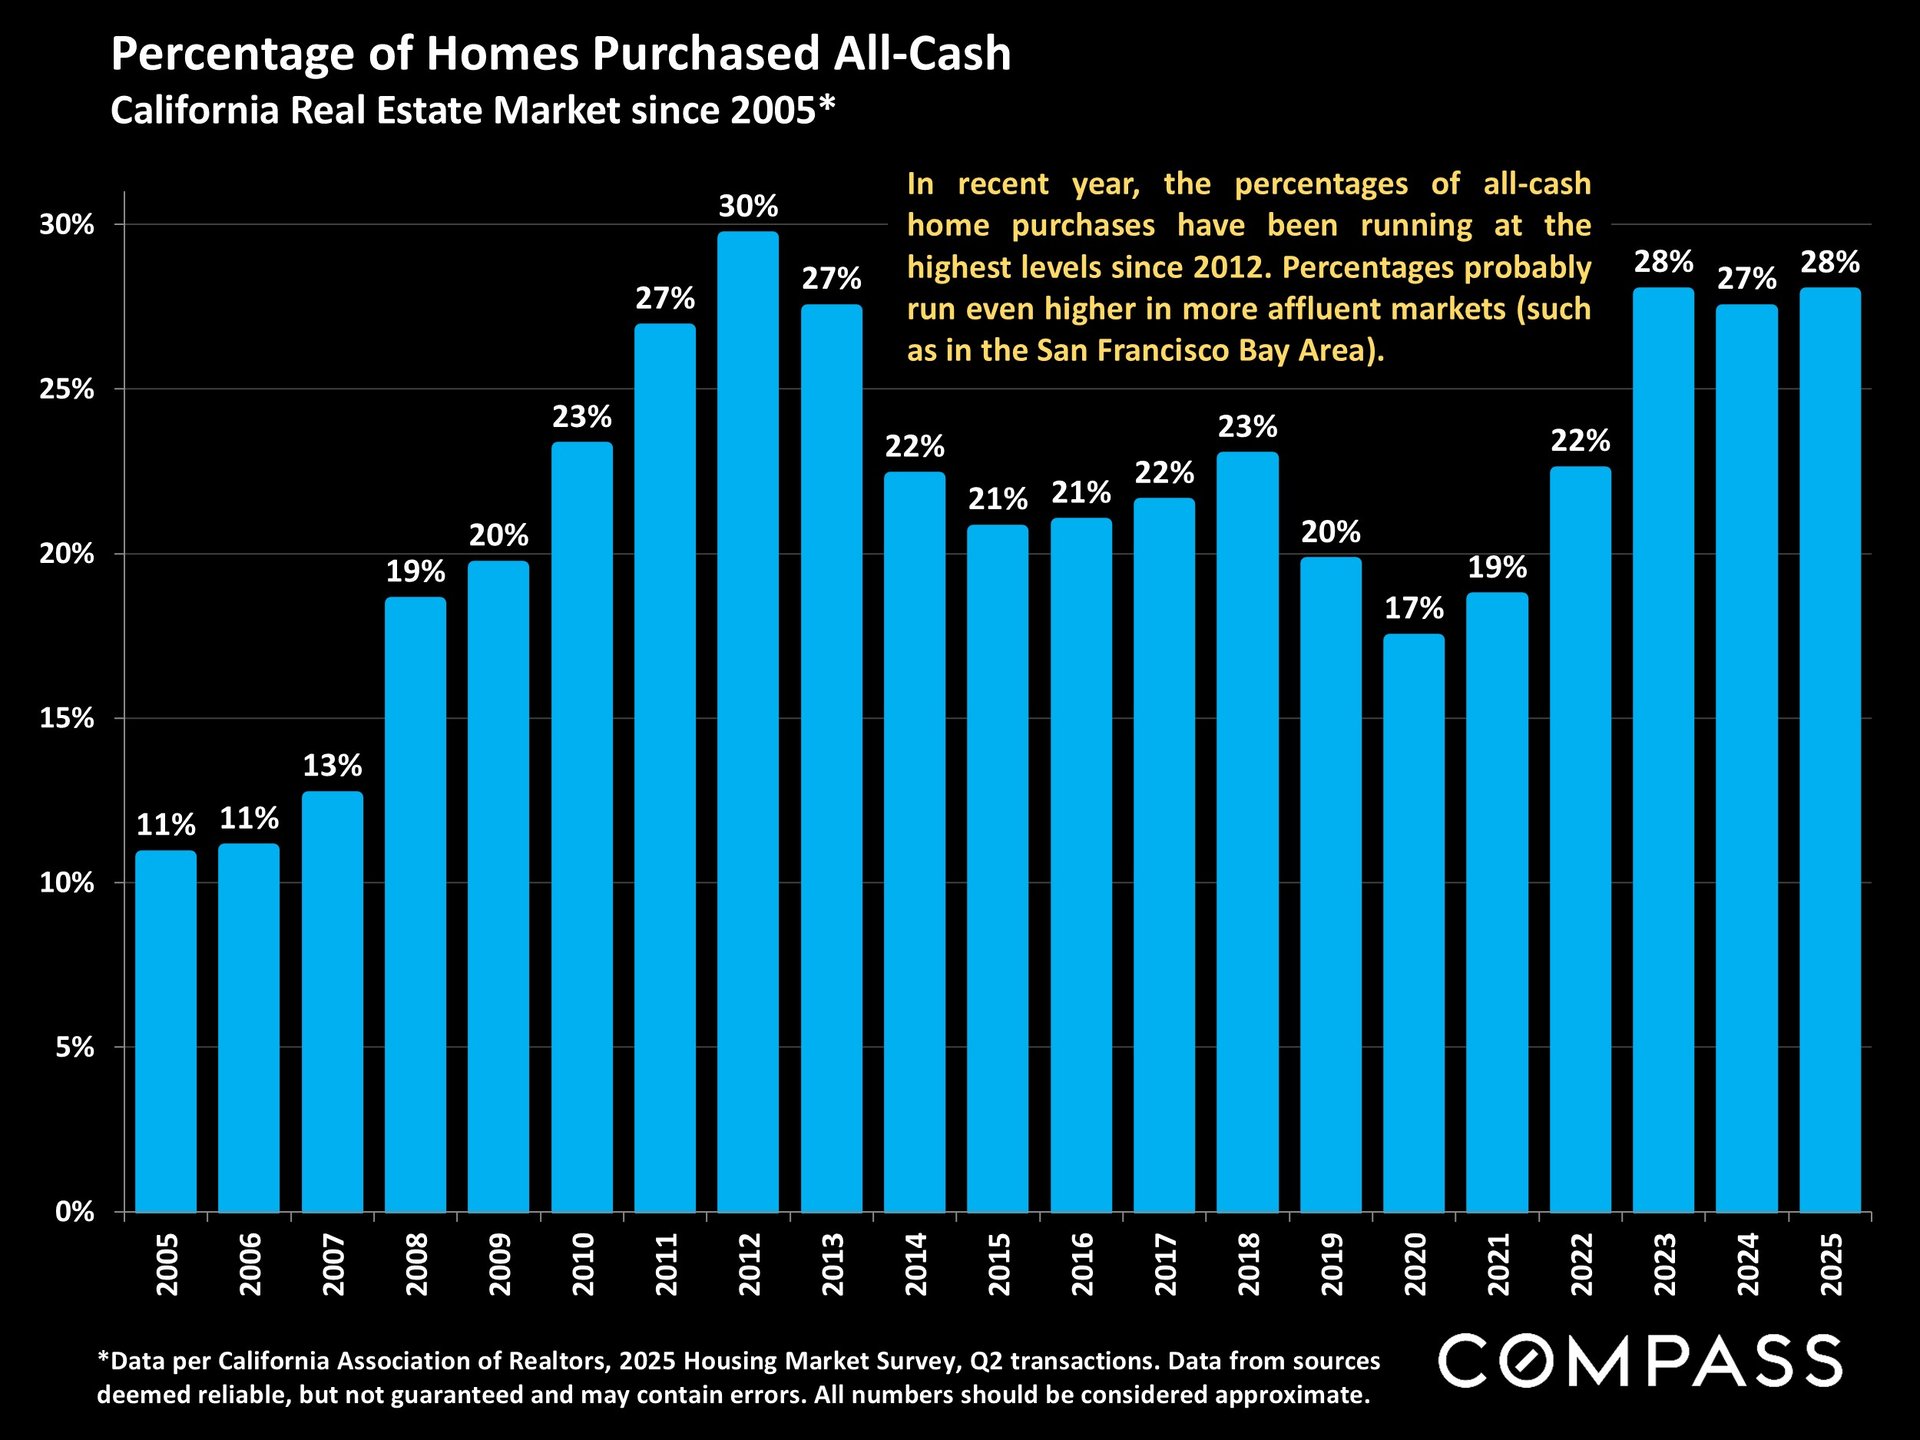
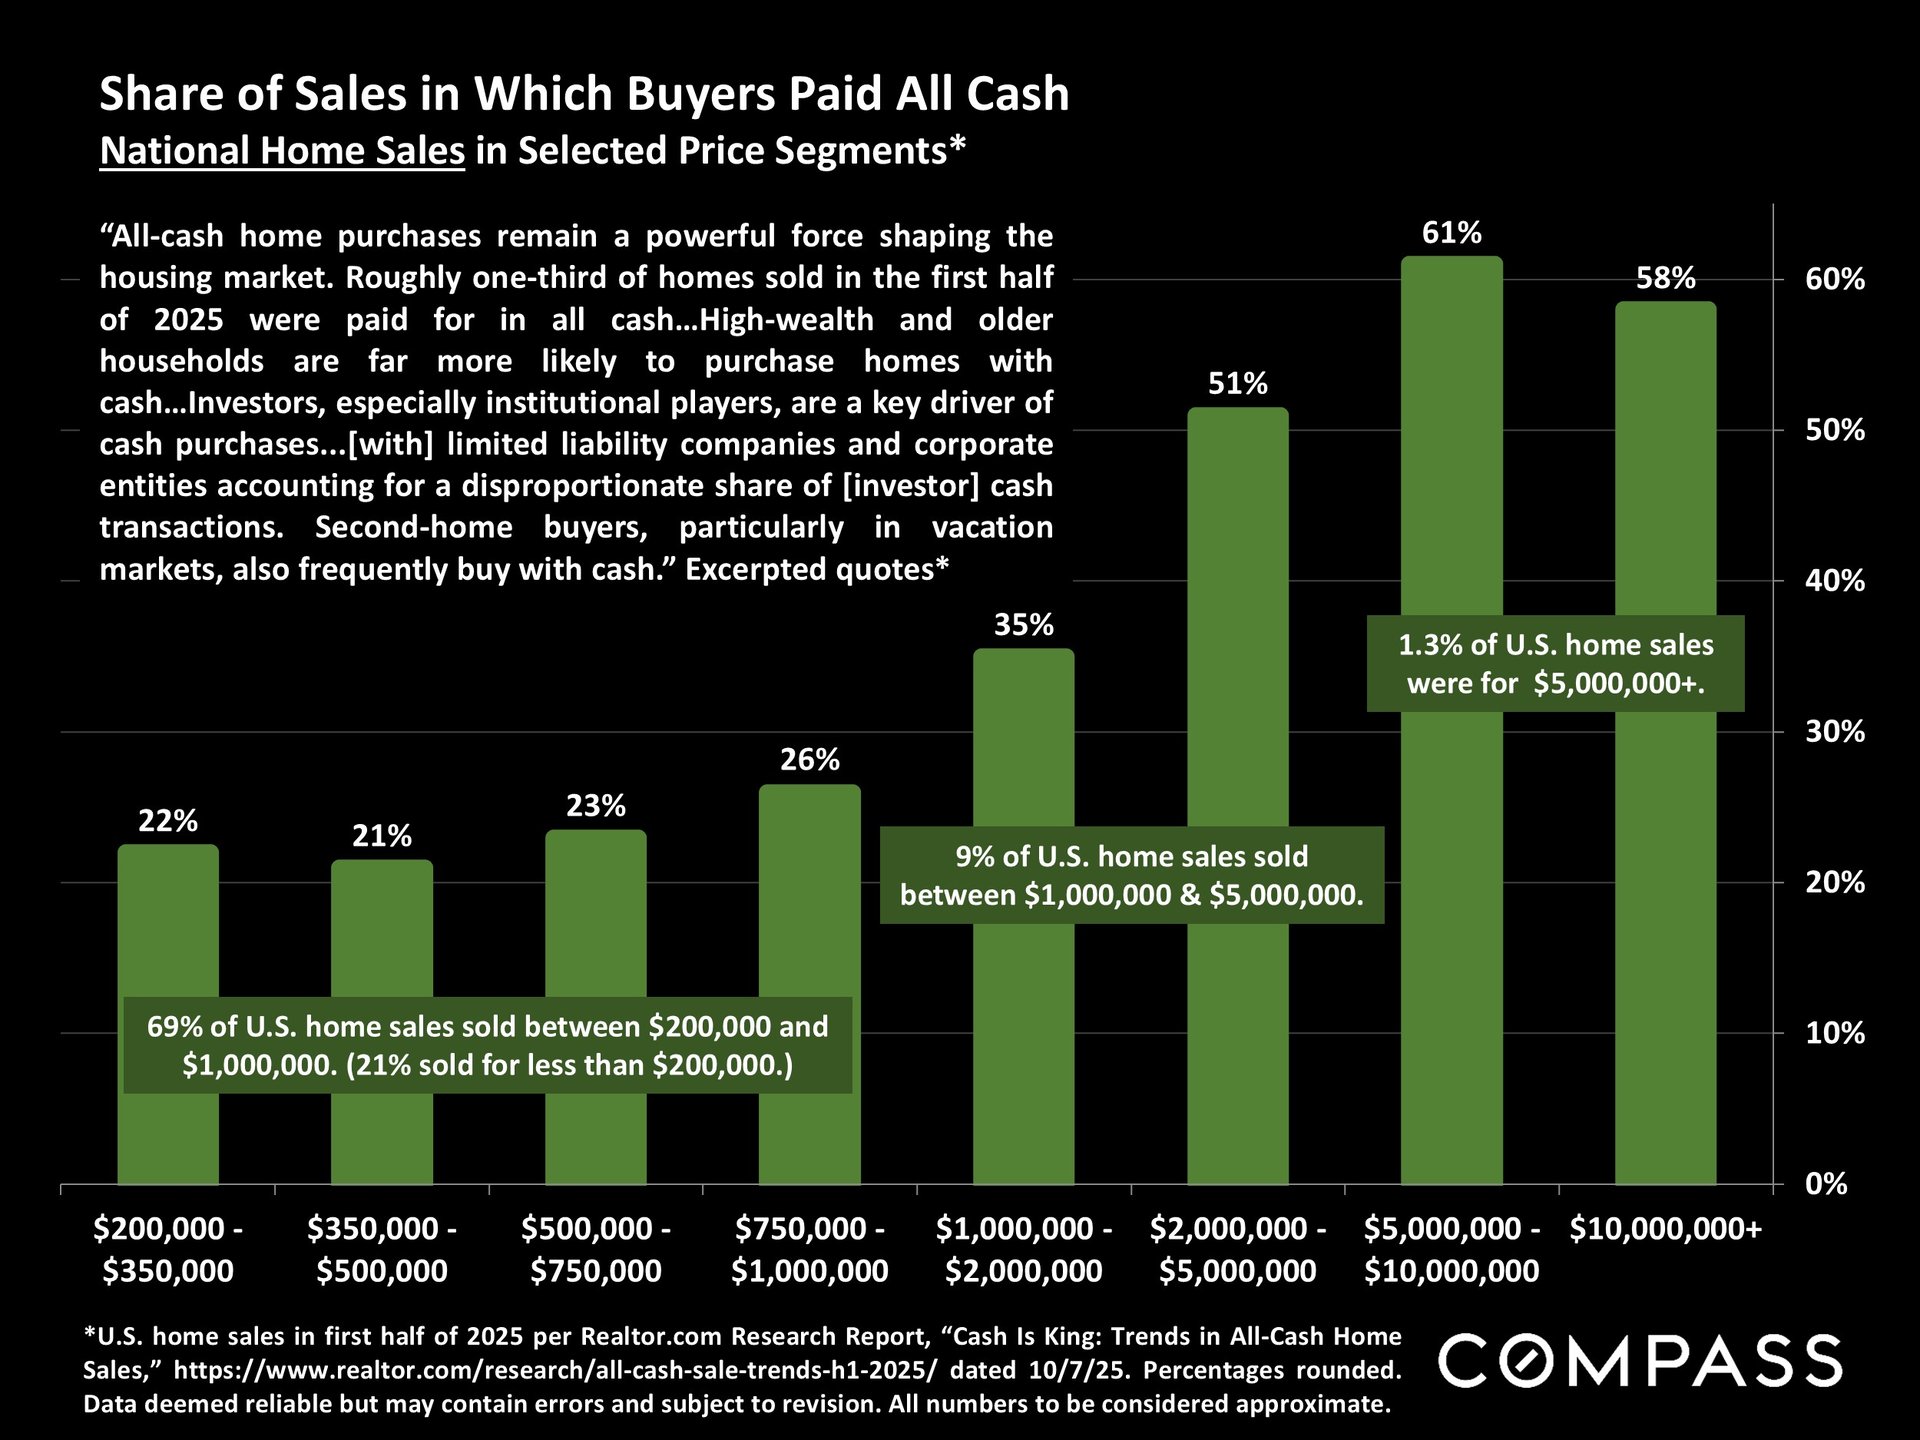
A couple charts on CA and U.S. all-cash purchases.
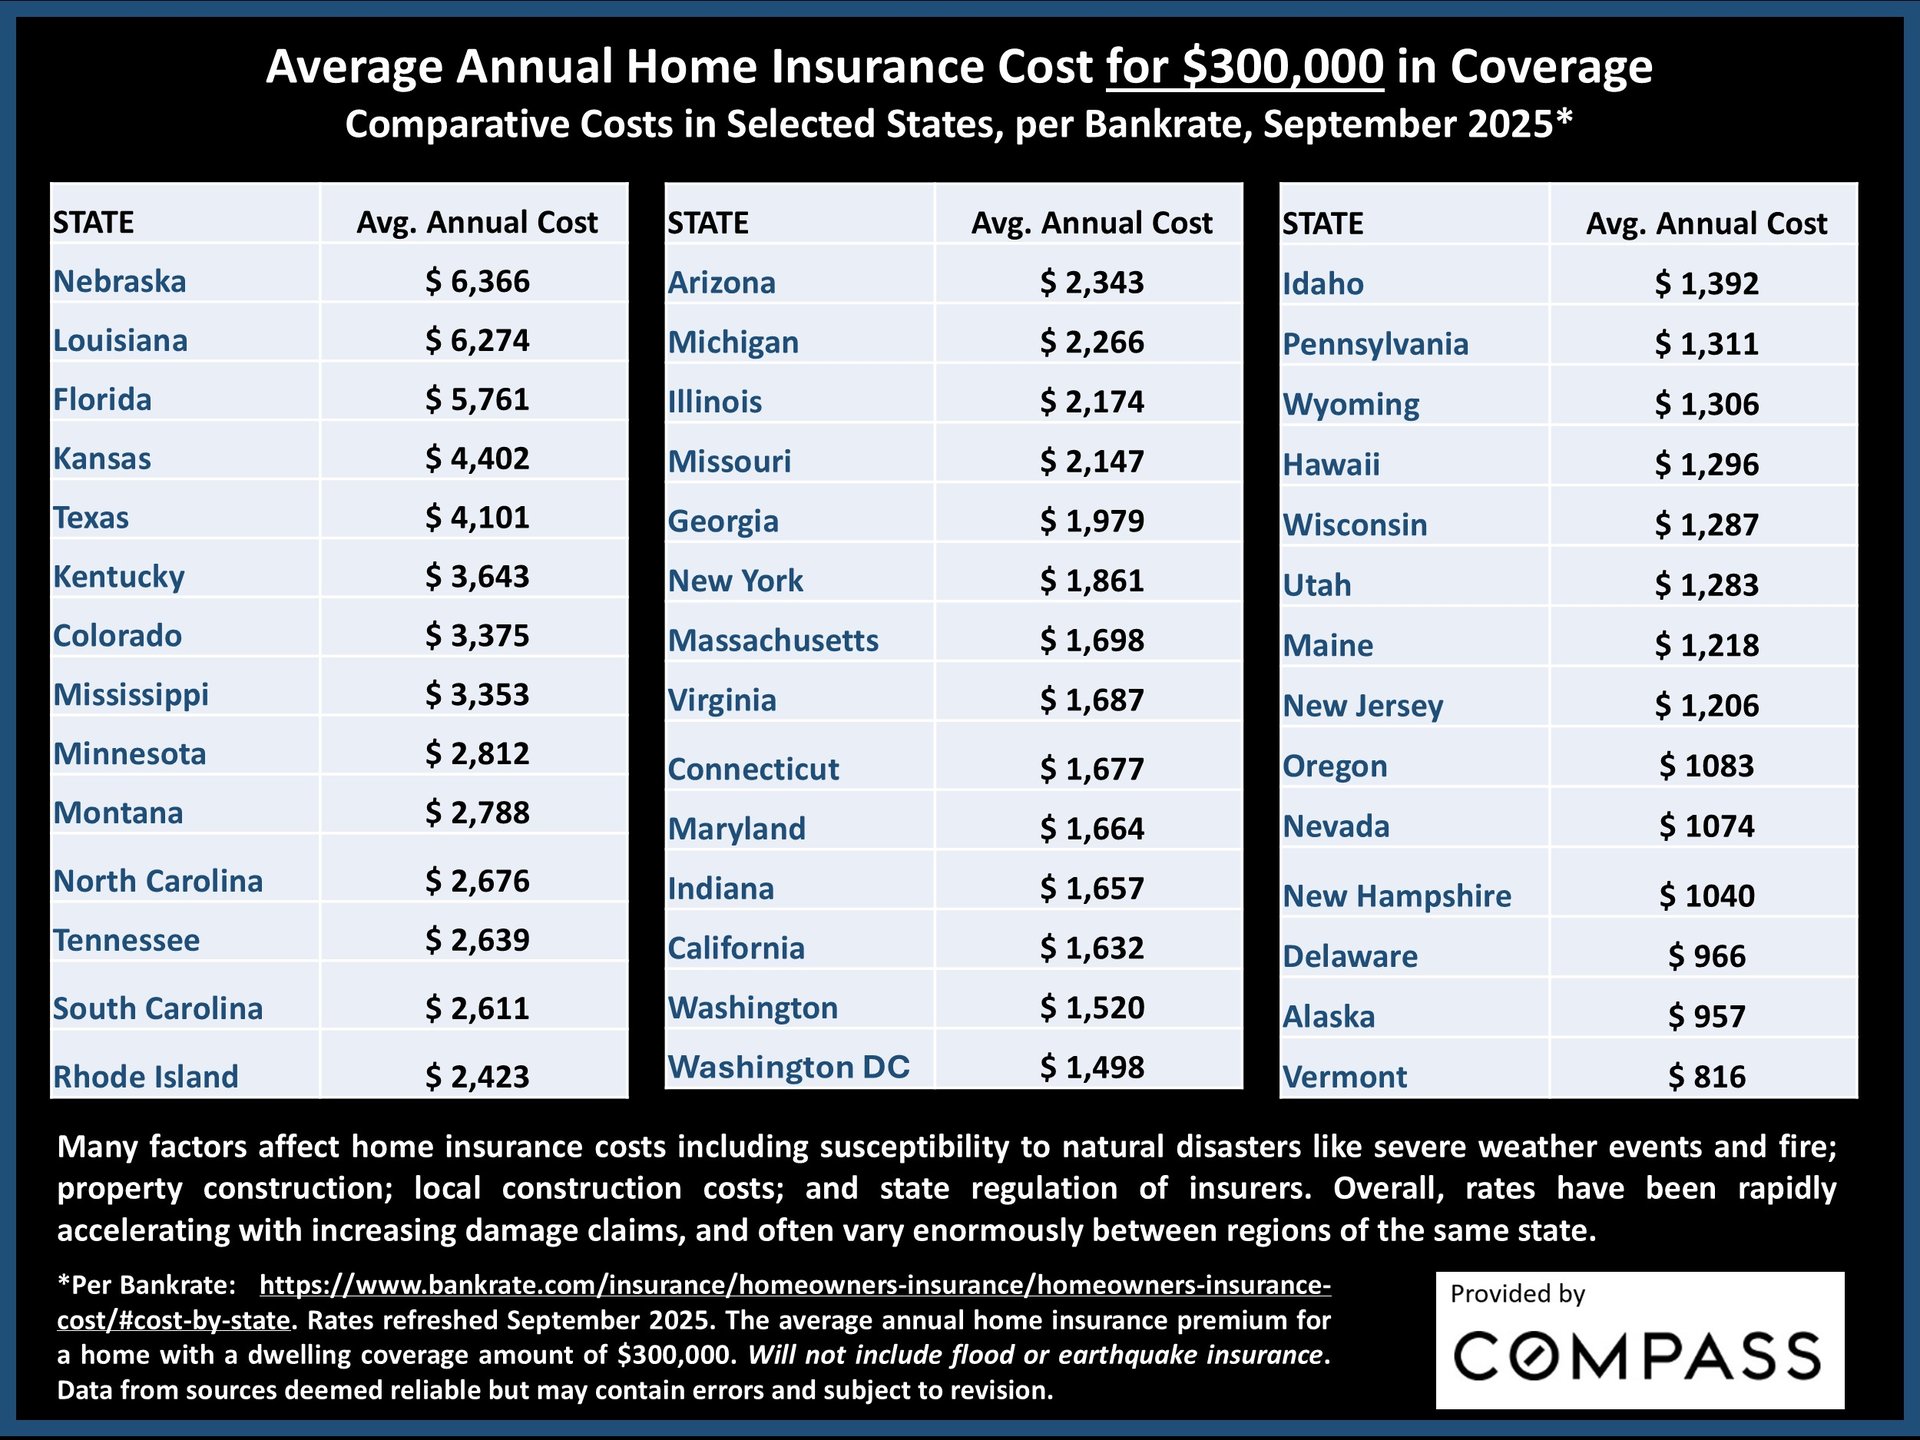
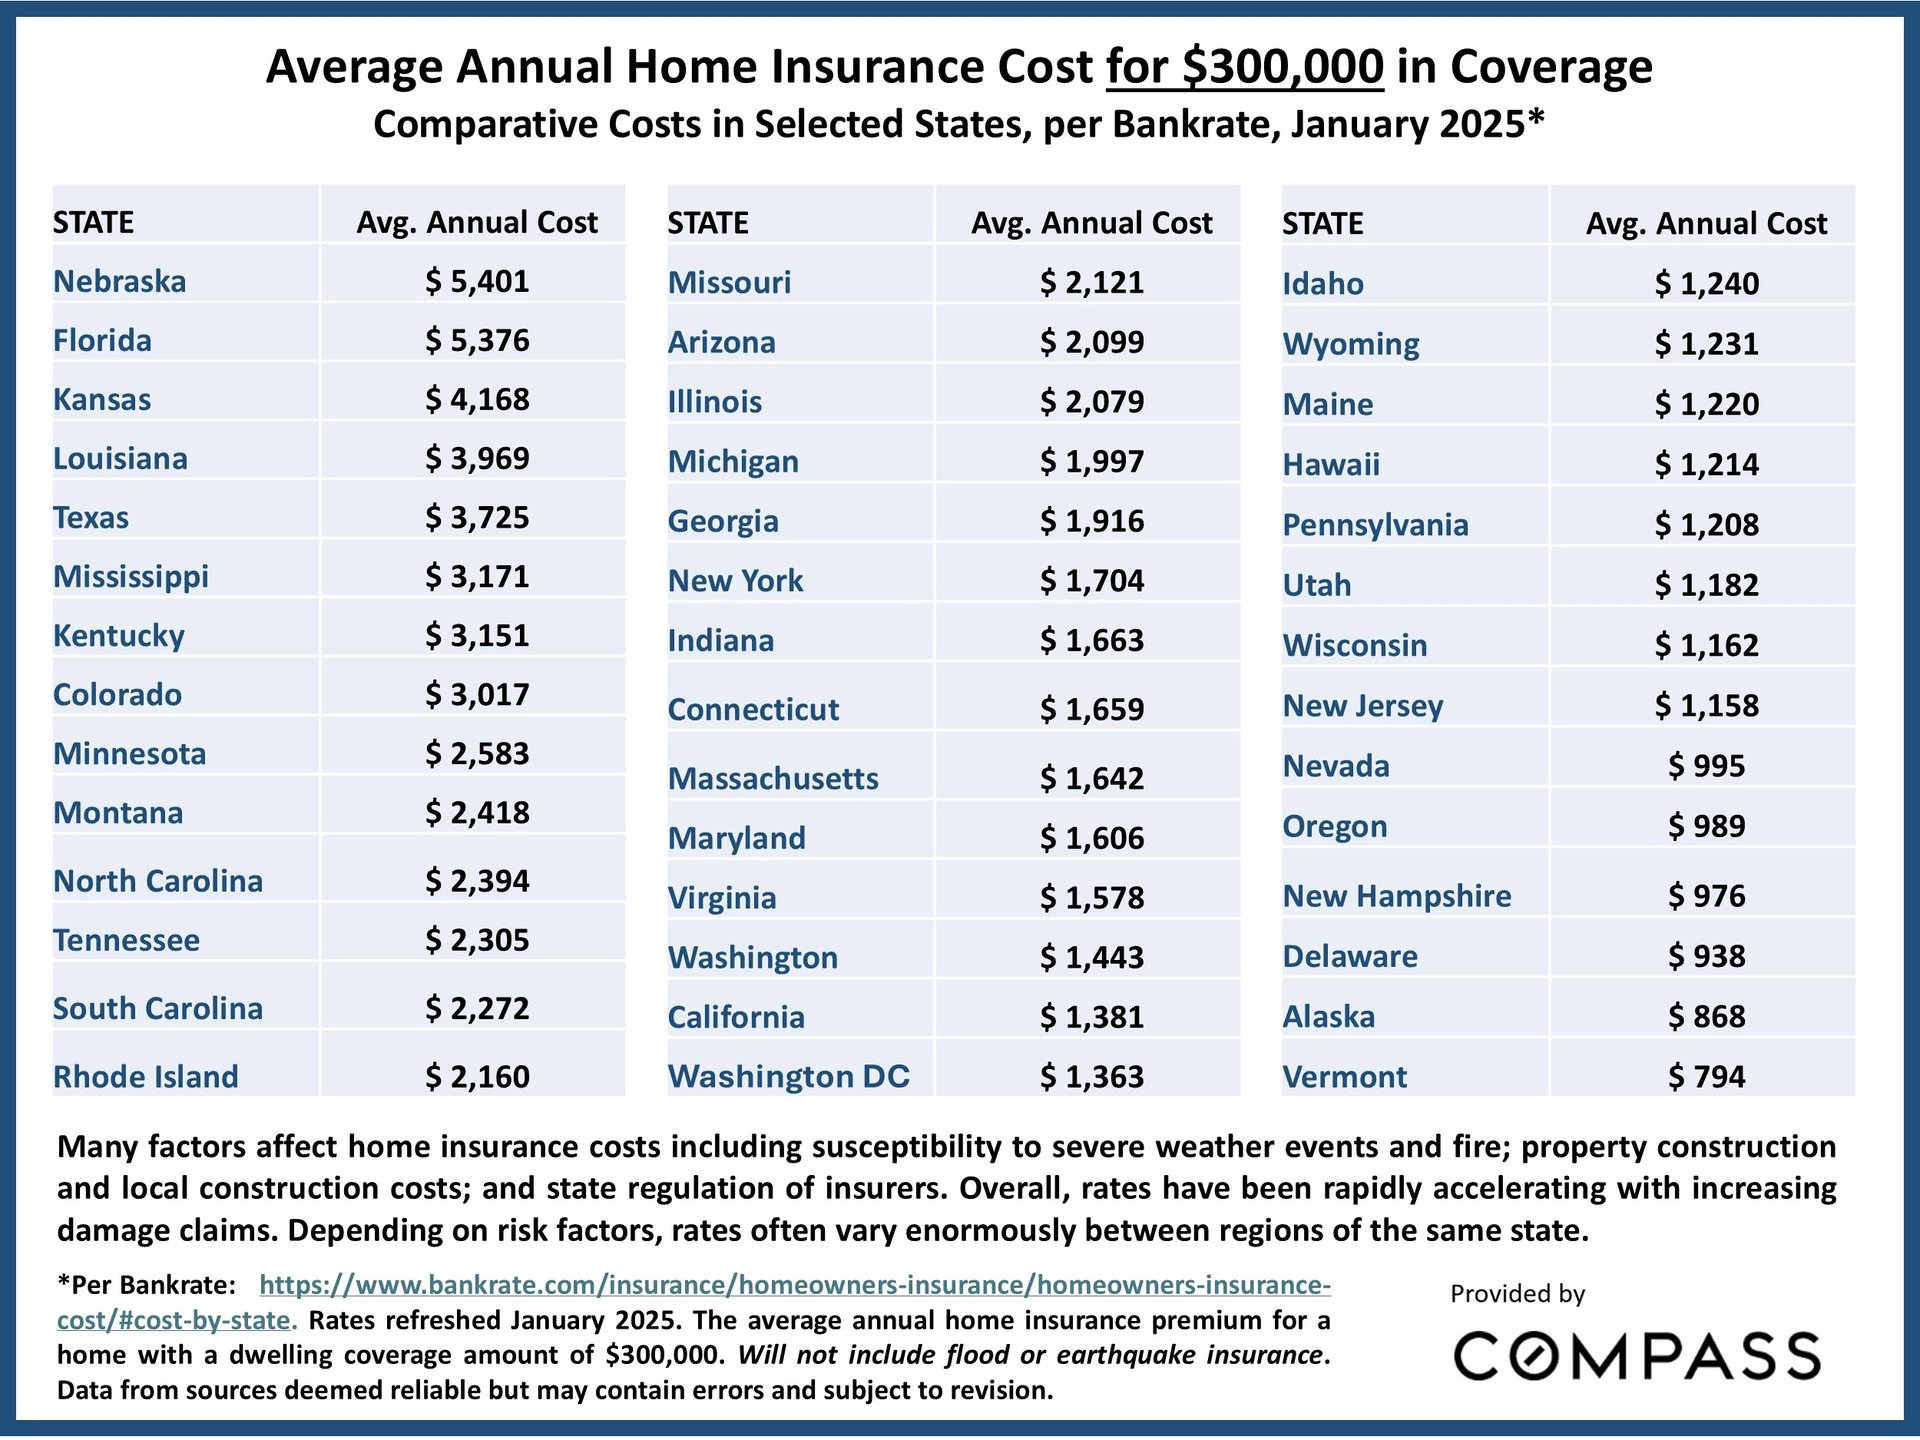
Average insurance rates per $300,000 of coverage by state. And, in the 2 charts below, comparing September 2025 with January 2025 rates to illustrate the often substantial increases that occurred over the 8-month period. According to this source, the average CA rate rose 18% since January, though it remains far below the average rates of many other states.