
The Lurie Group
San Francisco at night with Bay Bridge lights and red vehicle trails on a curving road.

Q3 Market Insights: Owners, Renters, Prices, Trends & Seasonality

  • Alexander Lurie
  • November 16, 2024

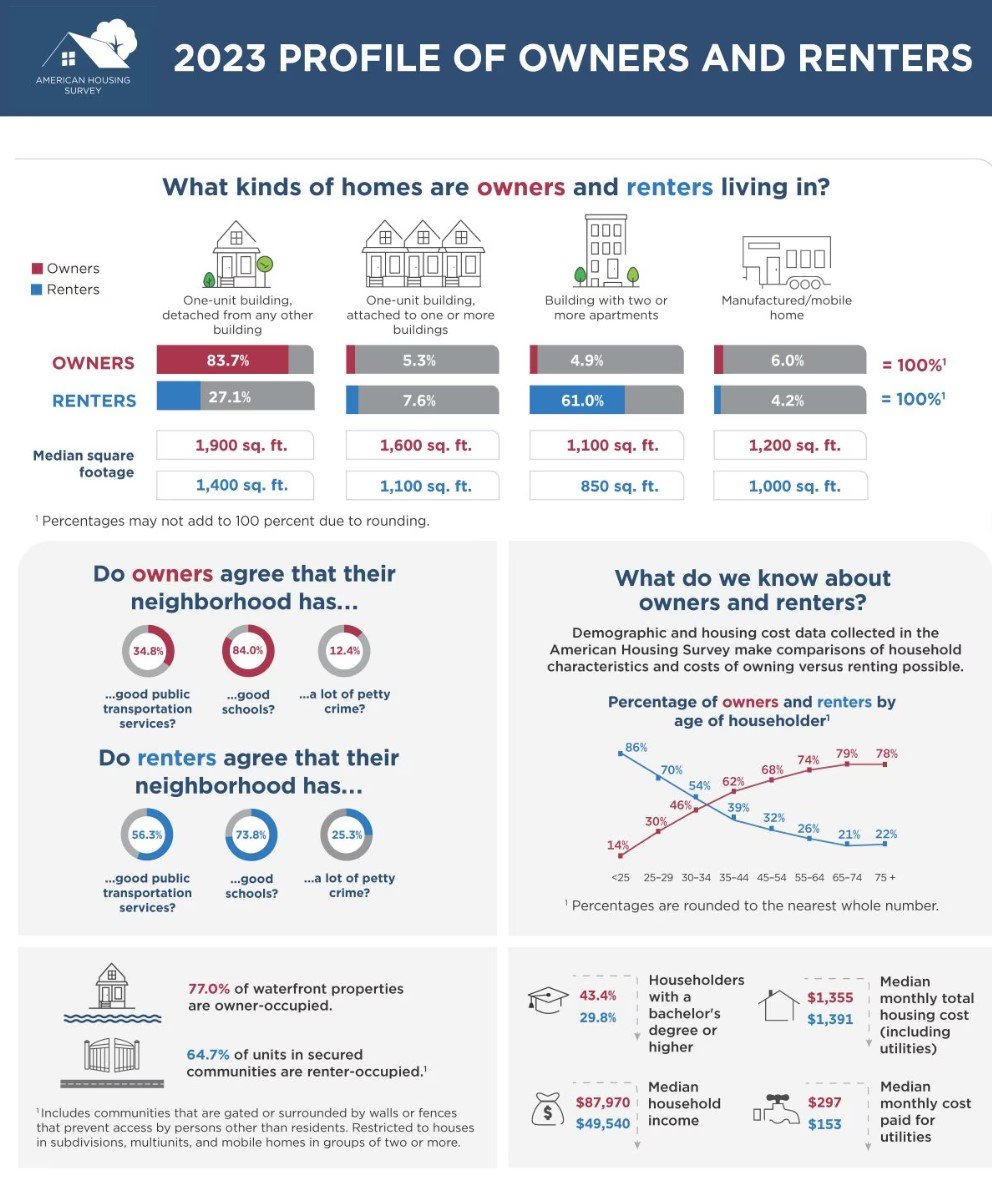
The latest Profile of Owners & Renters was published by the Census on 10/30/24: It compares a variety of factors - such as income, age, education - pertaining to owners and renters. 

Infographic comparing homeowners and renters by housing type, neighborhood, age, occupancy, education, income, and costs.

https://www.census.gov/library/visualizations/2024/demo/owners-and-renters.html

NAR updated their quarterly metro-area price data:  87% of metro markets registered year-over-year home price gains in Q3 2024, as the 30-year fixed mortgage rate ranged from 6.08% to 6.95%. Note that "metro areas" typically cover much larger areas than just the cities they're named for. For example, the San Francisco metro area covers 5 counties (SF, Marin, San Mateo, Alameda, Contra Costa). However, the San Jose metro area is 99% composed of Santa Clara County, the county market in the U.S. seeing the biggest impact from the AI boom.
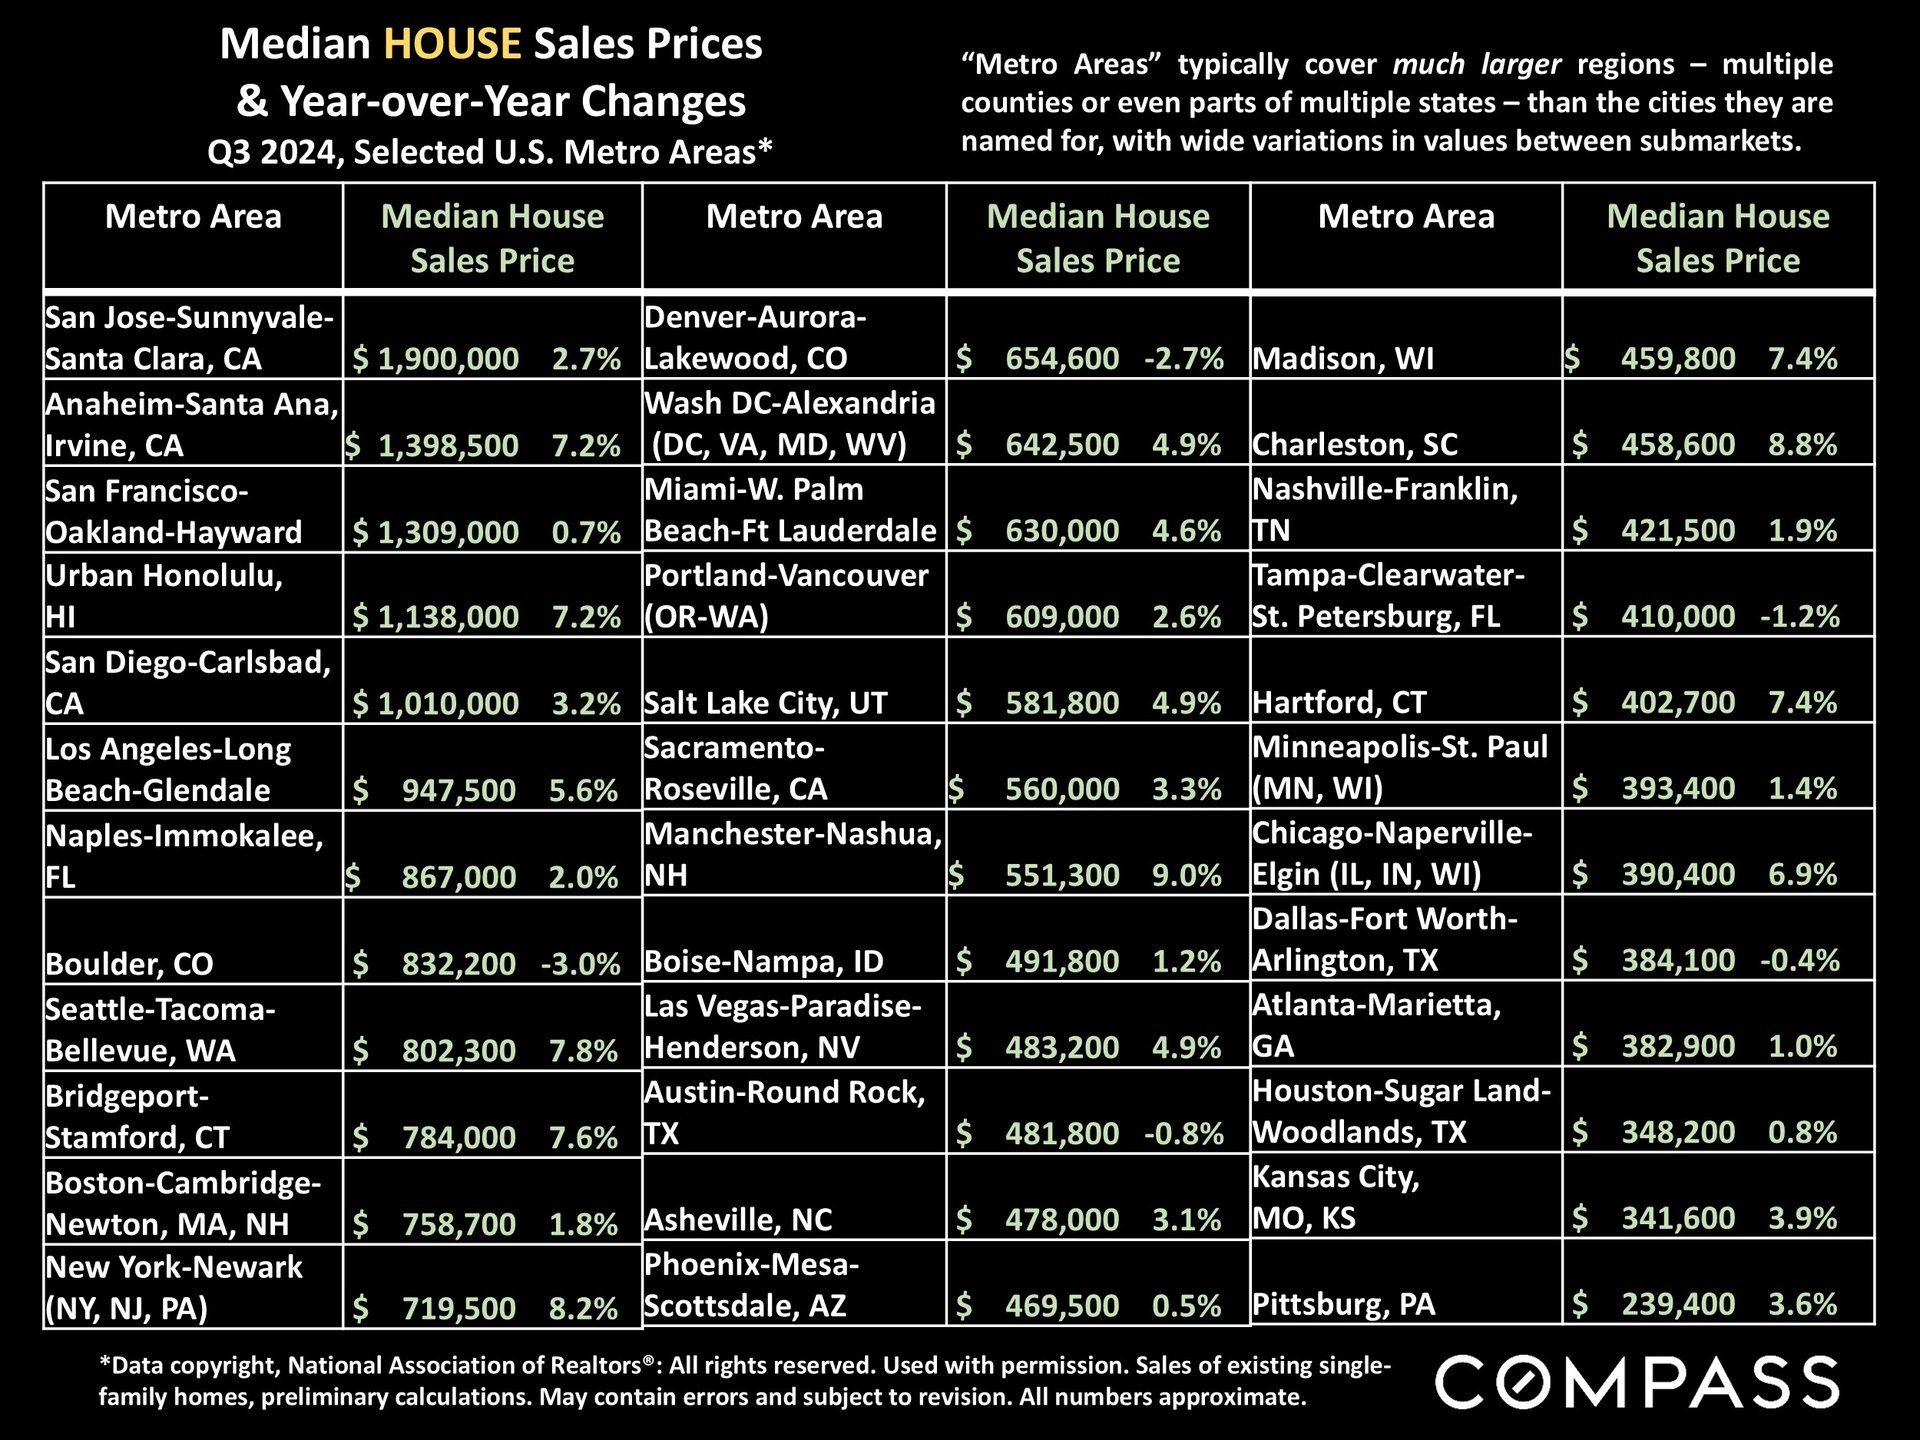
Q3 2024 table of median house prices and year-over-year changes for selected U.S. metro areas.

Complete NAR metro-area Q3 price list:  https://drive.google.com/file/d/1MnxbwCAwo6IZokSP6znbVNTrgD90_pFD/view?usp=sharing 
 
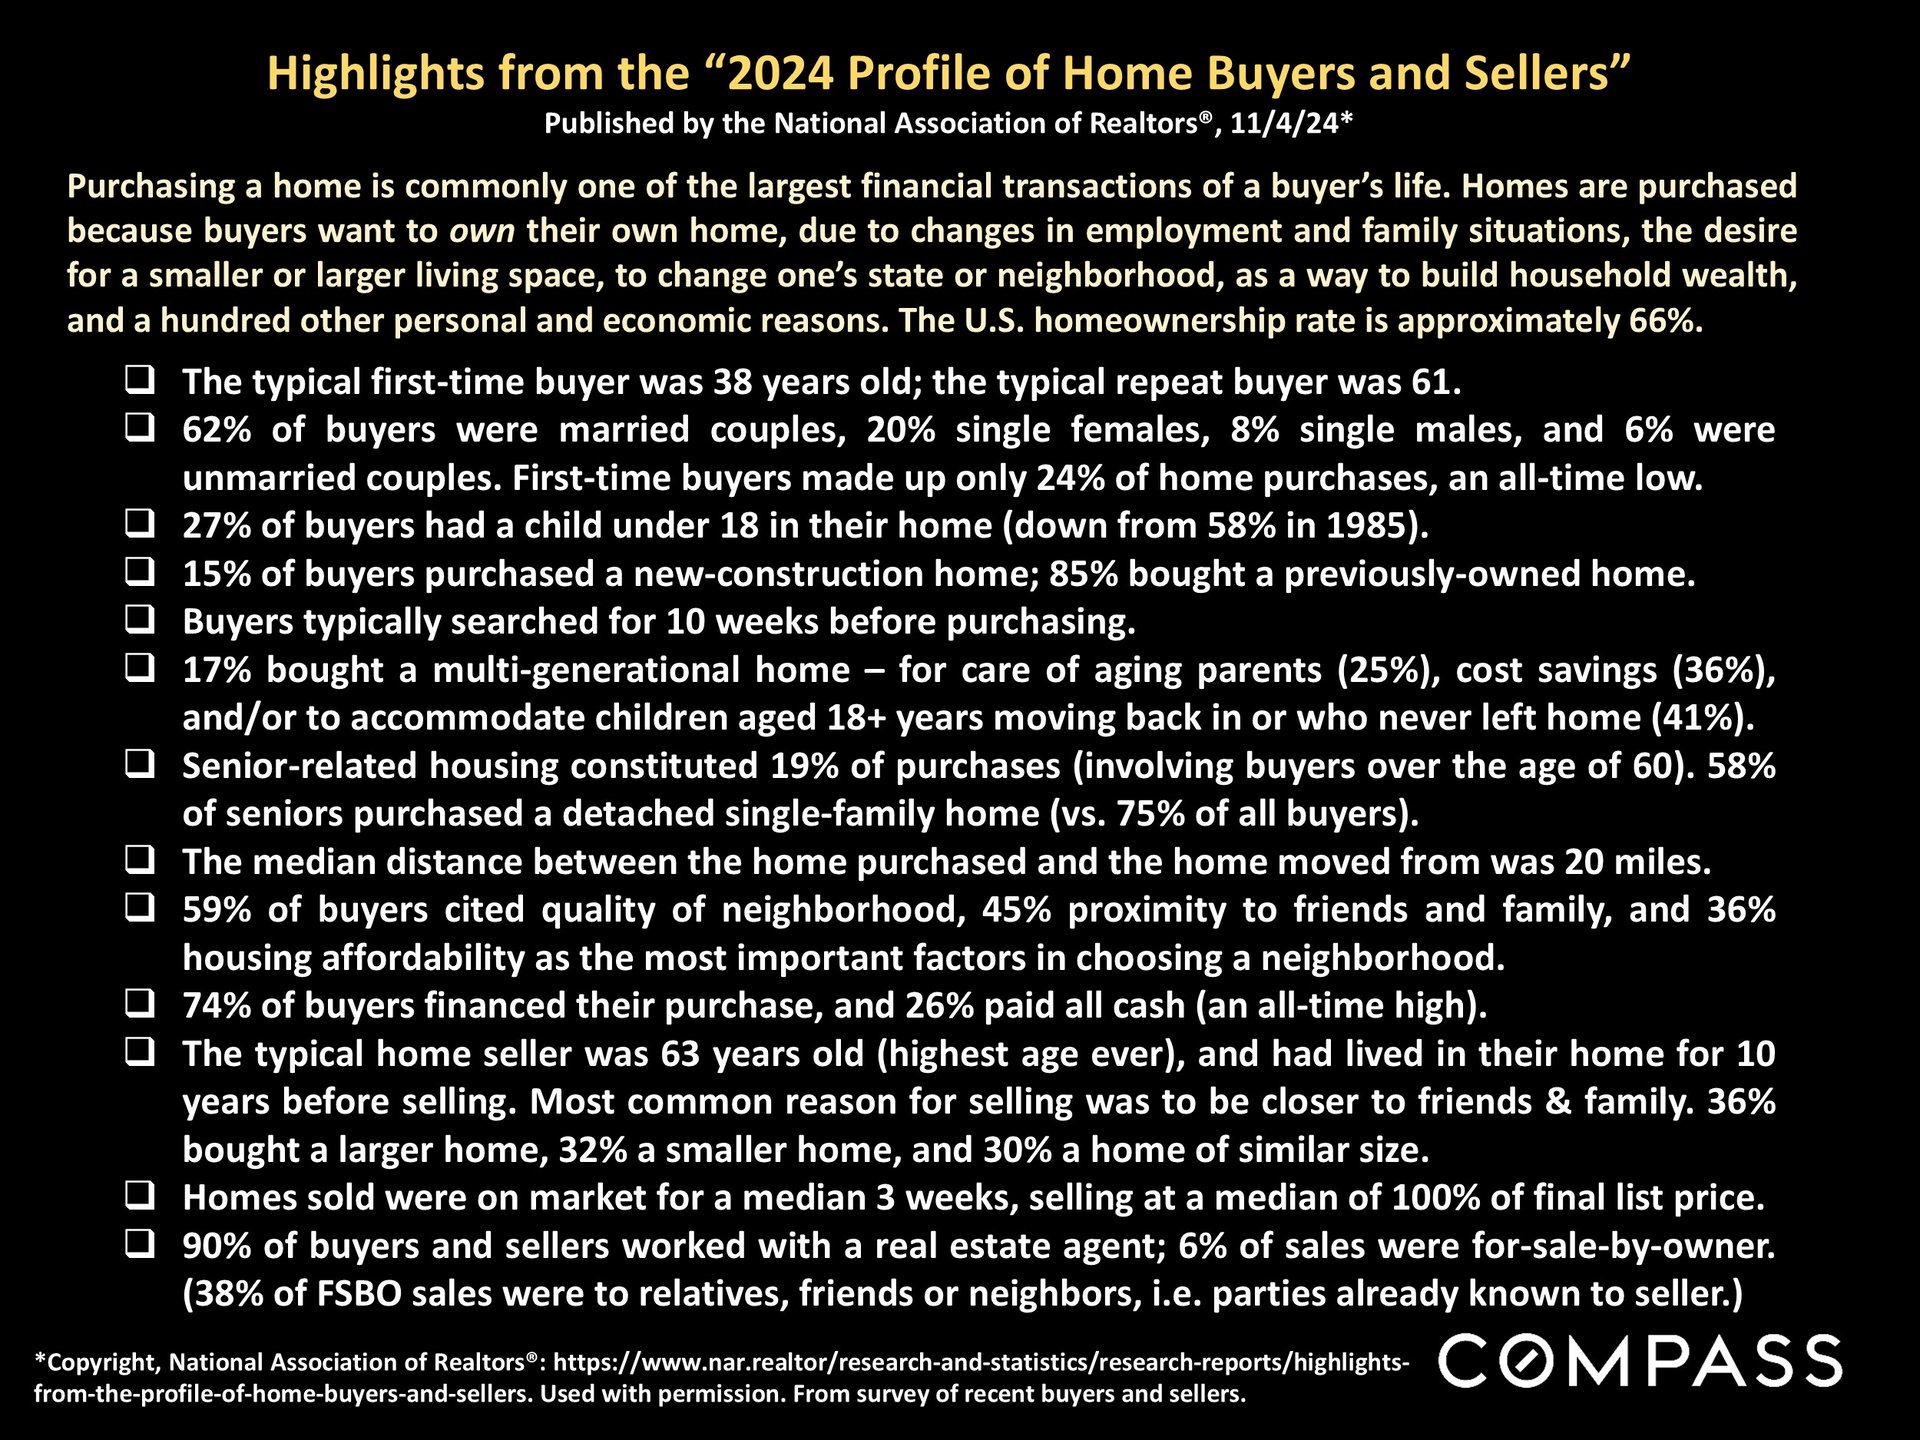
NAR also just issued their "2024 Profile of Home Buyers and Sellers." This slide includes some highlights, and the link following goes to the full news release and report. 

2024 home buyer and seller profile infographic summarizing buyer and seller demographics, purchasing patterns, and housing trends.

 
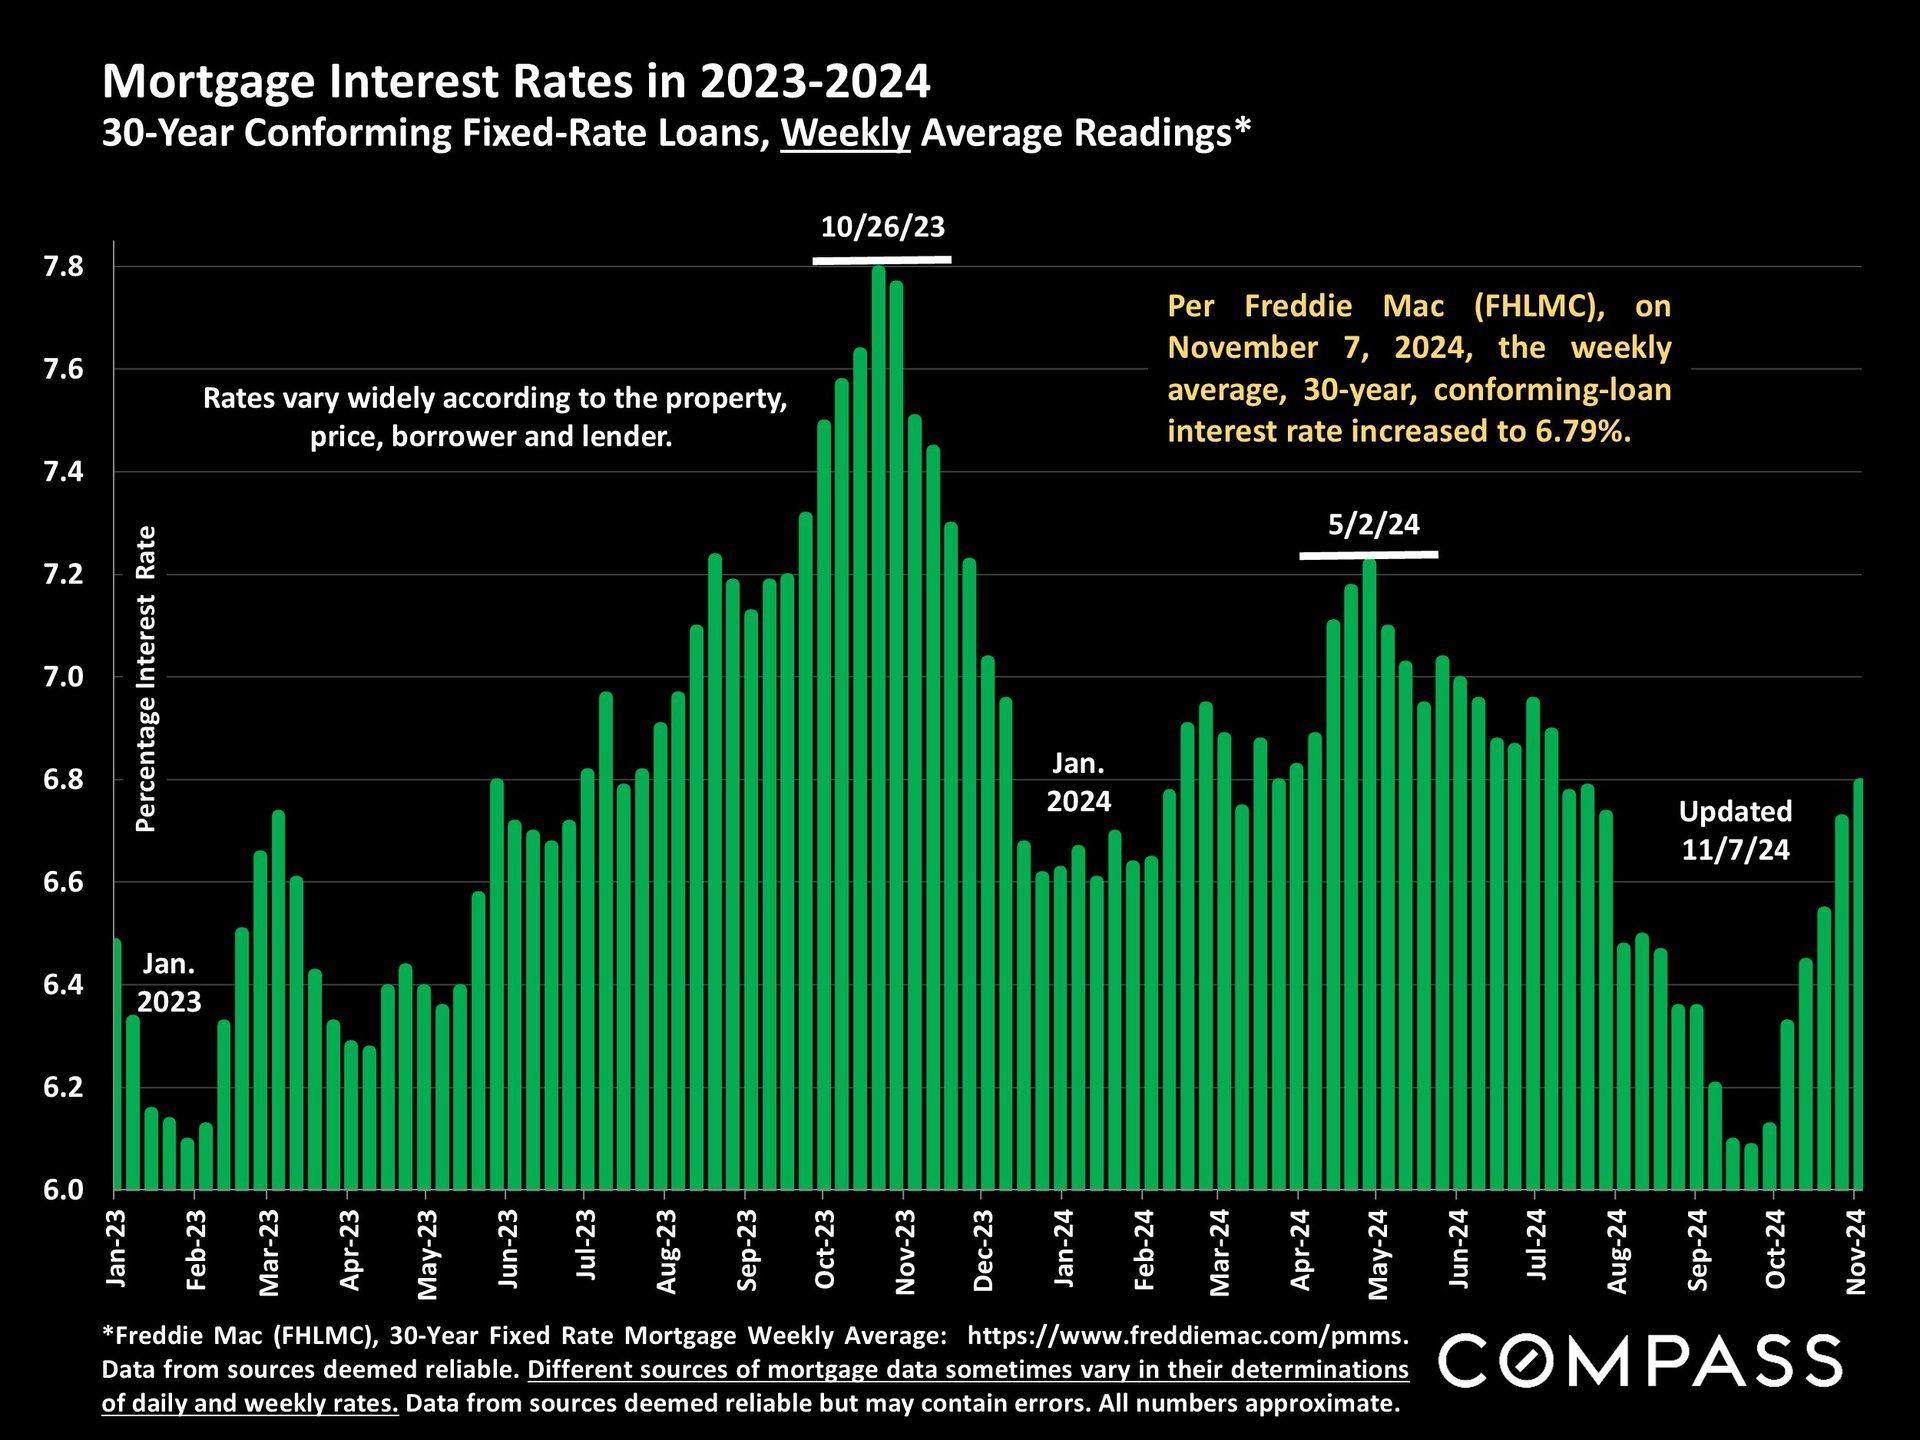
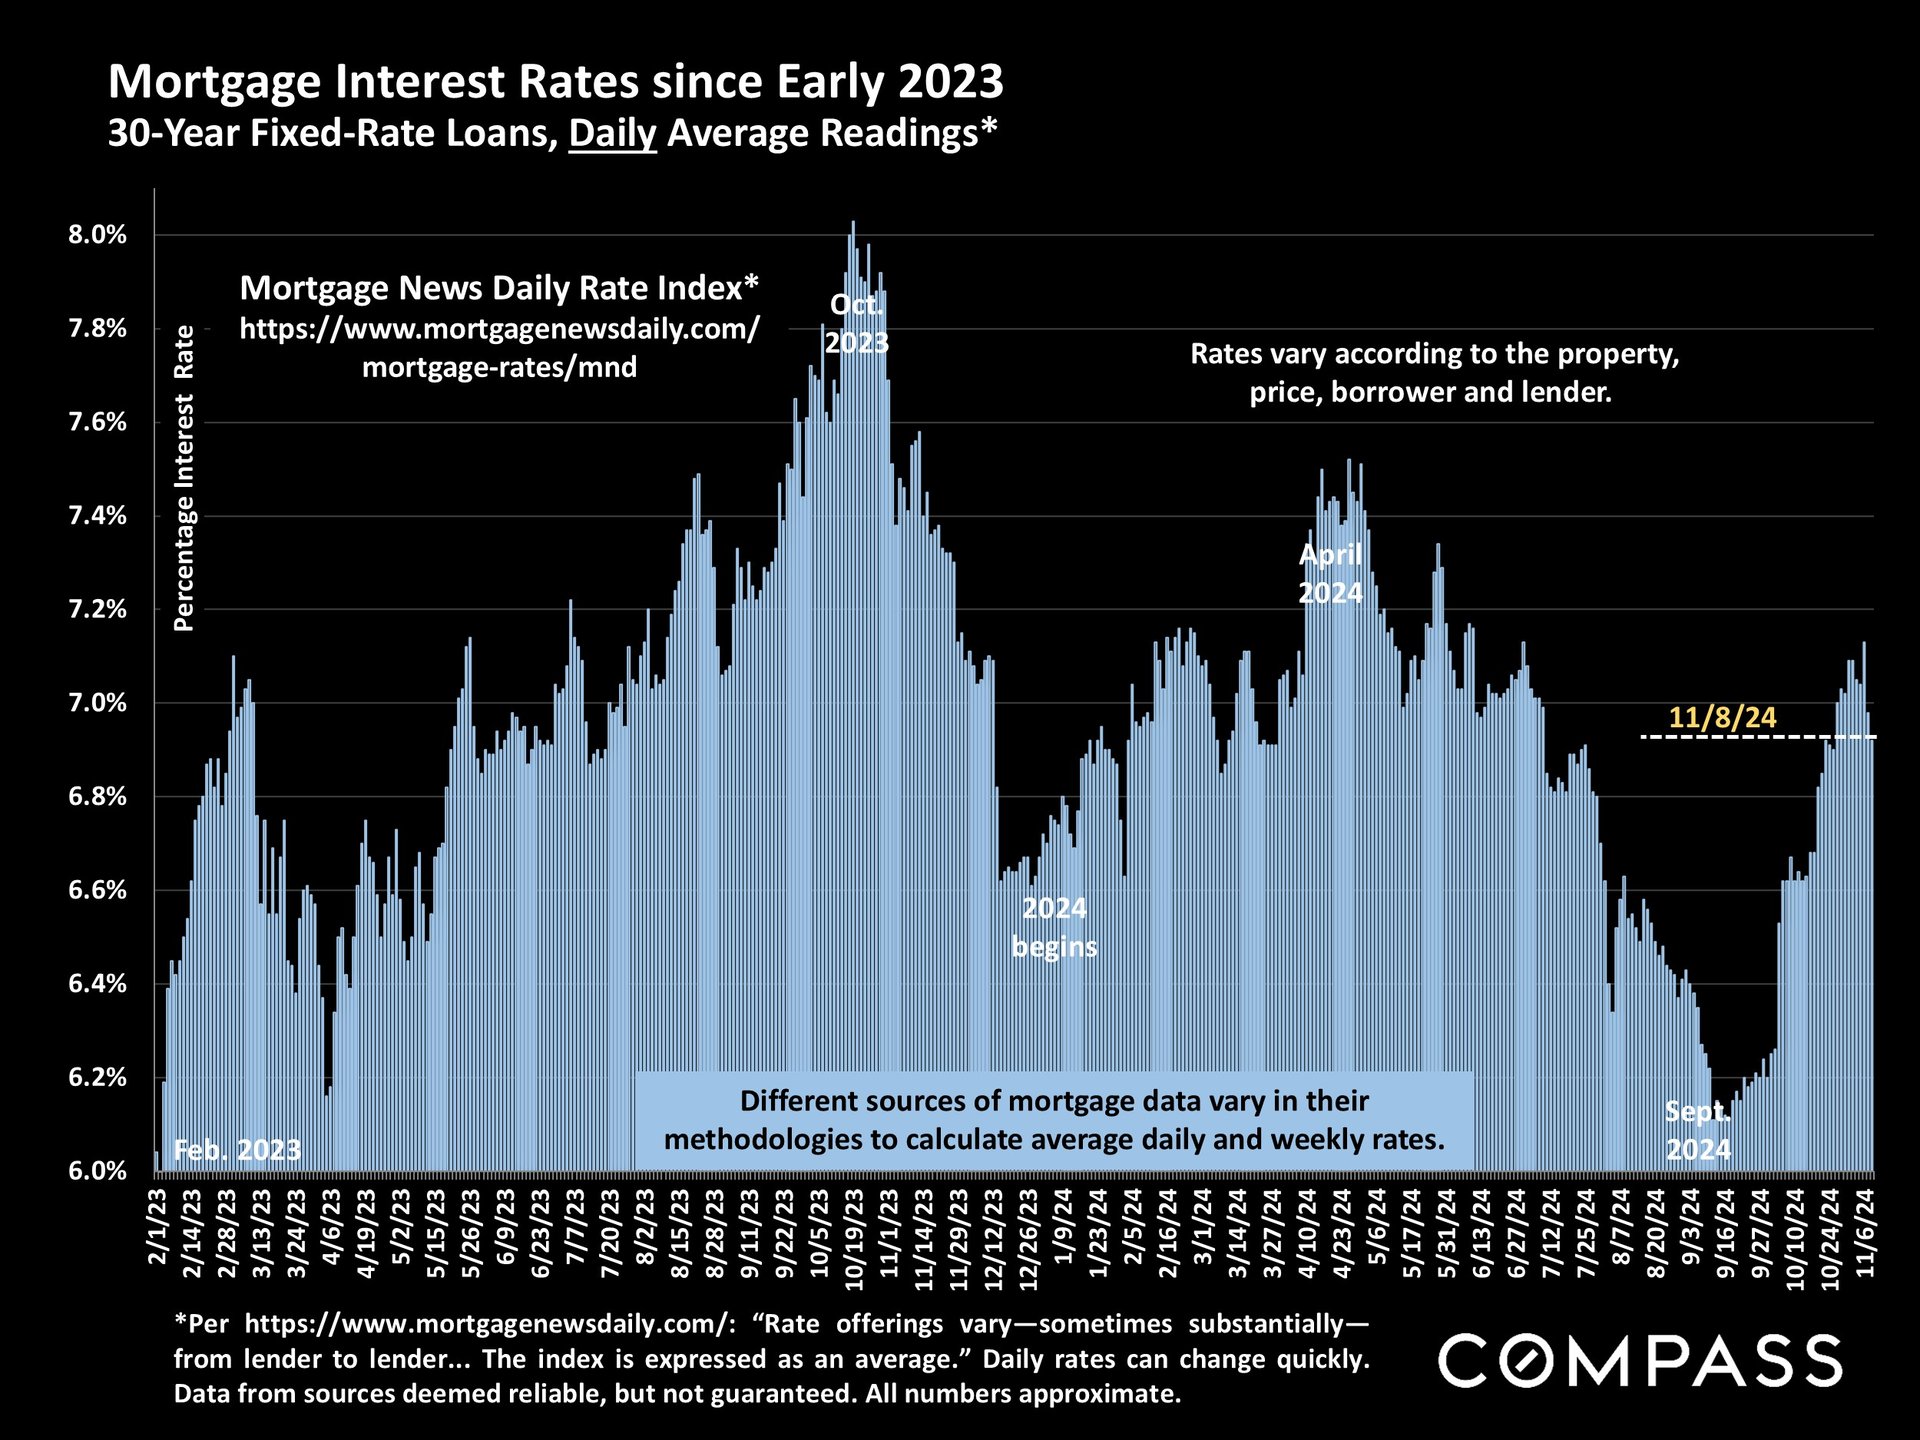
Weekly & Daily Average Interest Rates:  The daily rate has begun to tick down in the last 2 business days, too early to know if it's the beginning of a sustained decline.

Bar chart of weekly 30-year mortgage rates from January 2023 to November 2024, peaking near 7.8% in October 2023.

Chart of daily 30-year mortgage rates, peaking above 8% in October 2023 before falling and rising again in late 2024.

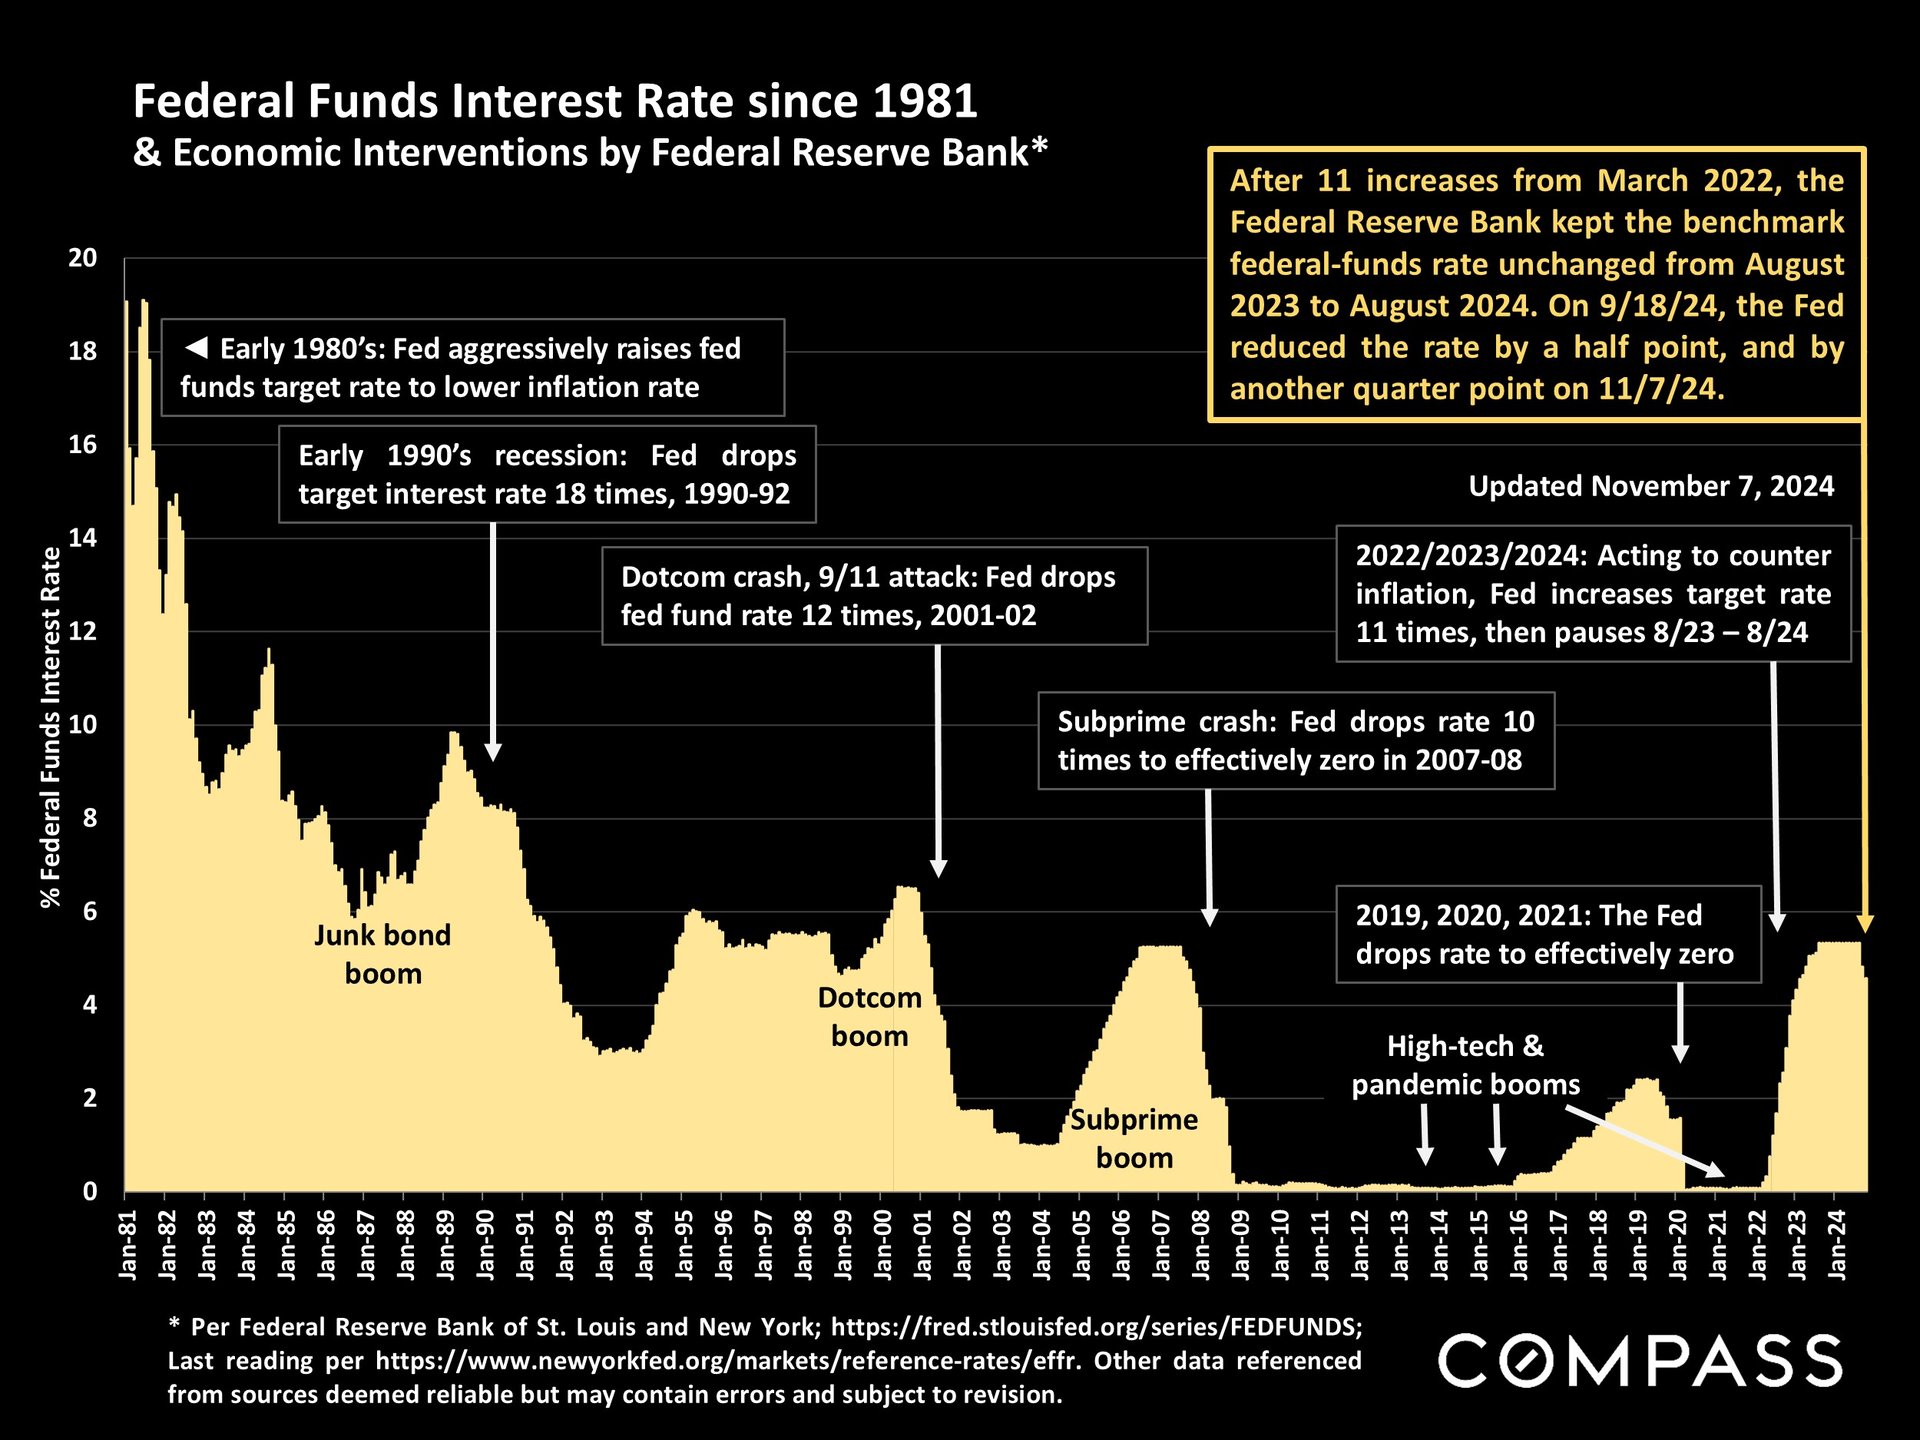
The Fed reduced its benchmark rate by another quarter percent. 

Chart of federal funds rates since 1981, annotated with Federal Reserve actions and economic events.


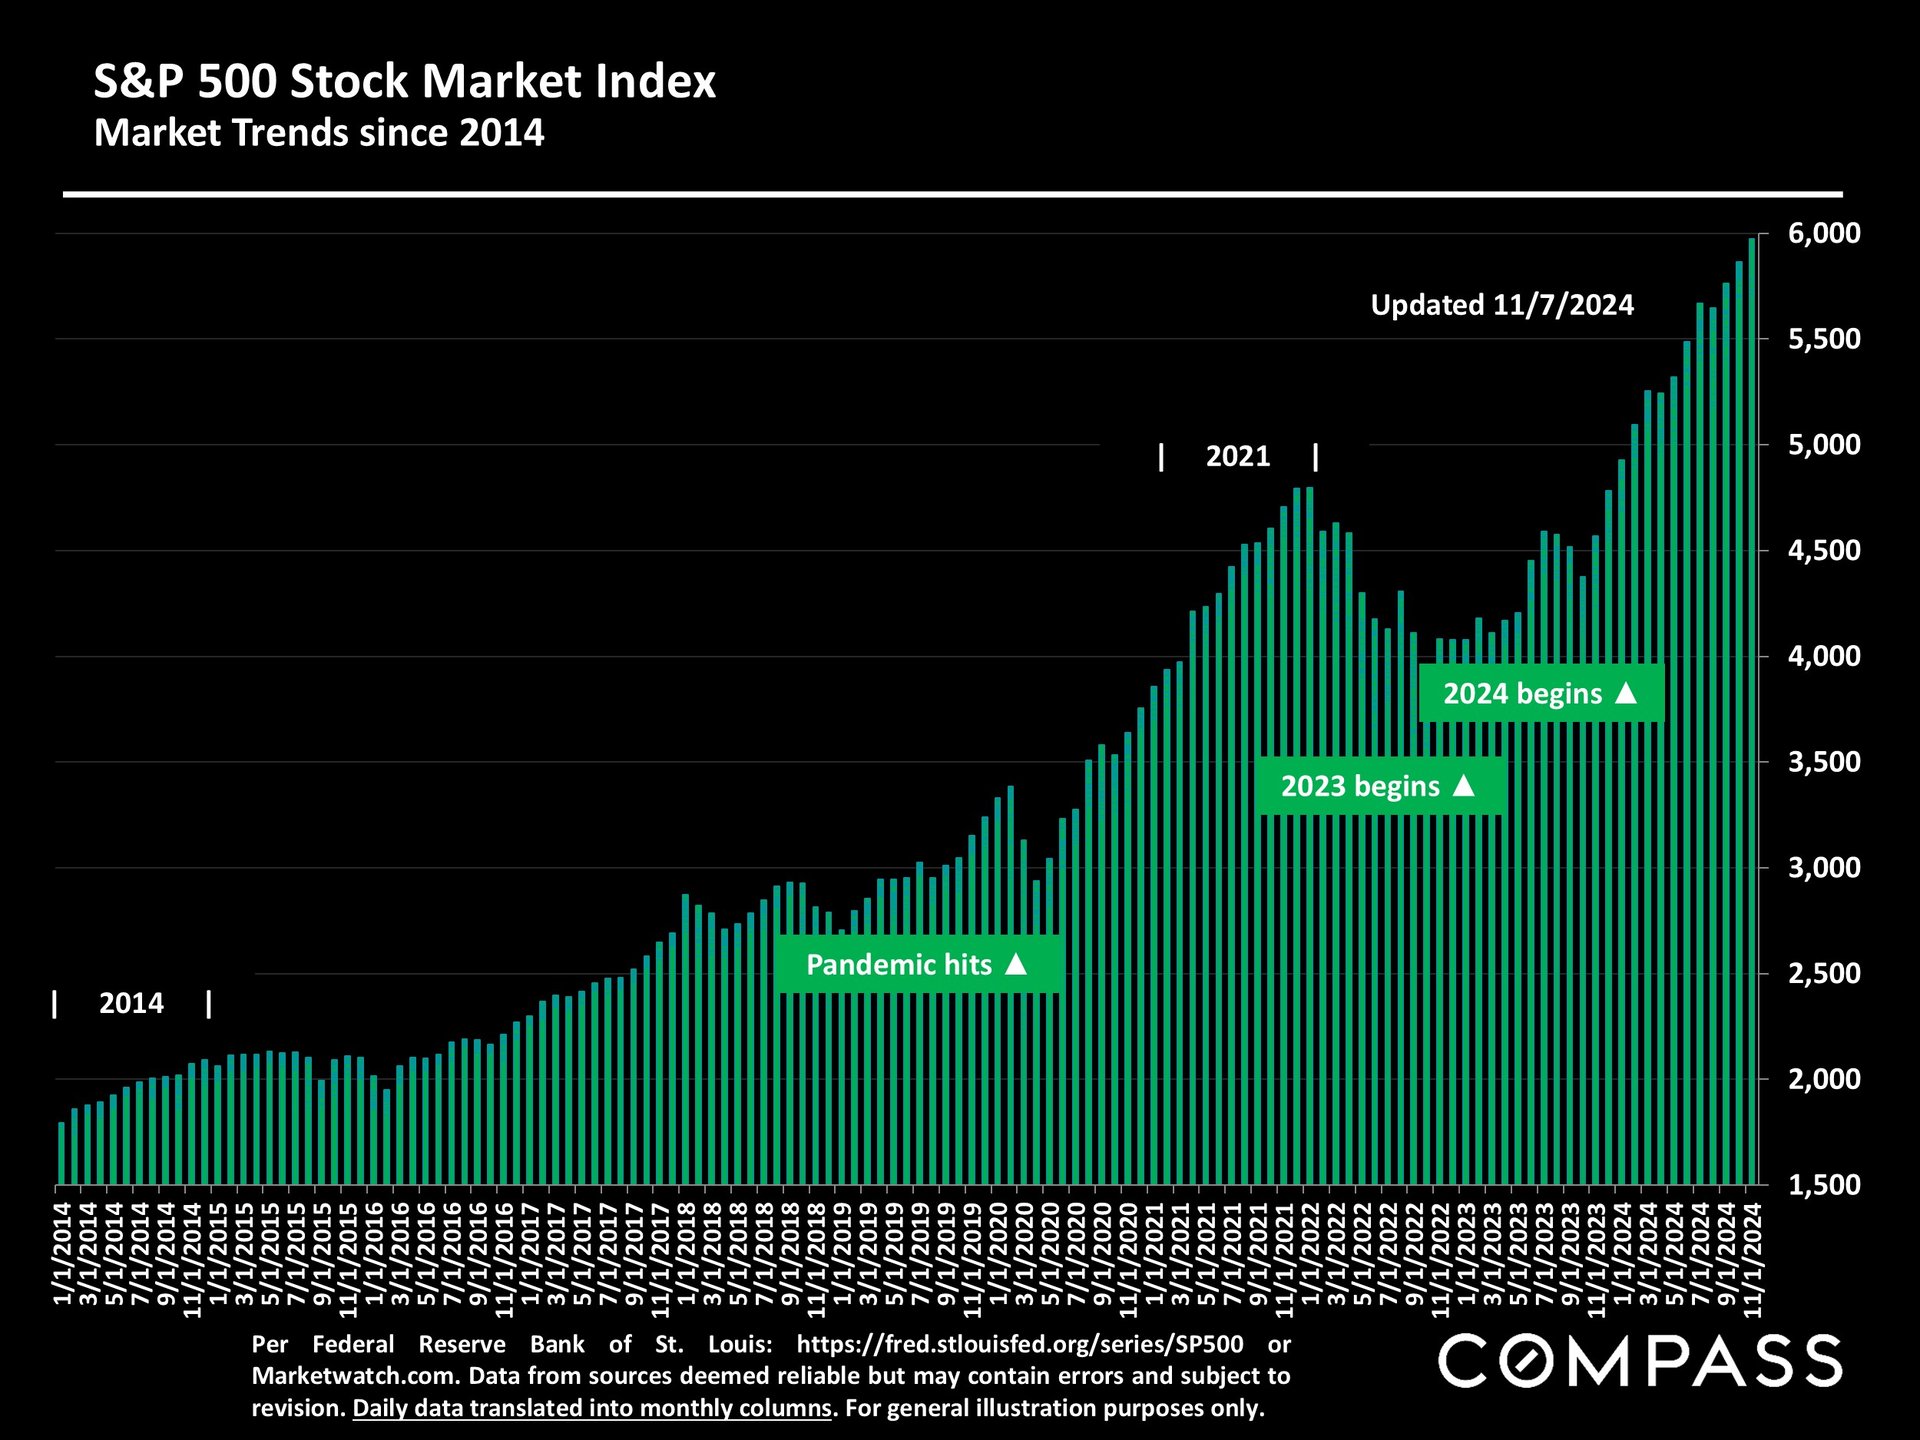
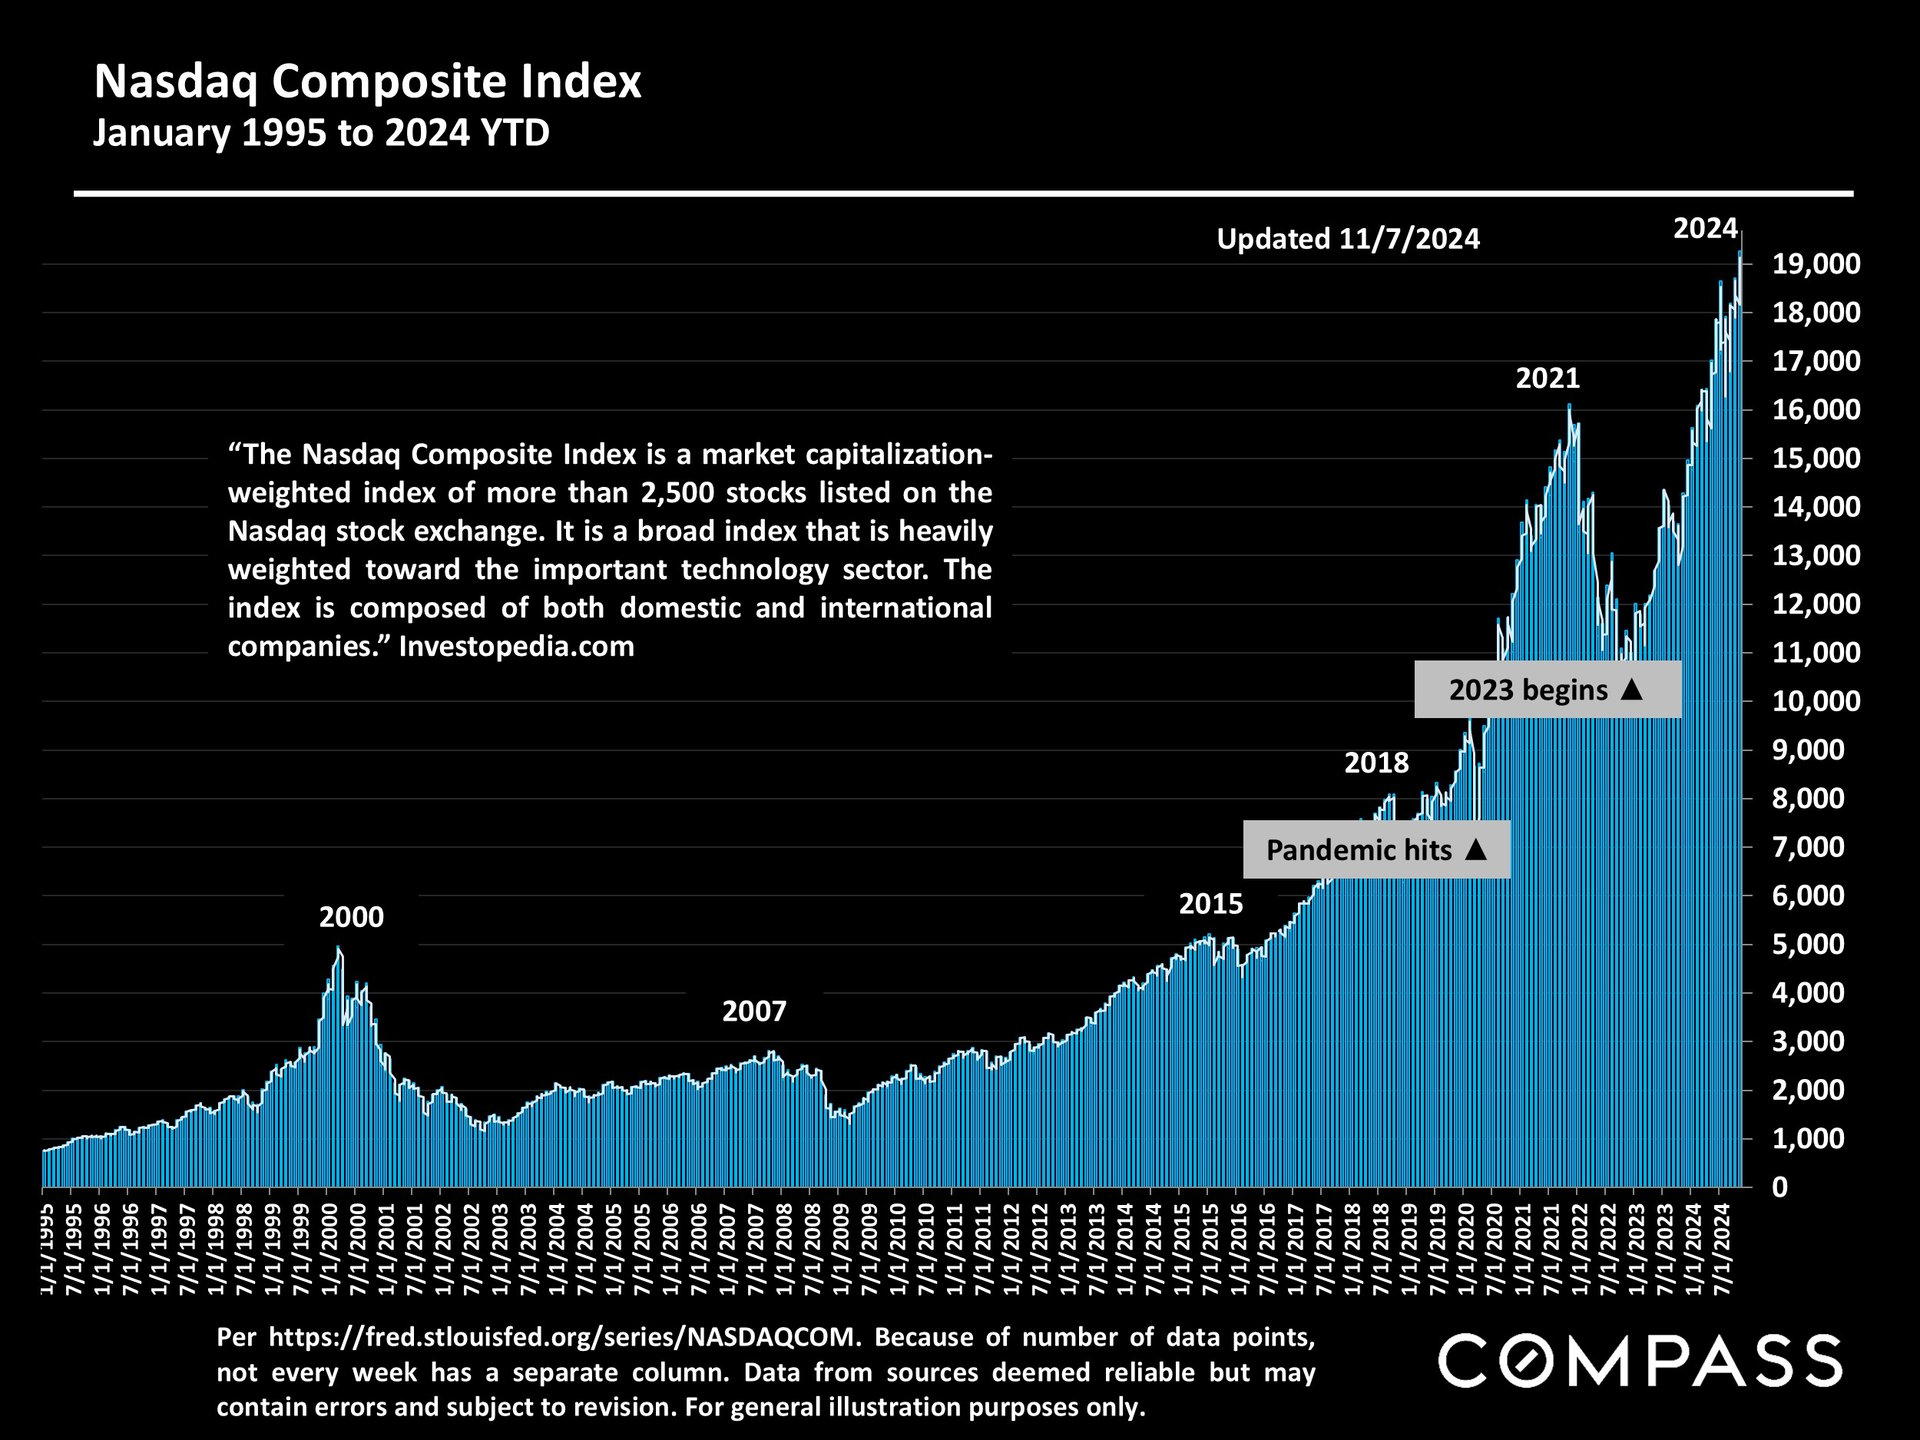
Stock markets hit new highs. 


S&P 500 index chart from 2014 to 2024, with teal bars and annotations for the pandemic and recent years.

Chart of the Nasdaq Composite Index from 1995 to 2024, showing long-term growth and major market swings.


Updated Market Seasonality Reports
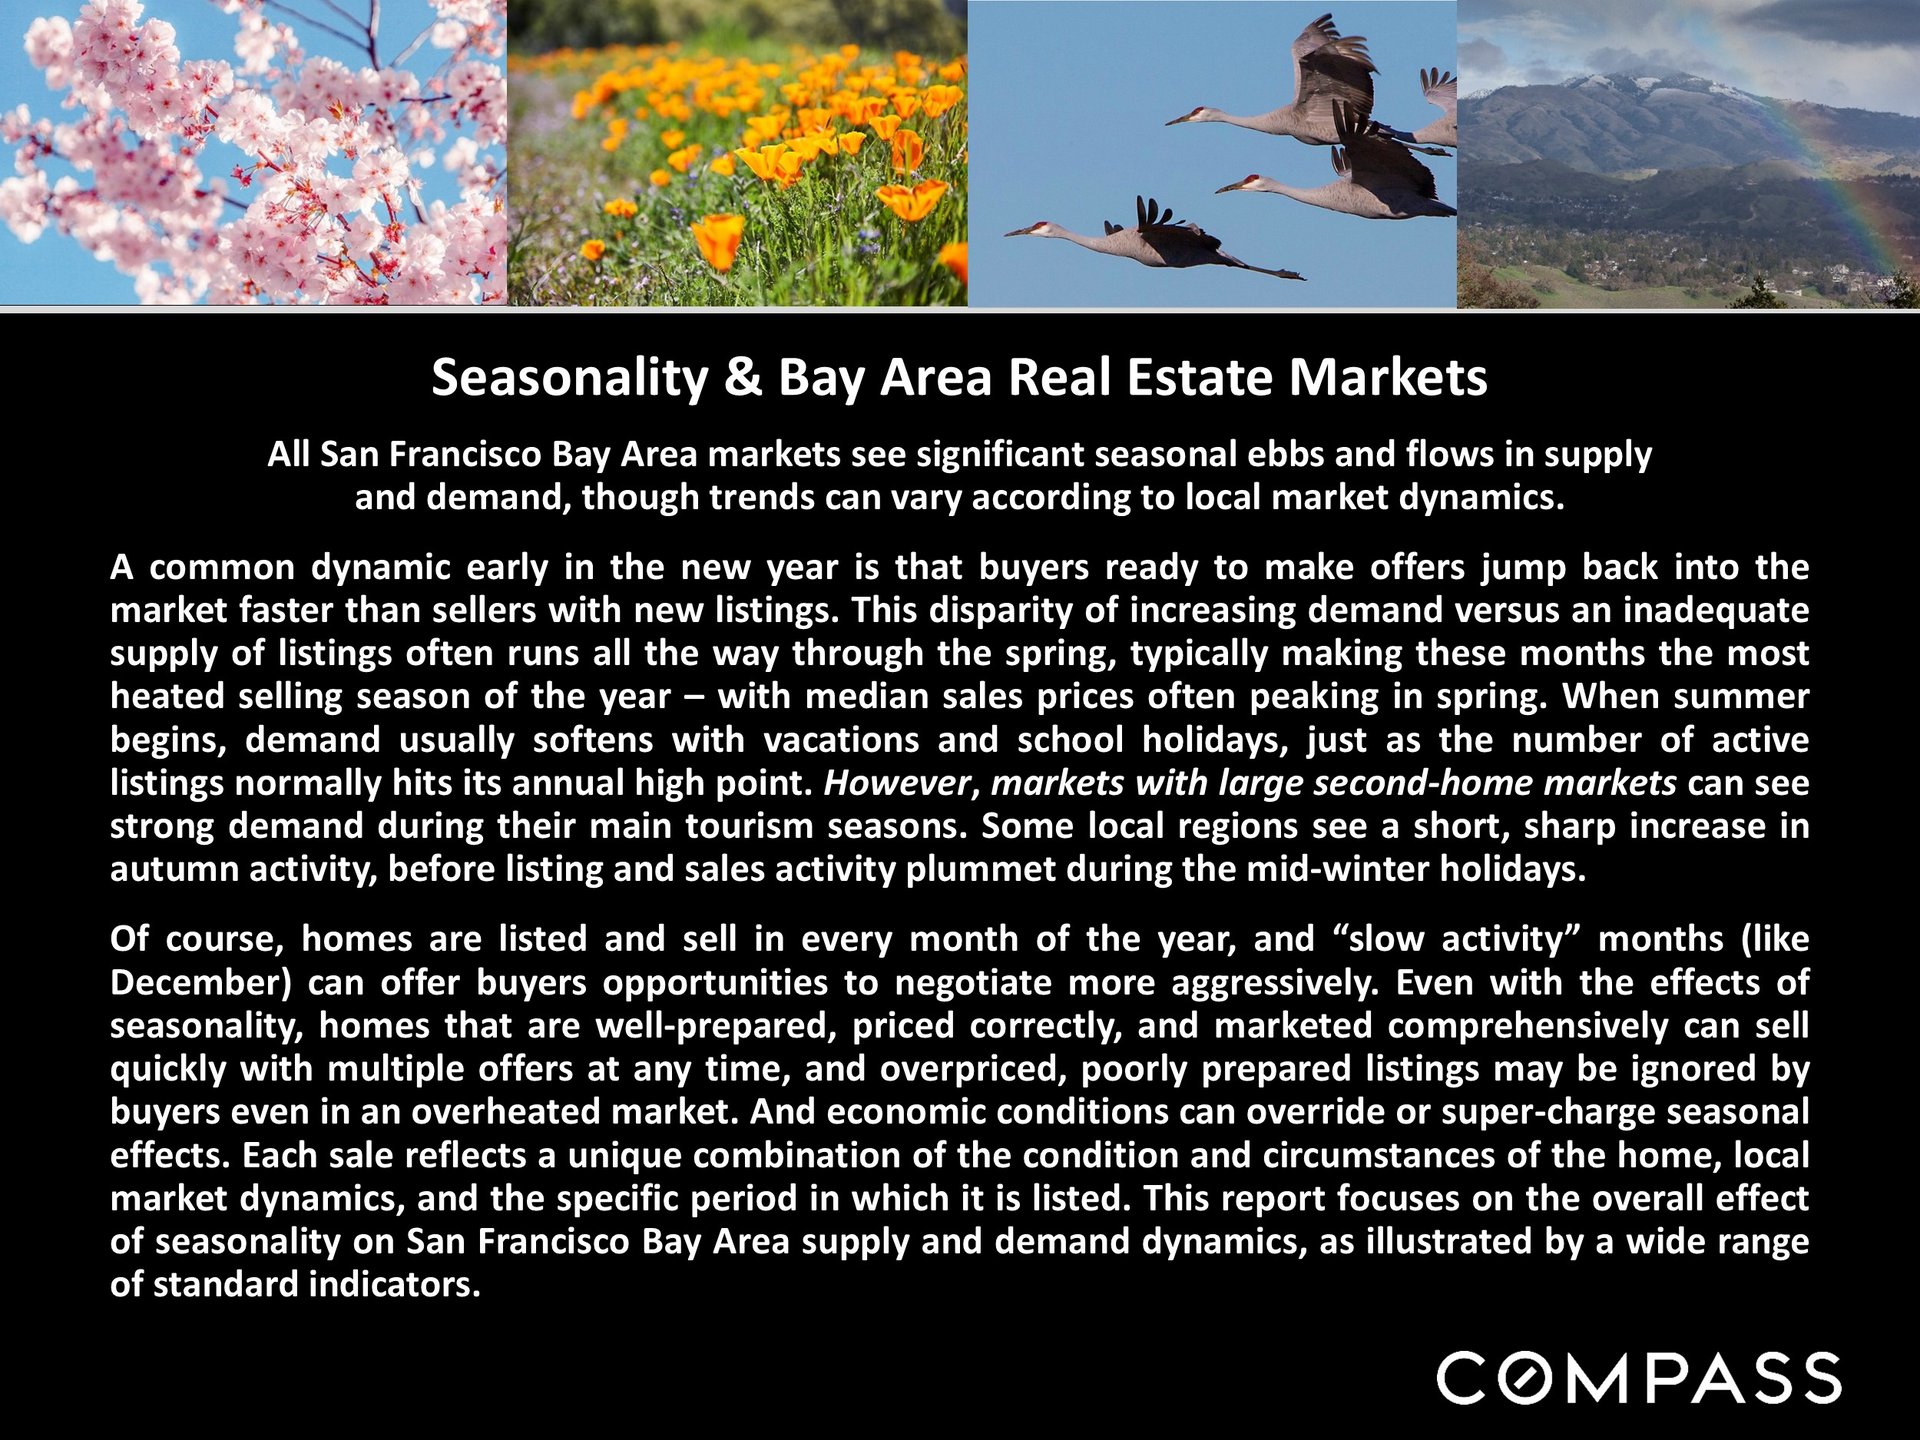
Infographic about seasonal changes in Bay Area real estate supply, demand, and sales activity.

Market information slide explaining supply, demand, factors affecting housing trends, and transaction timing, with Compass branding.

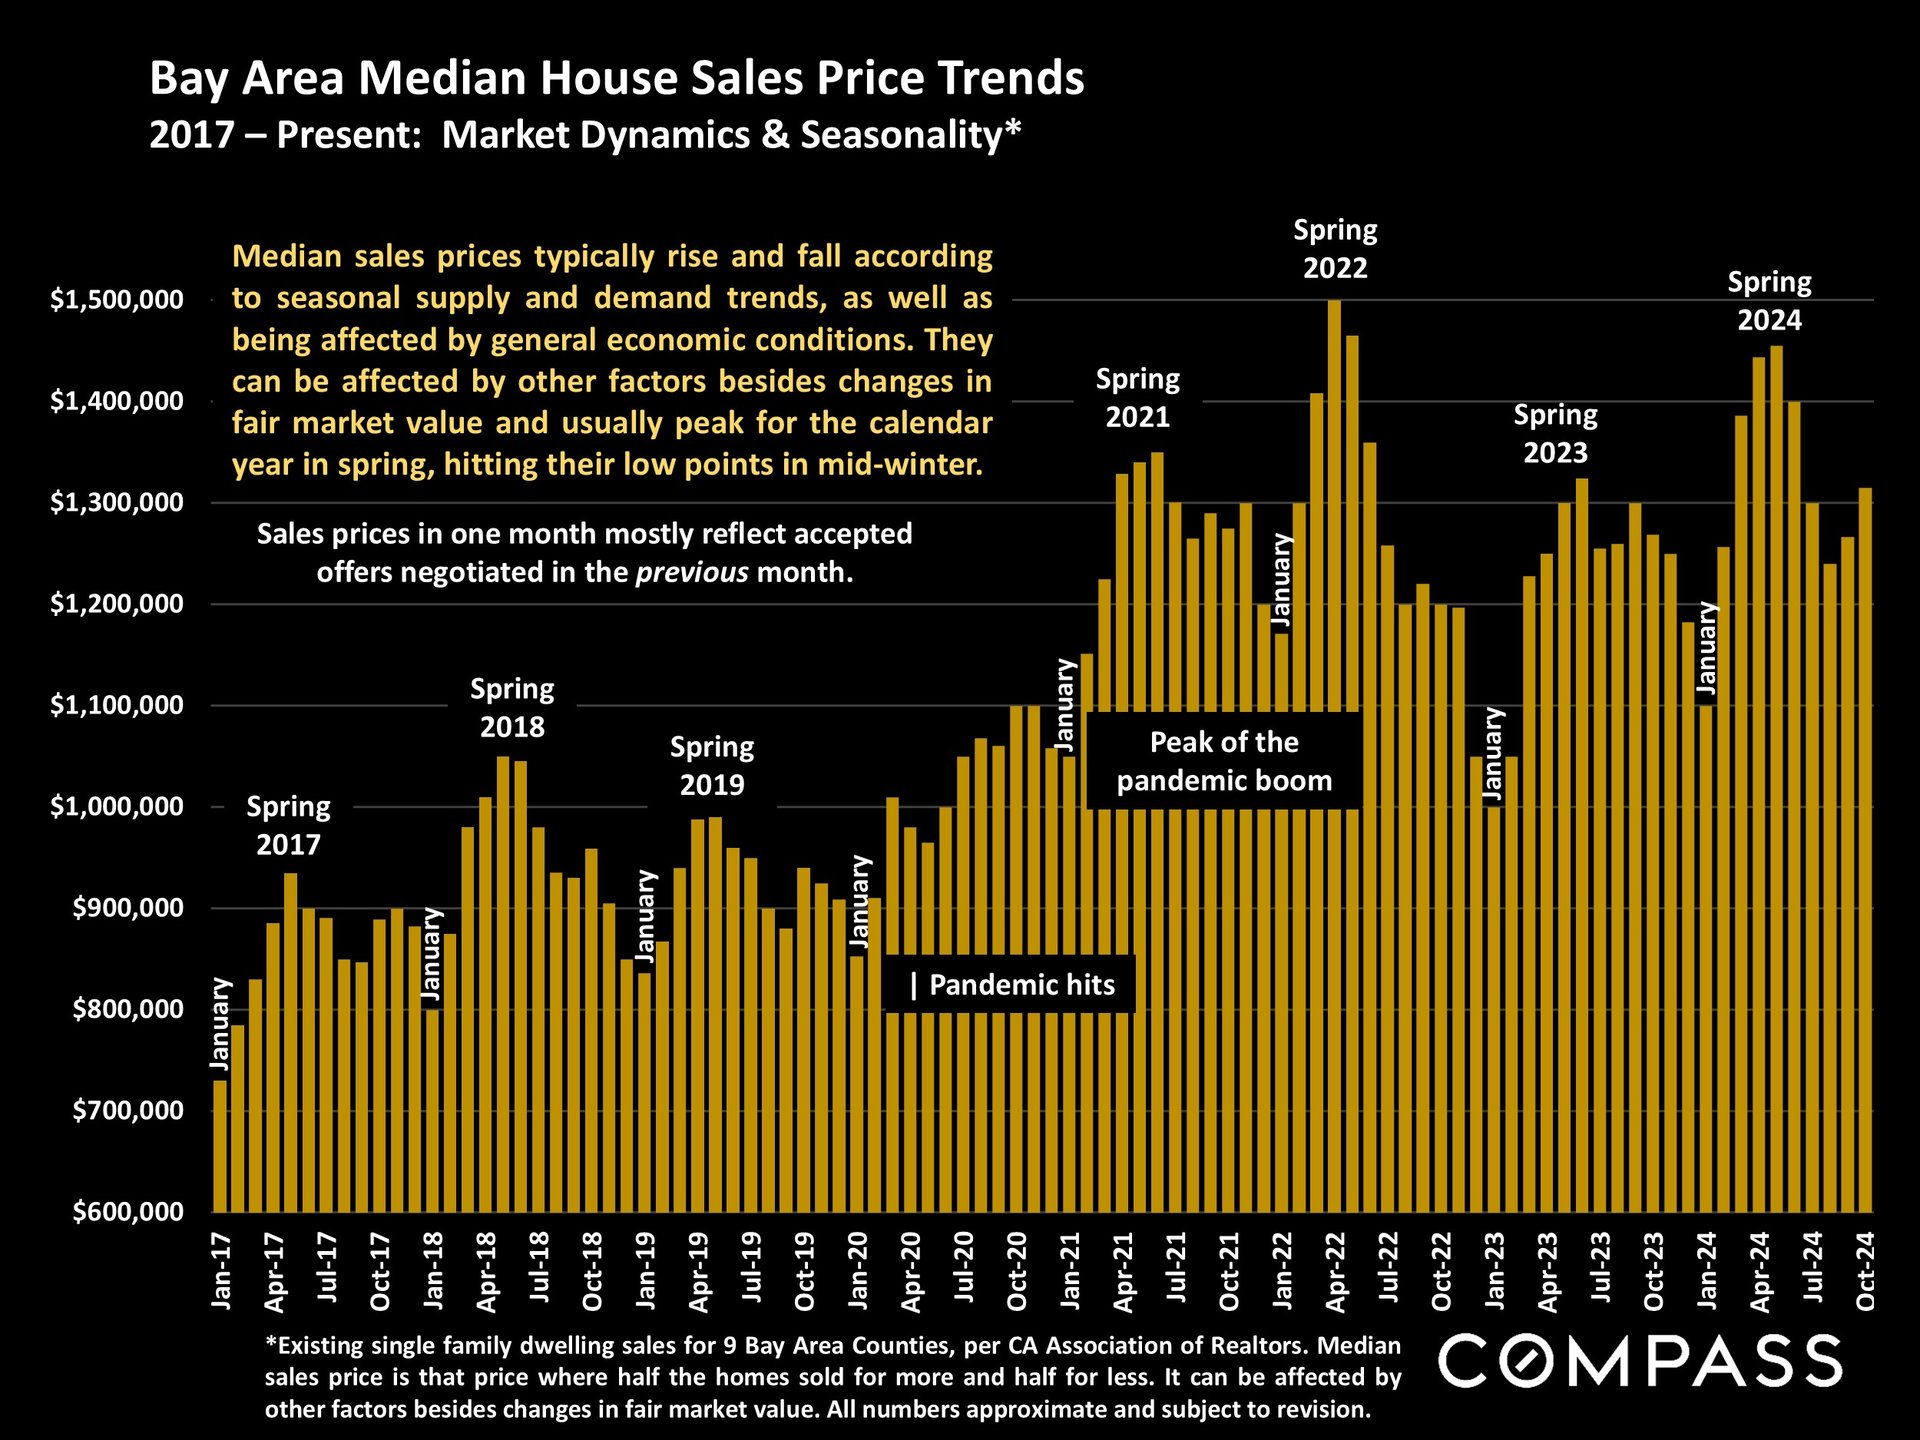
Chart of Bay Area median home prices, 2017–2024, showing spring peaks and the pandemic-era price surge.

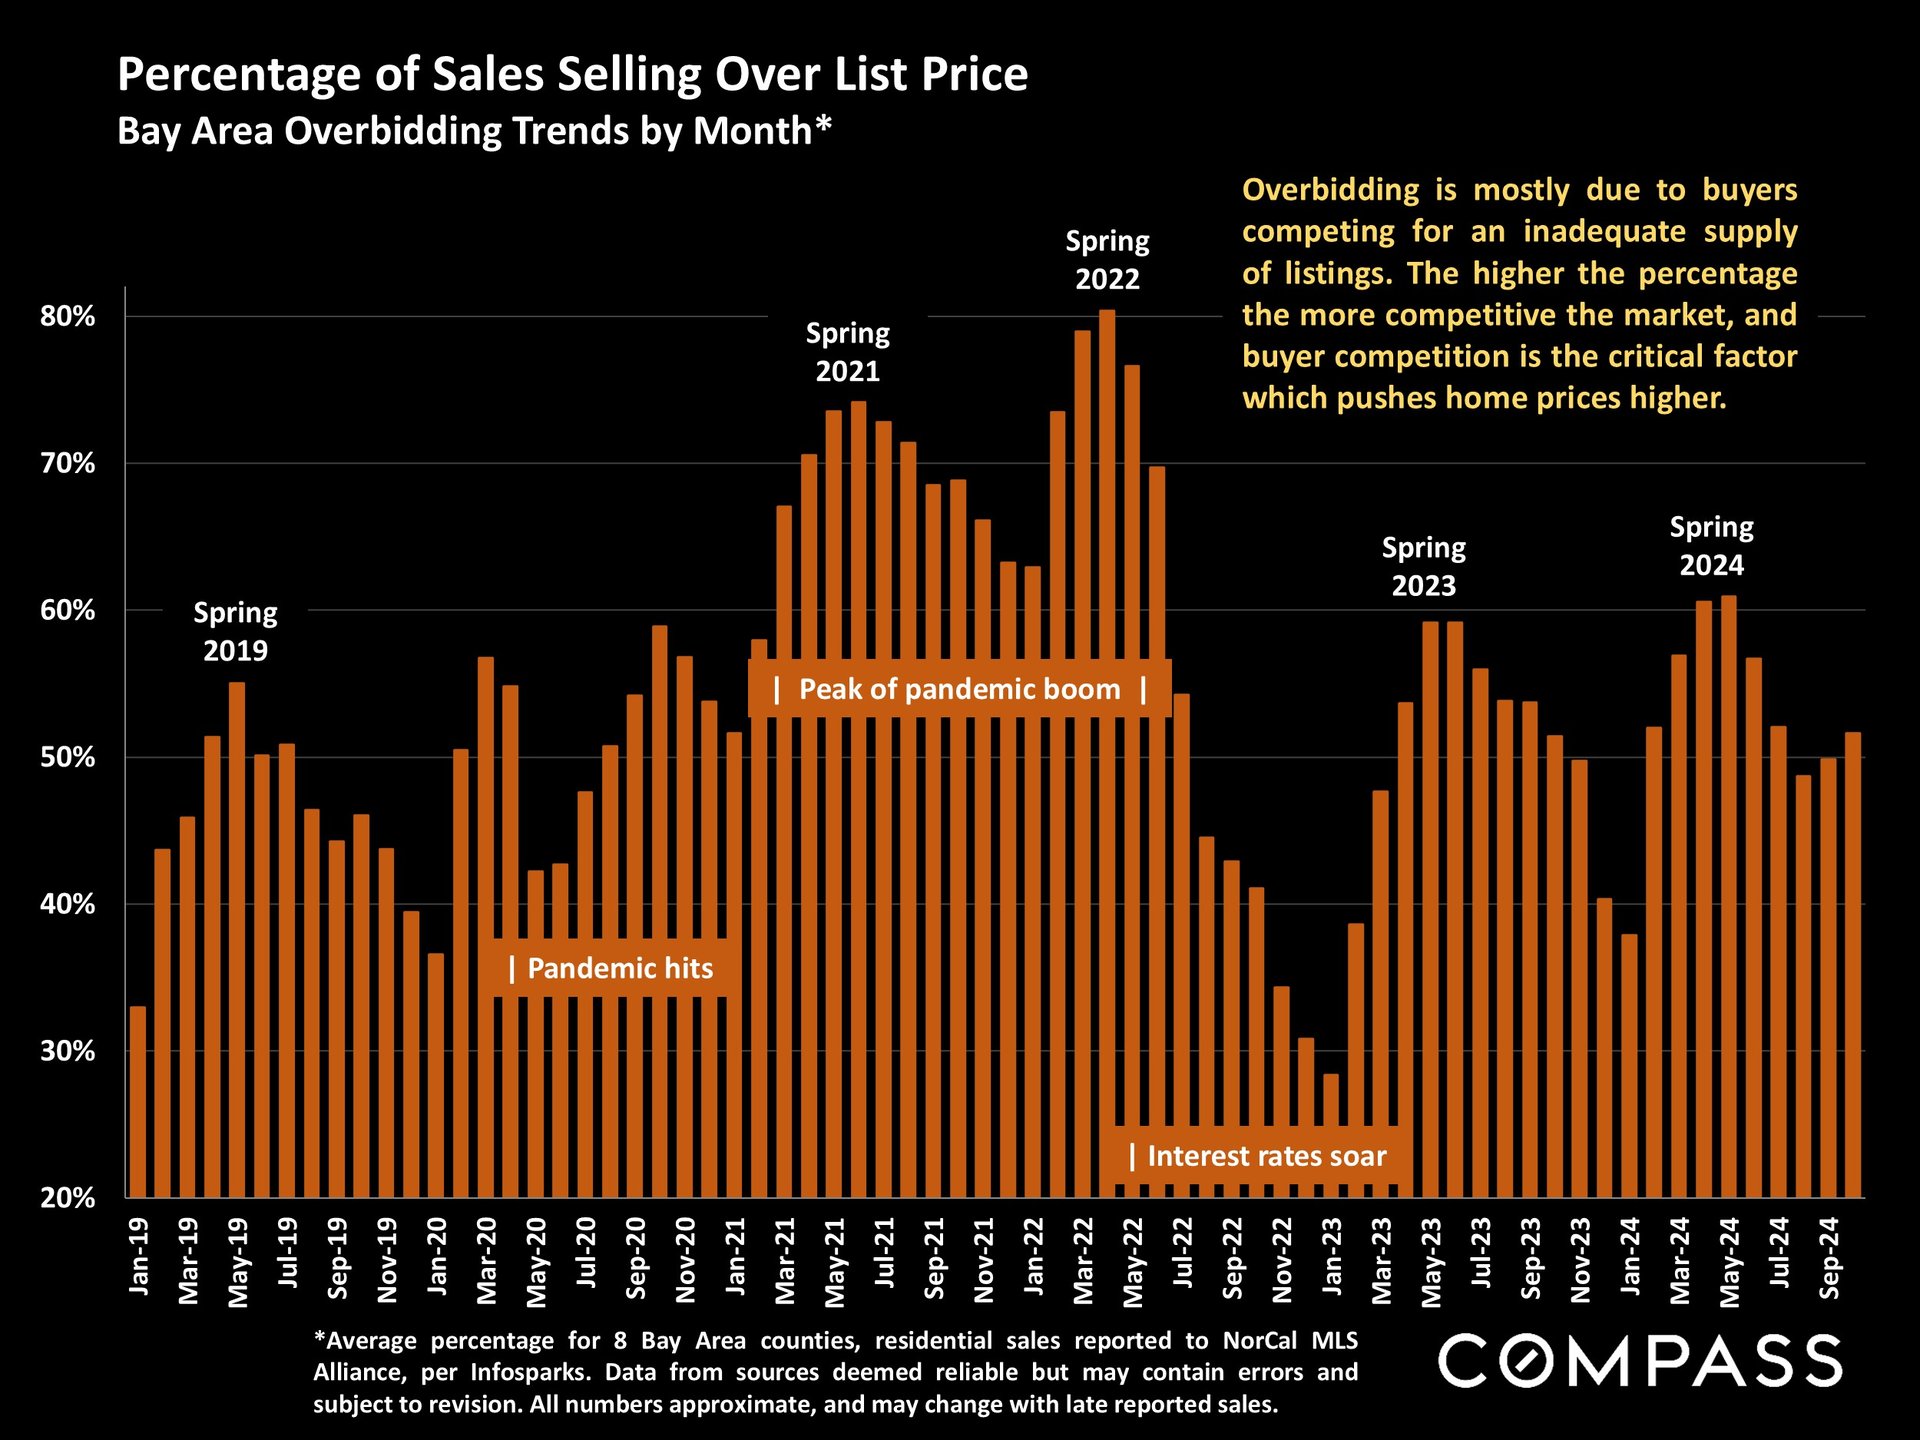
Bar chart tracks Bay Area home sales over list price from 2019 to 2024, peaking above 80% in spring 2022.

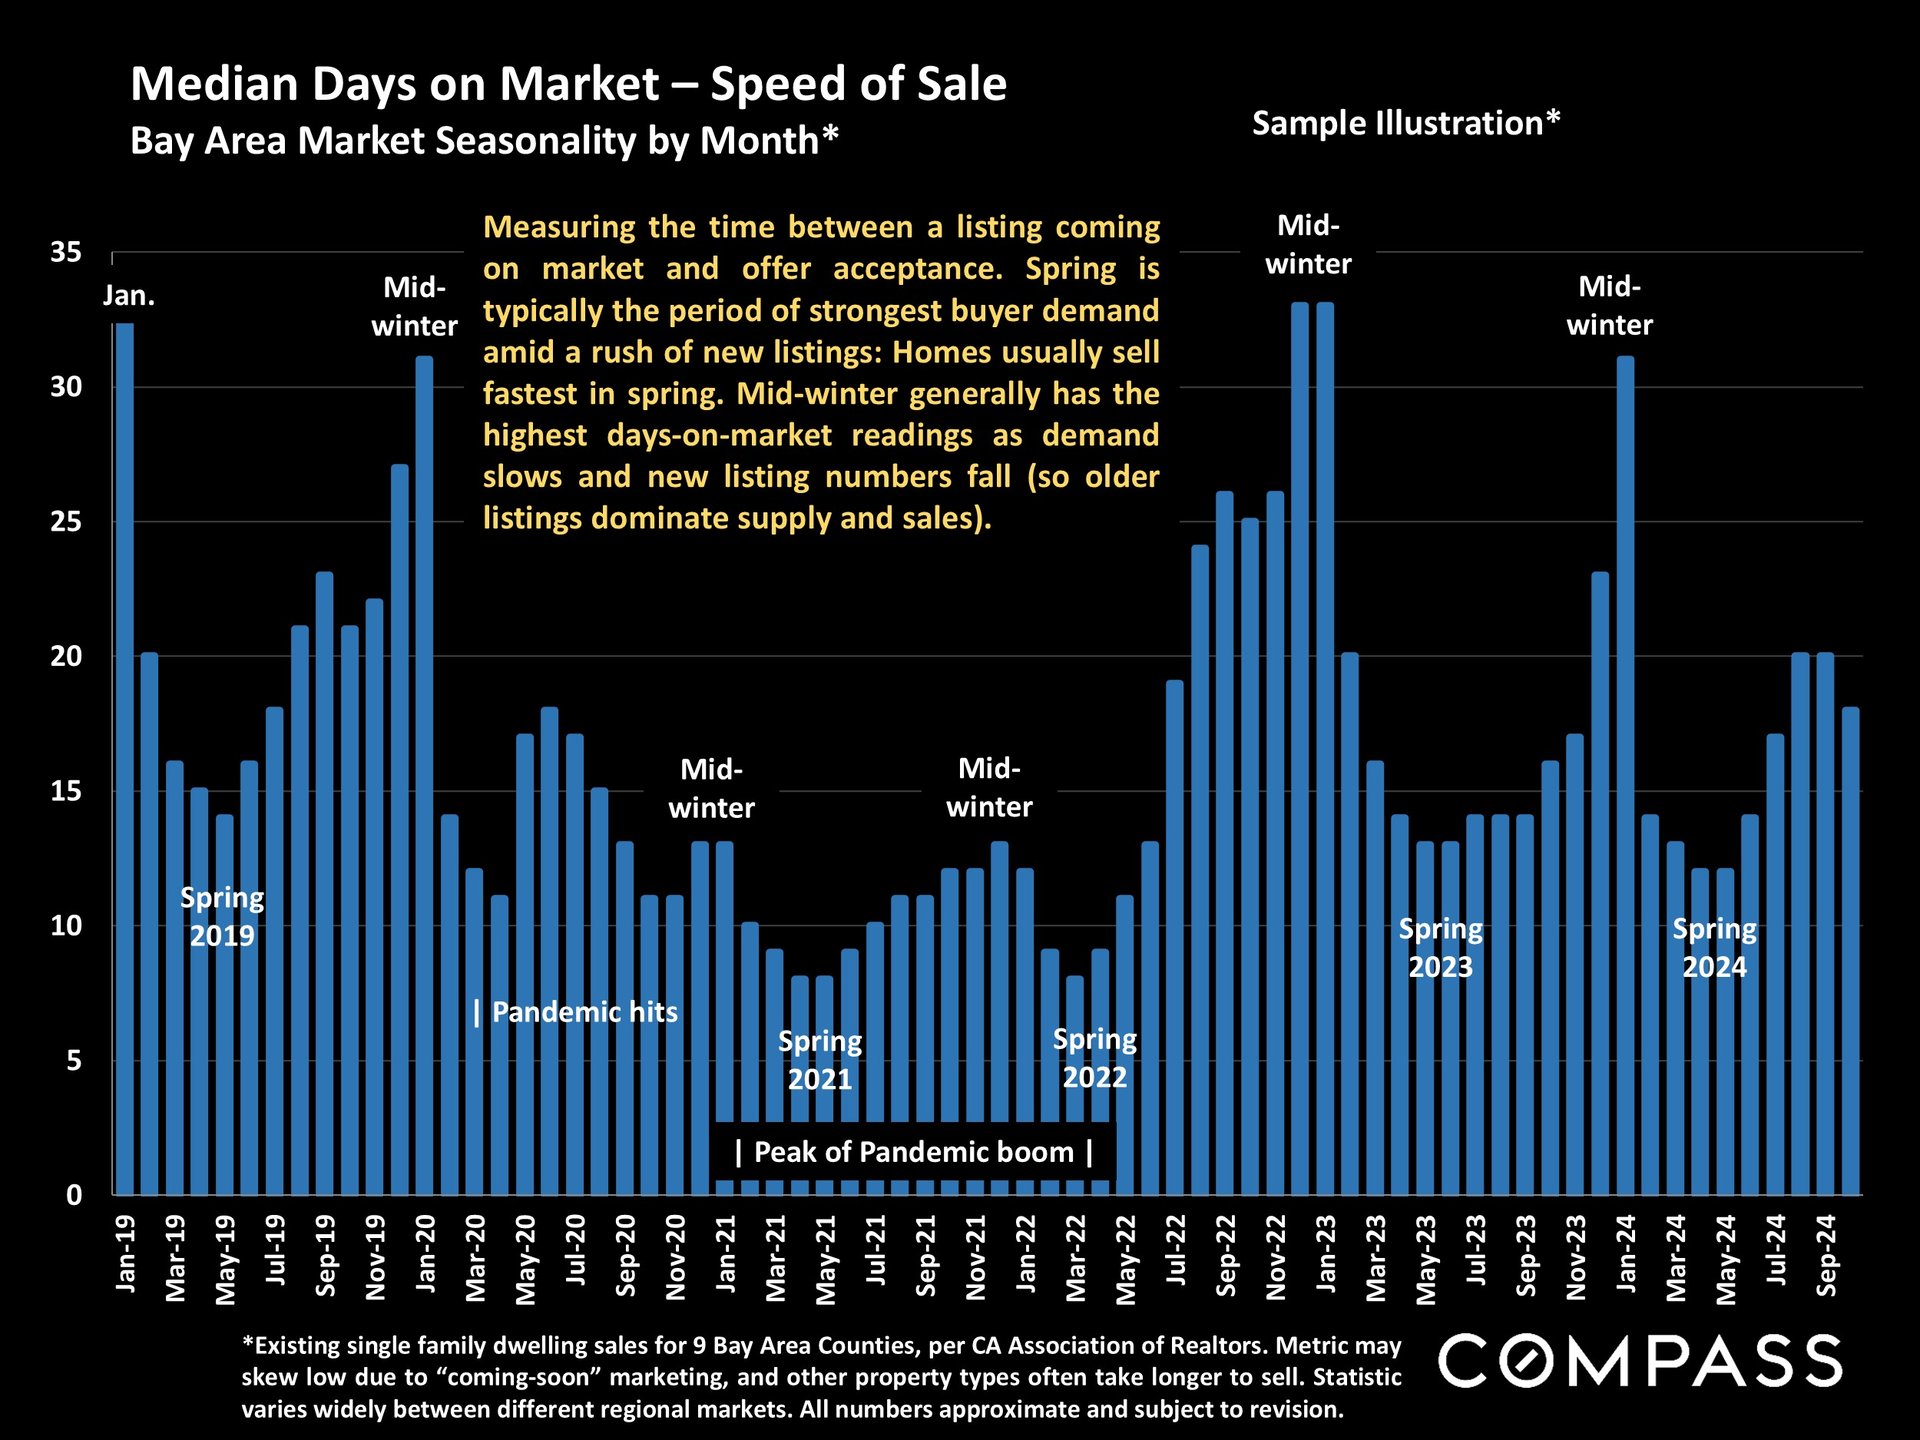
Bar chart of Bay Area median days on market, January 2019–September 2024, with seasonal and pandemic annotations.

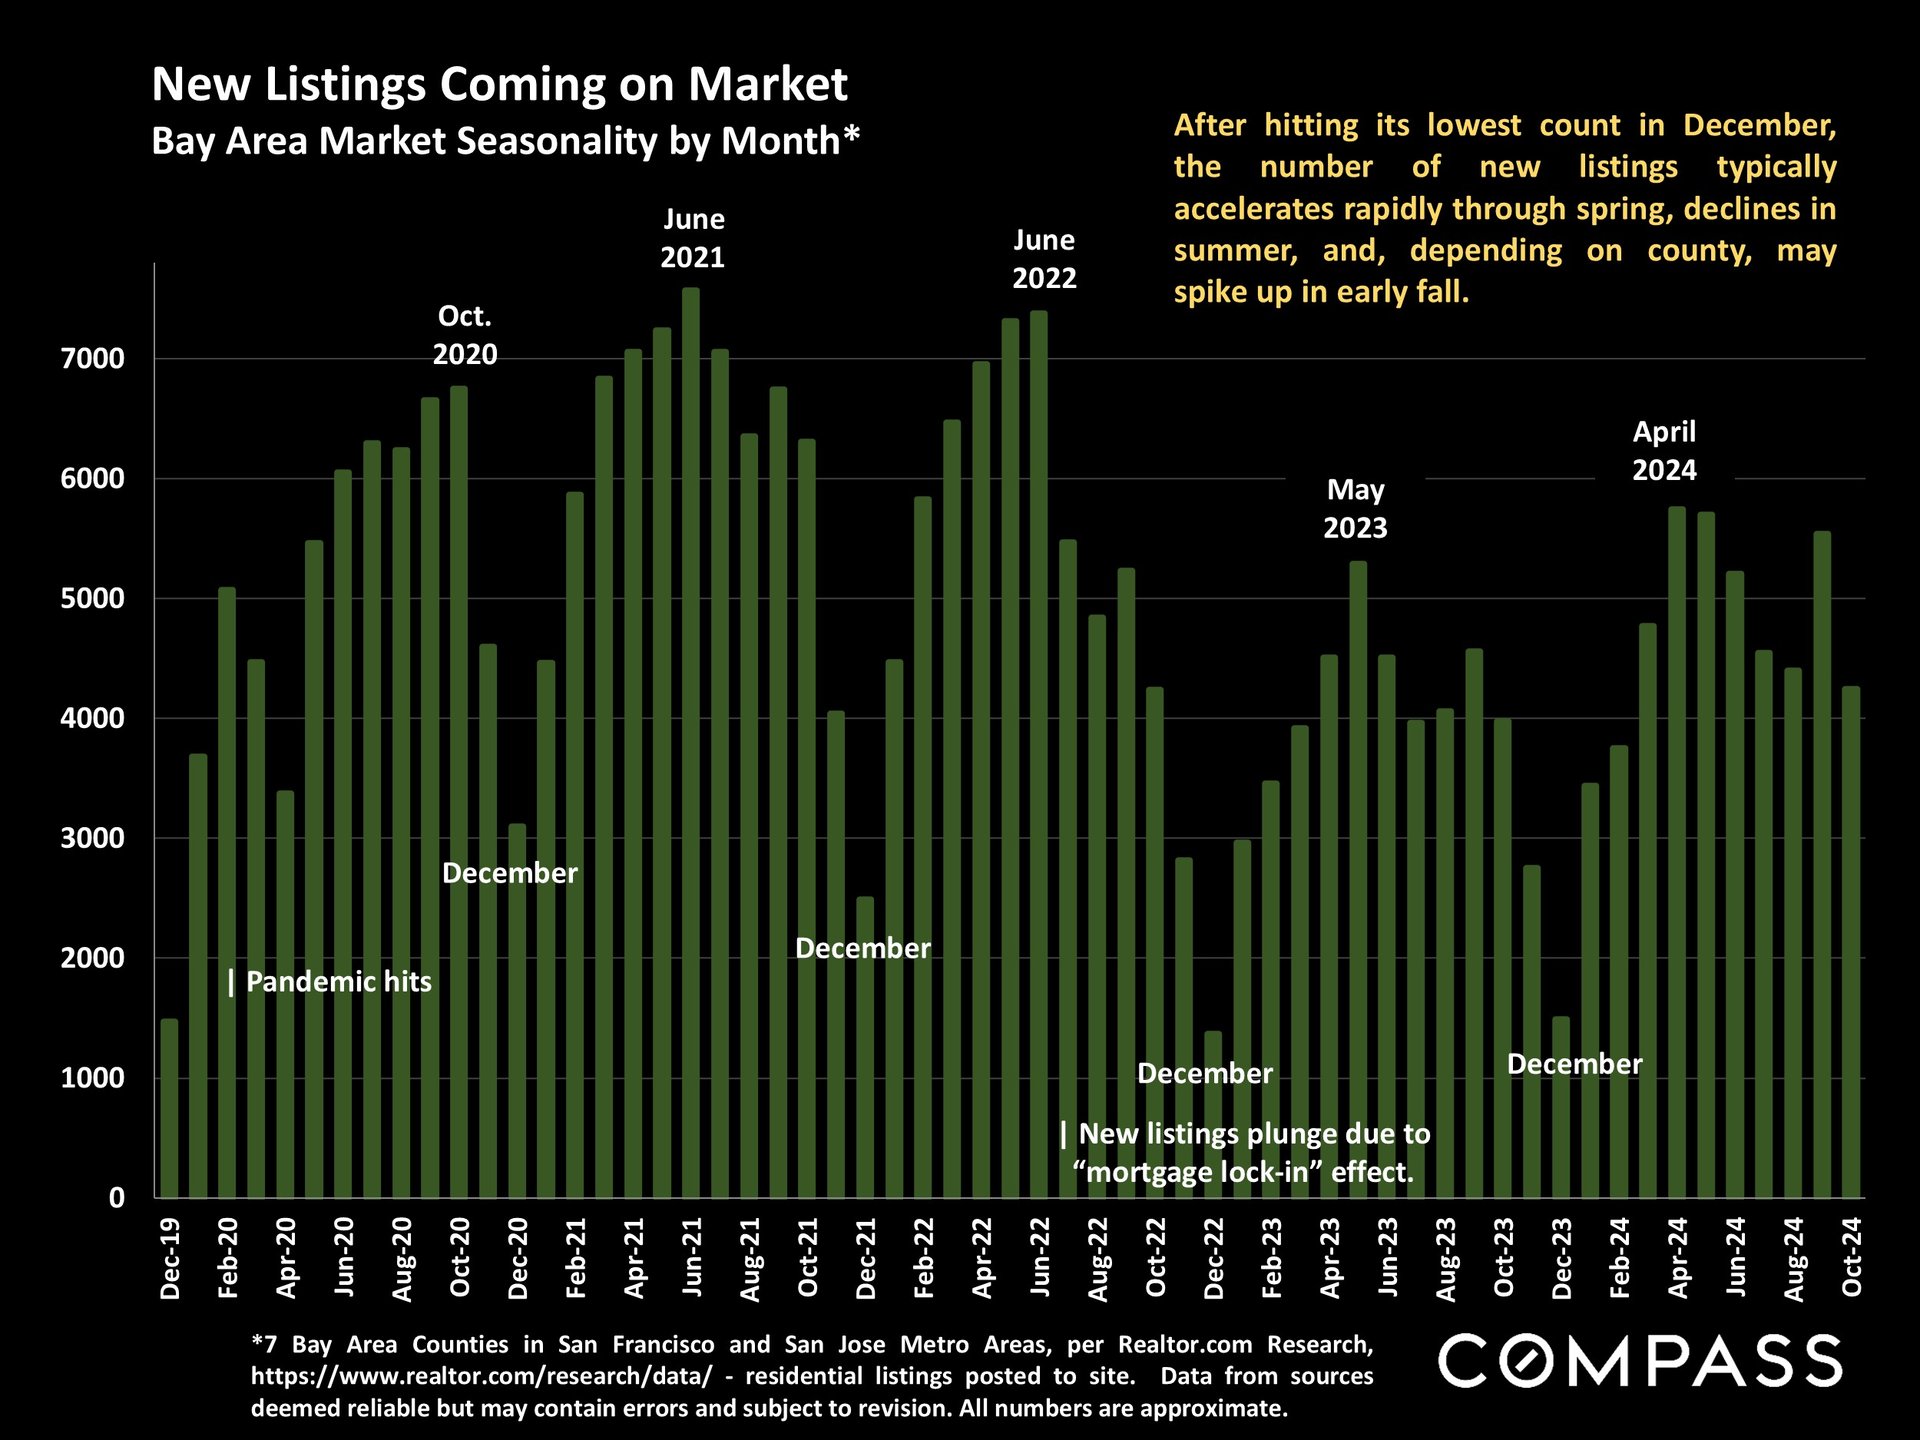
Bar chart of Bay Area new listings from 2019 to 2024, showing seasonal peaks and December lows.

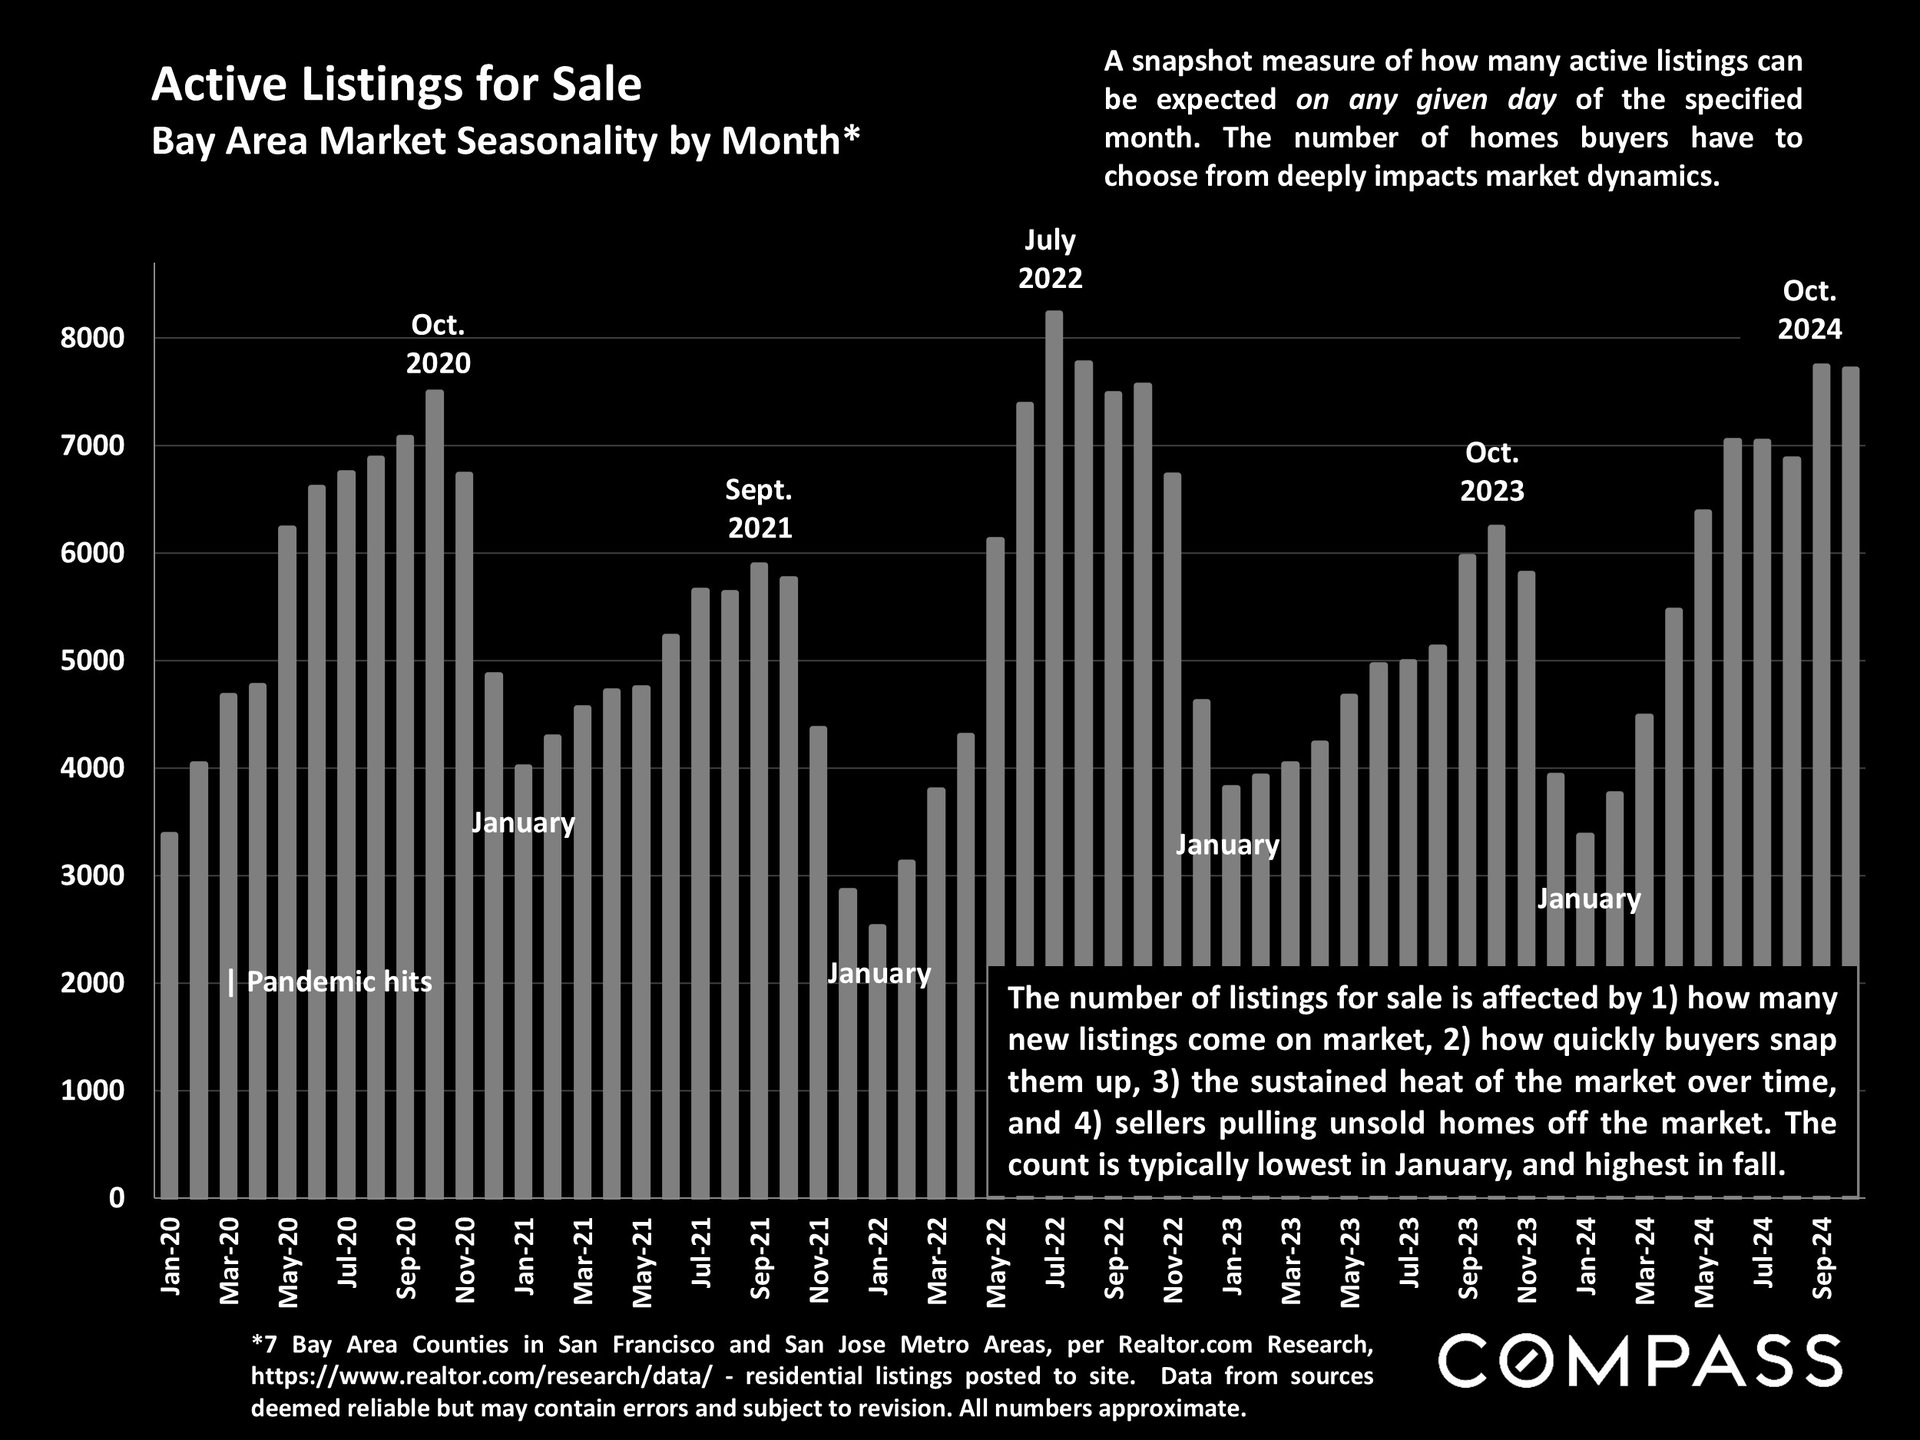
Bar chart of Bay Area active listings from 2020 to 2024, showing seasonal peaks in fall and lows in January.

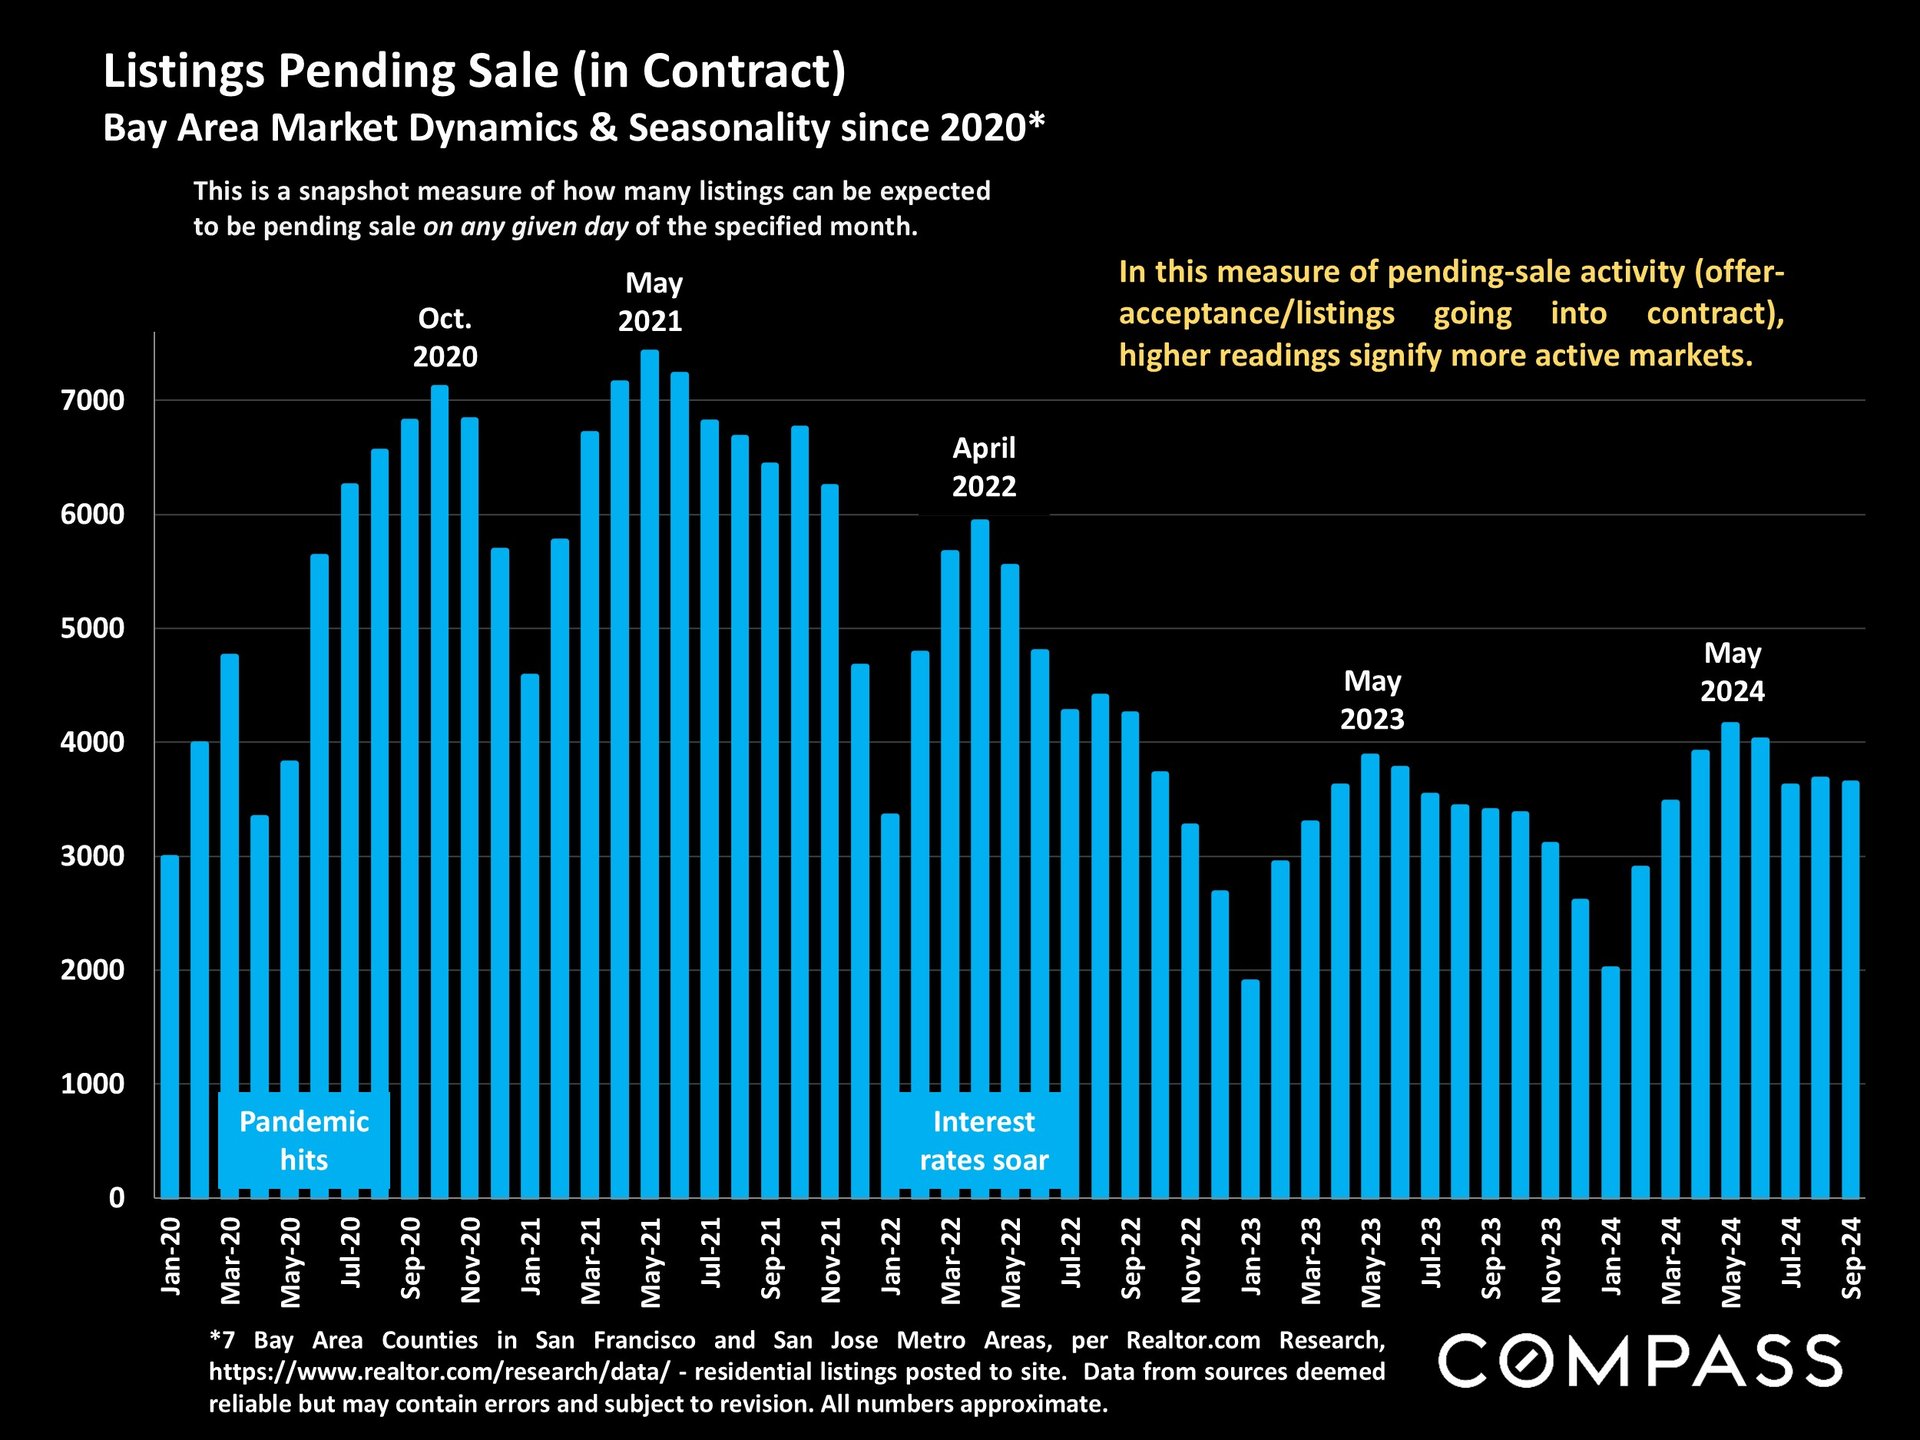
Chart of Bay Area pending-sale listings from 2020 to 2024, with seasonal peaks, pandemic impacts, and rising interest rates.

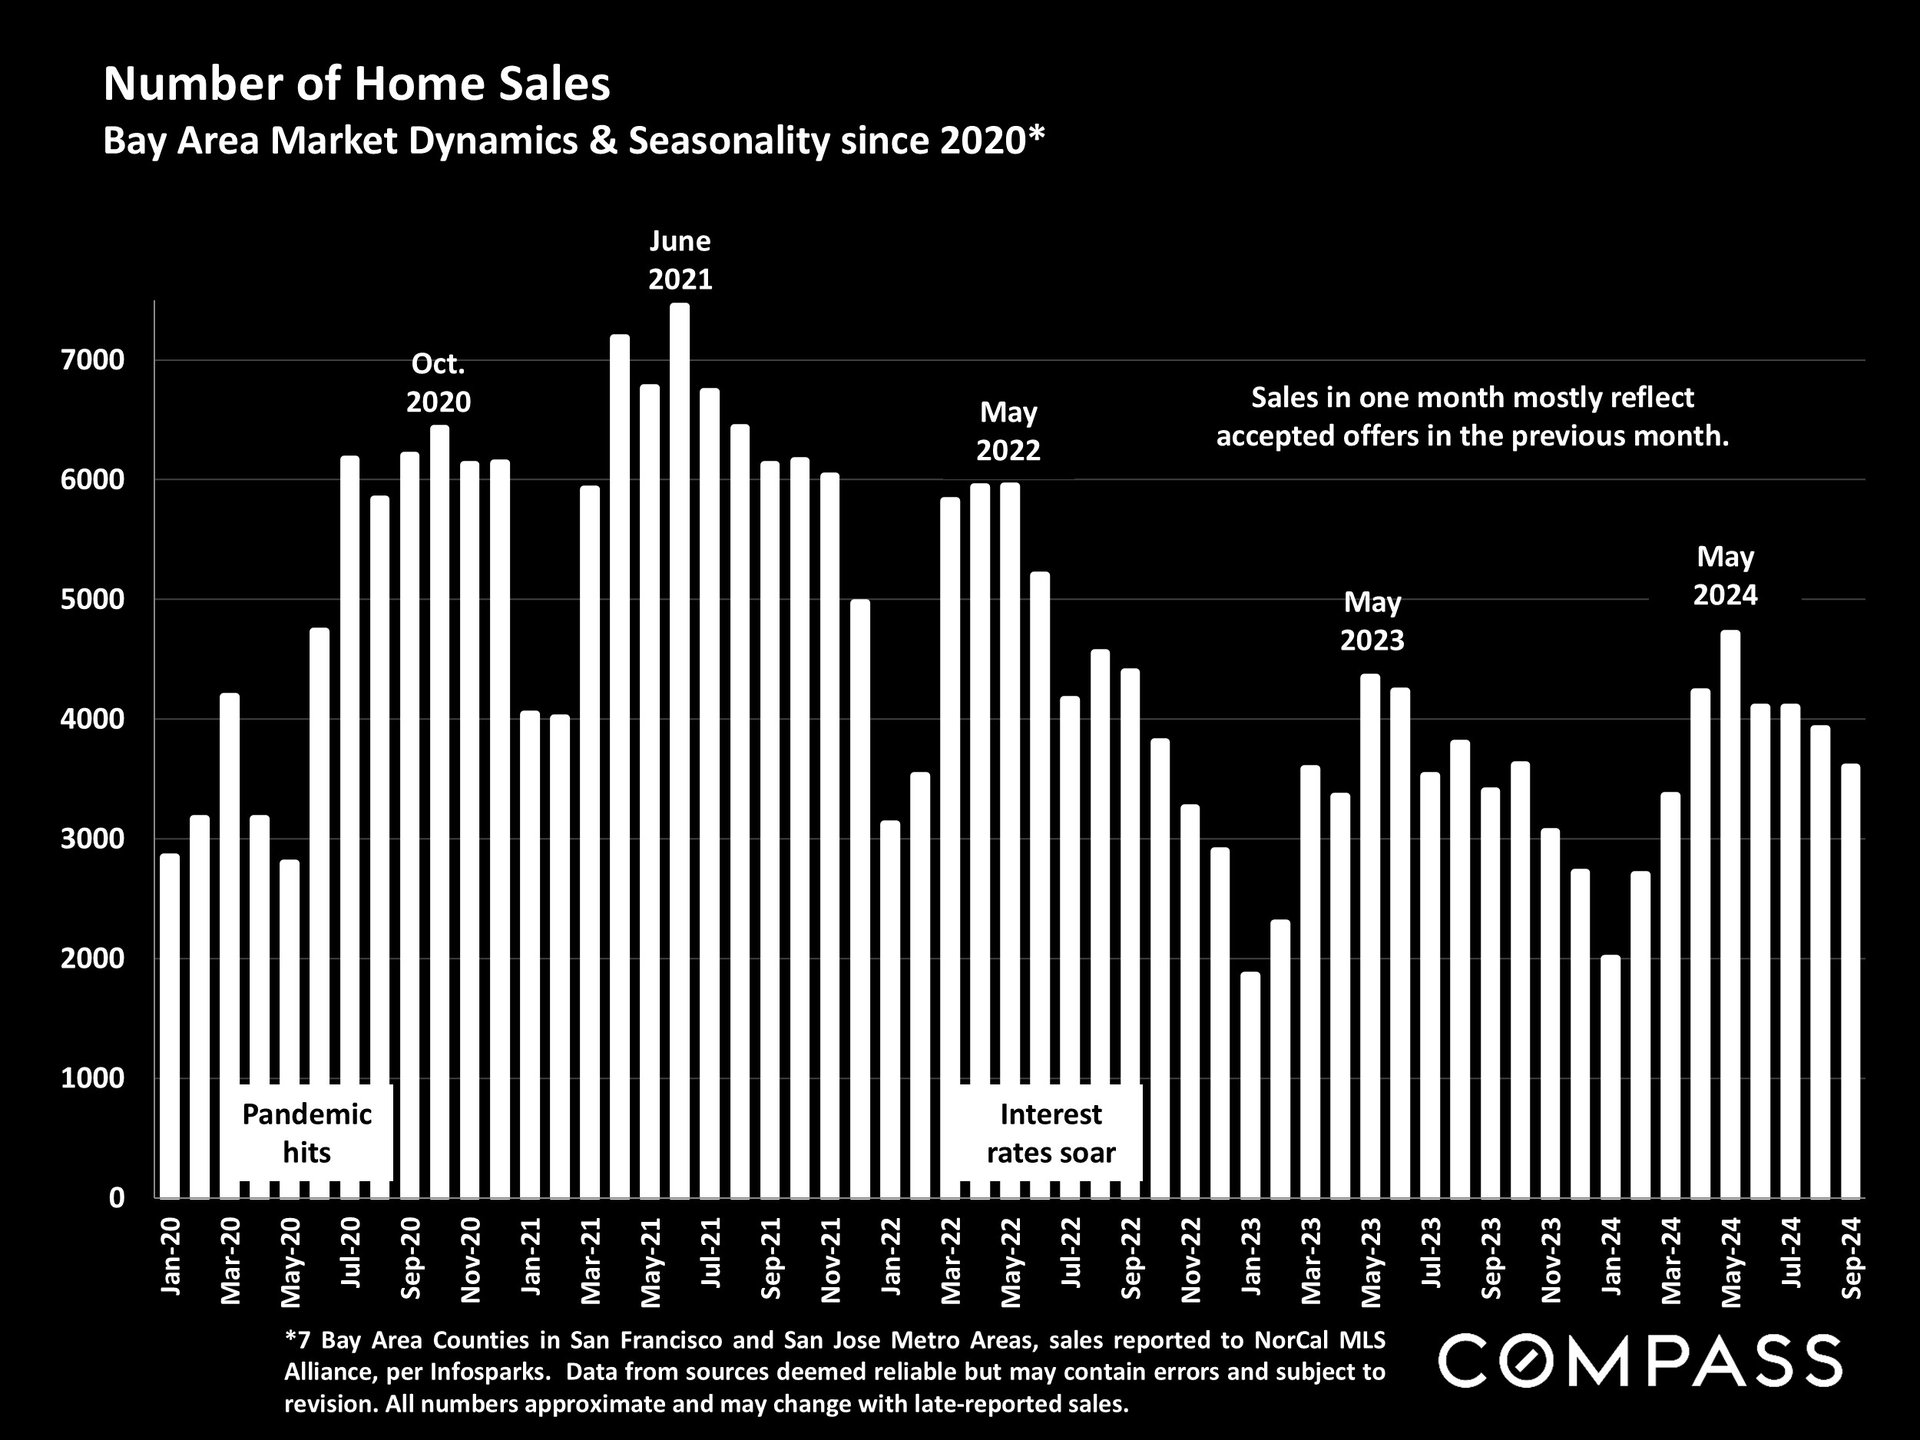
Bar chart of Bay Area home sales, January 2020 to September 2024, with pandemic and interest-rate annotations.

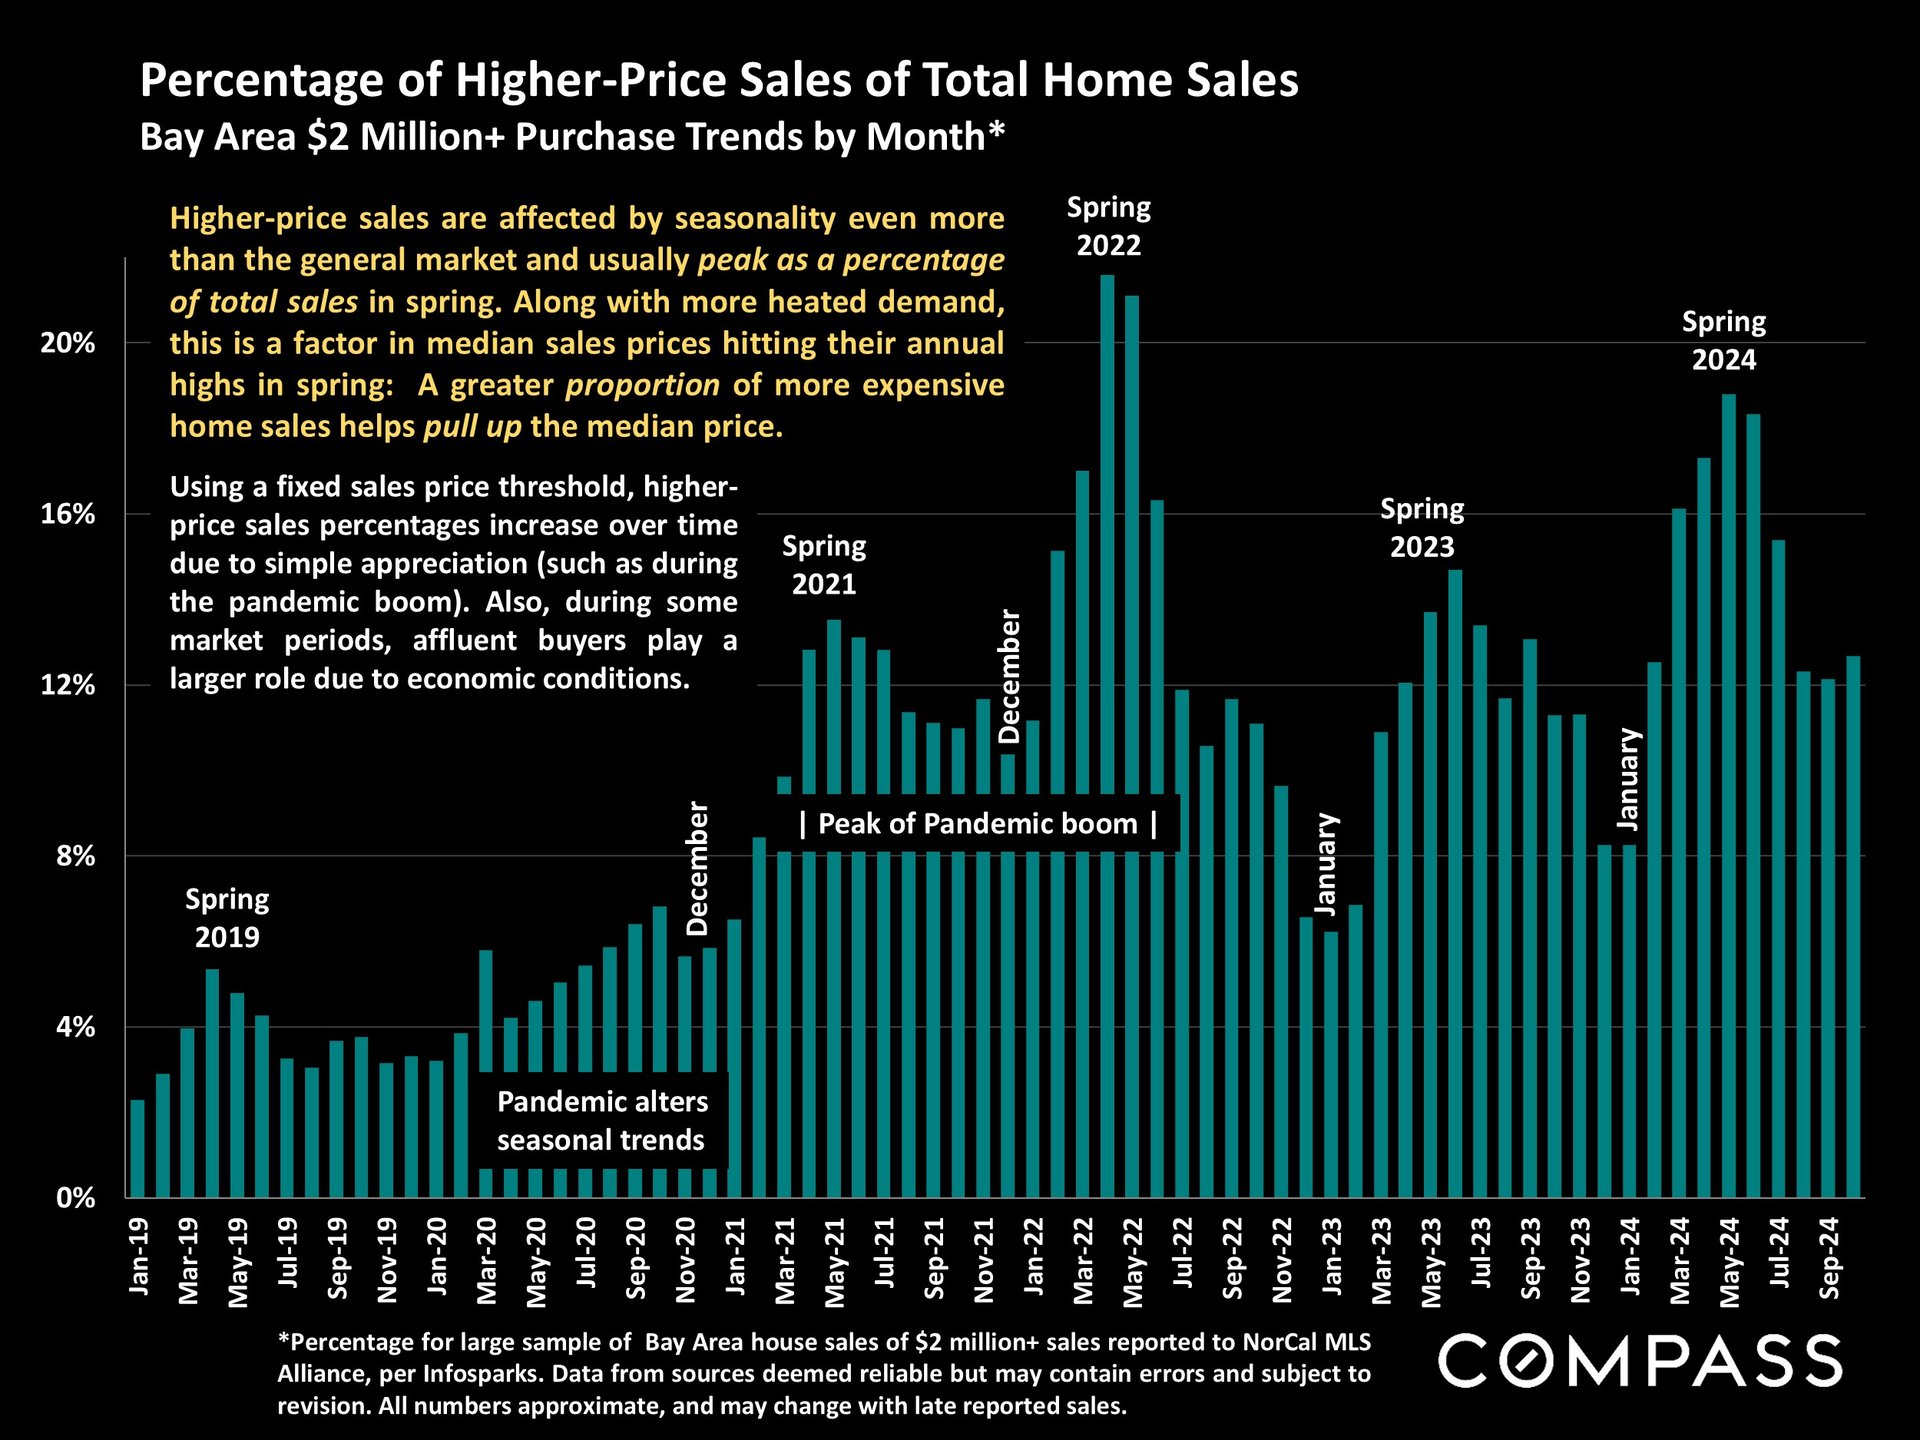
Chart of Bay Area $2 million-plus home sales, with teal monthly bars peaking in spring 2022 and spring 2024.

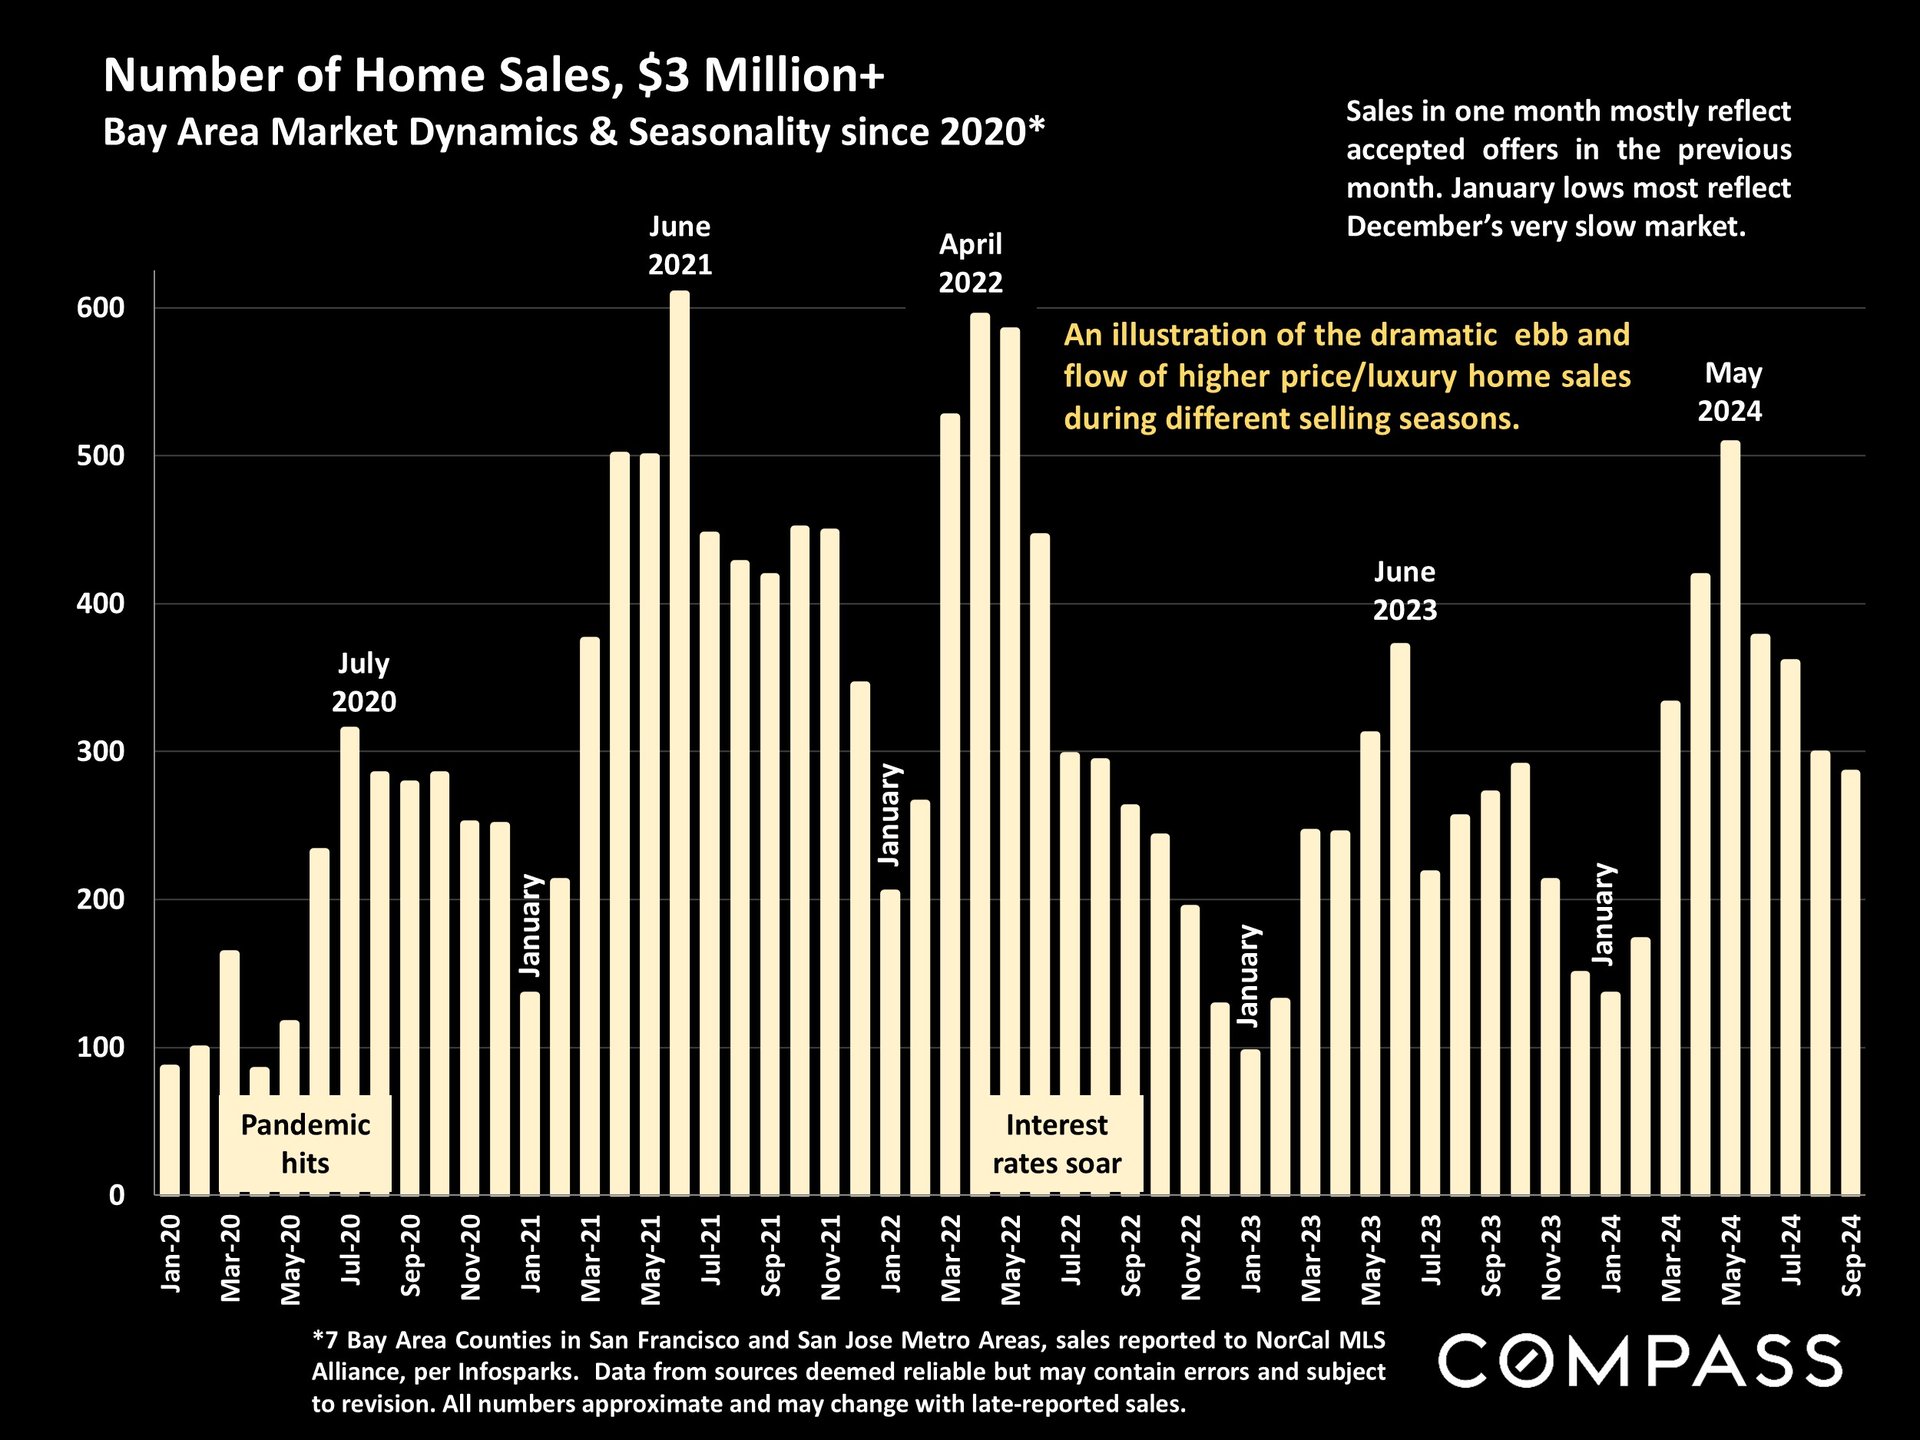
Bar chart of Bay Area $3M+ home sales from 2020 to 2024, with seasonal peaks.

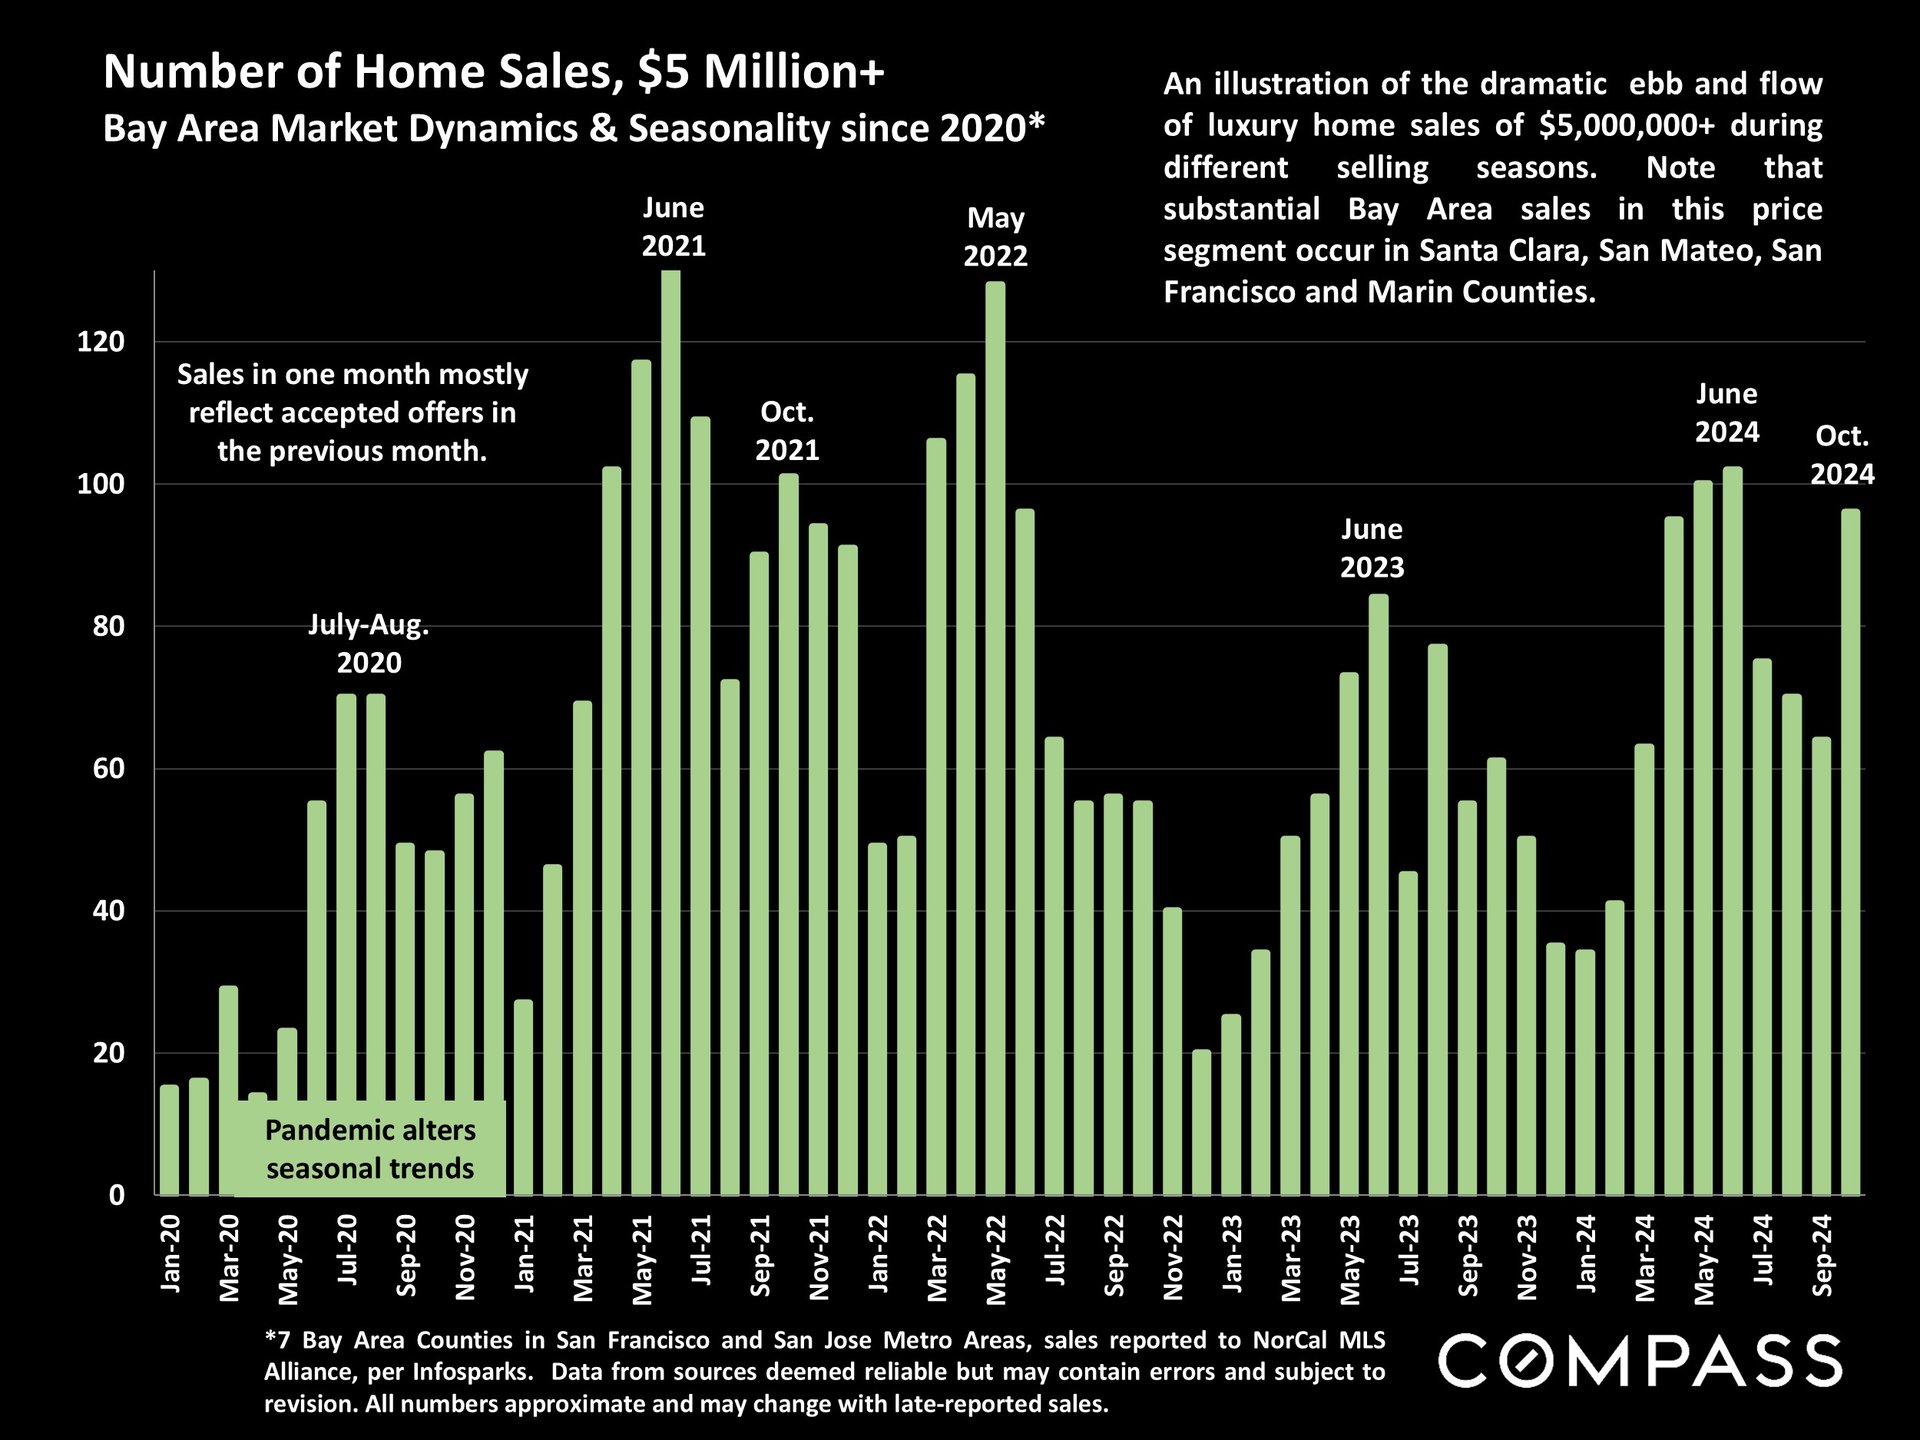
Chart of monthly Bay Area home sales over $5 million, showing seasonal peaks from 2020 to 2024.

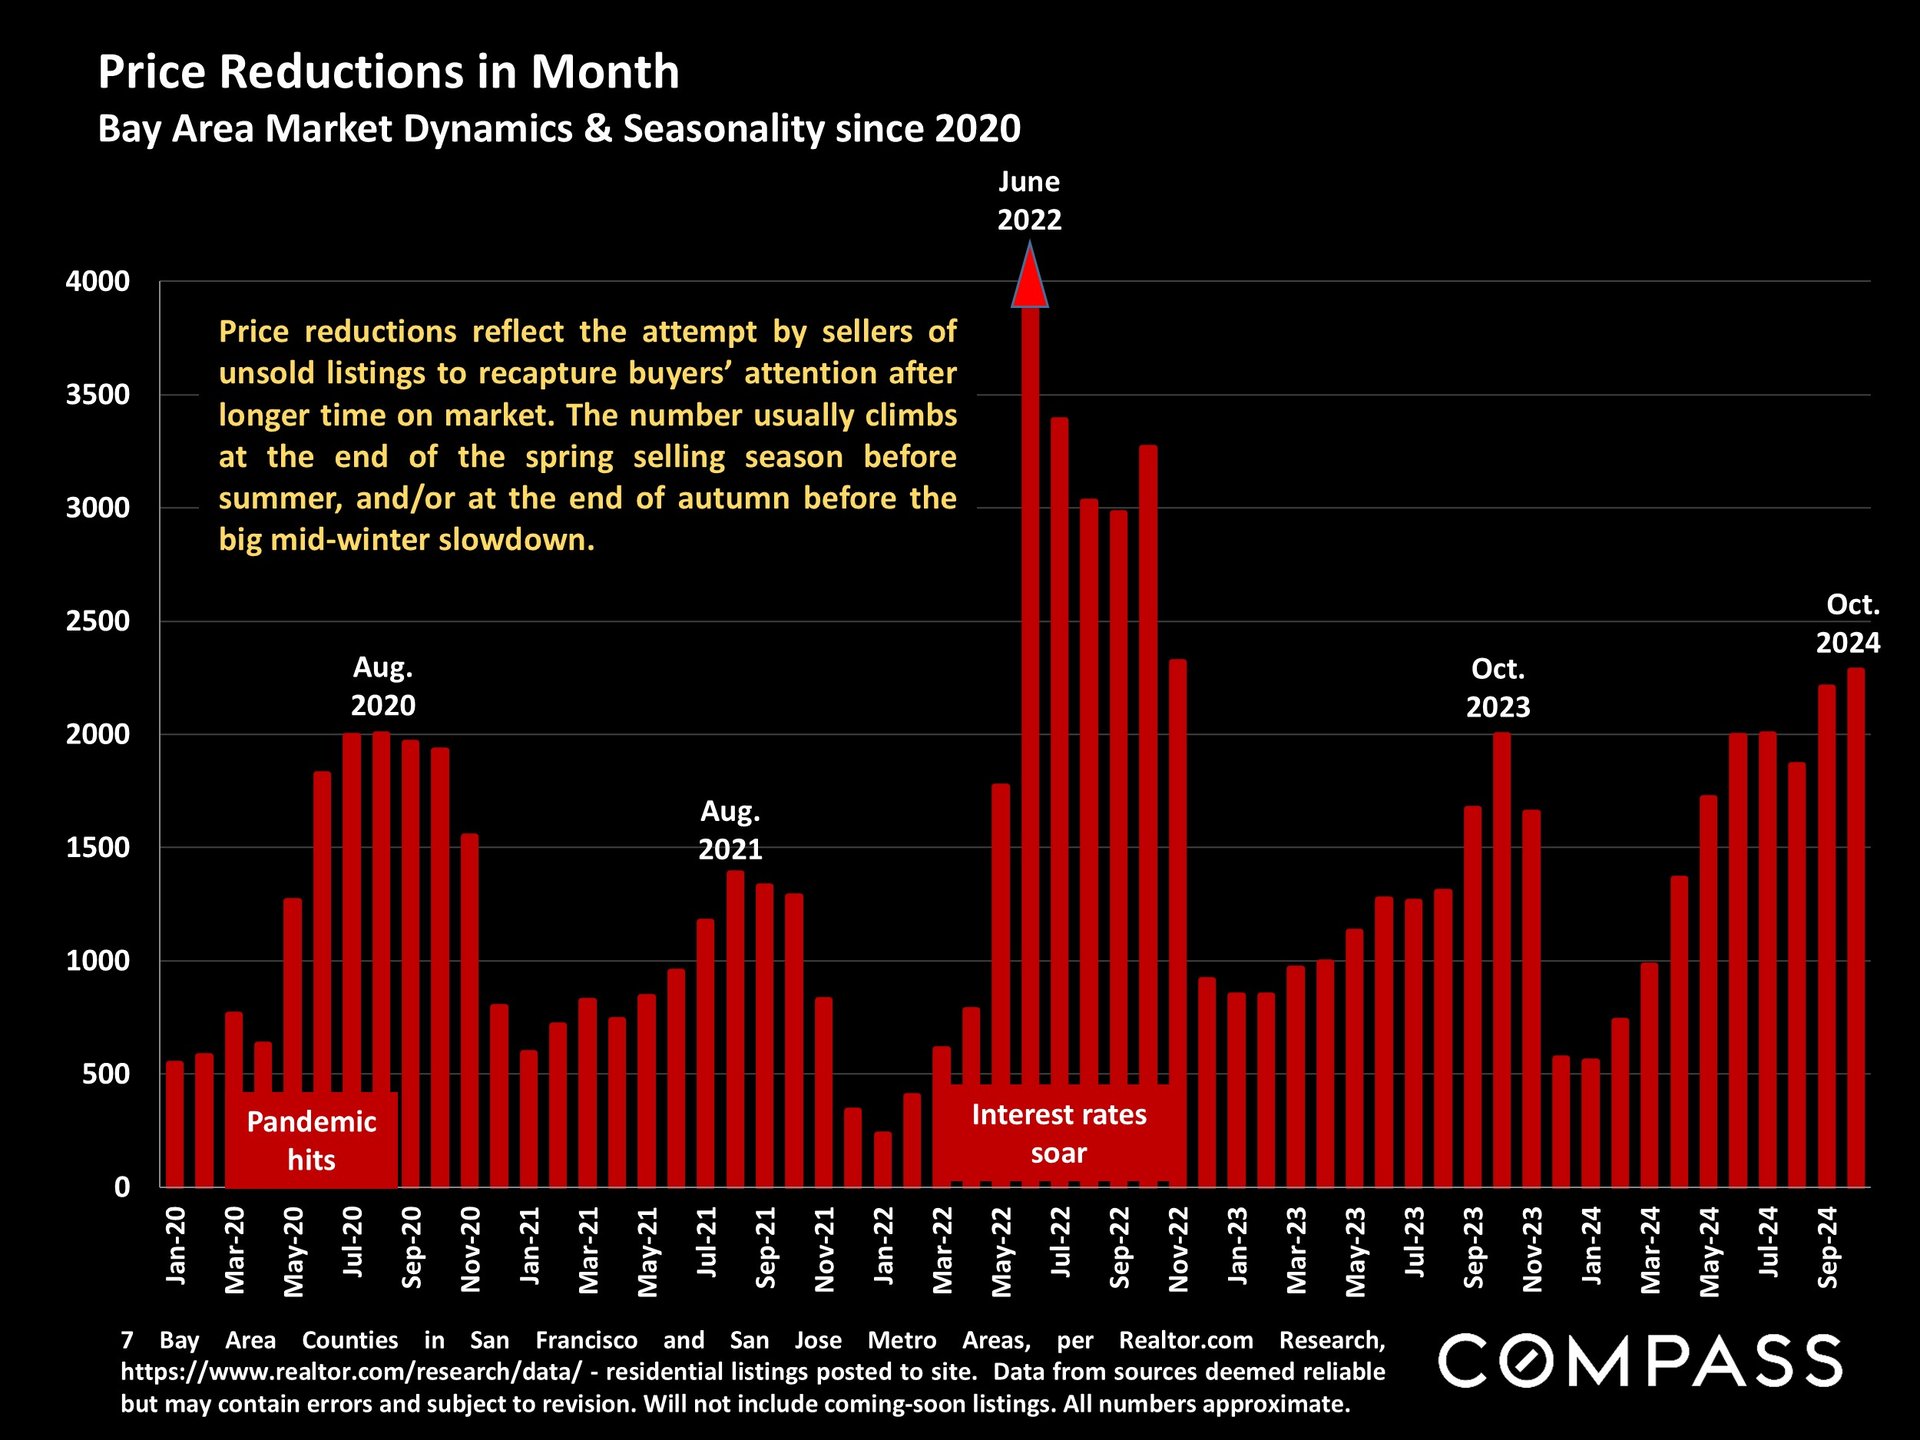
Bar chart of monthly Bay Area home price reductions from 2020 to 2024, peaking in June 2022.

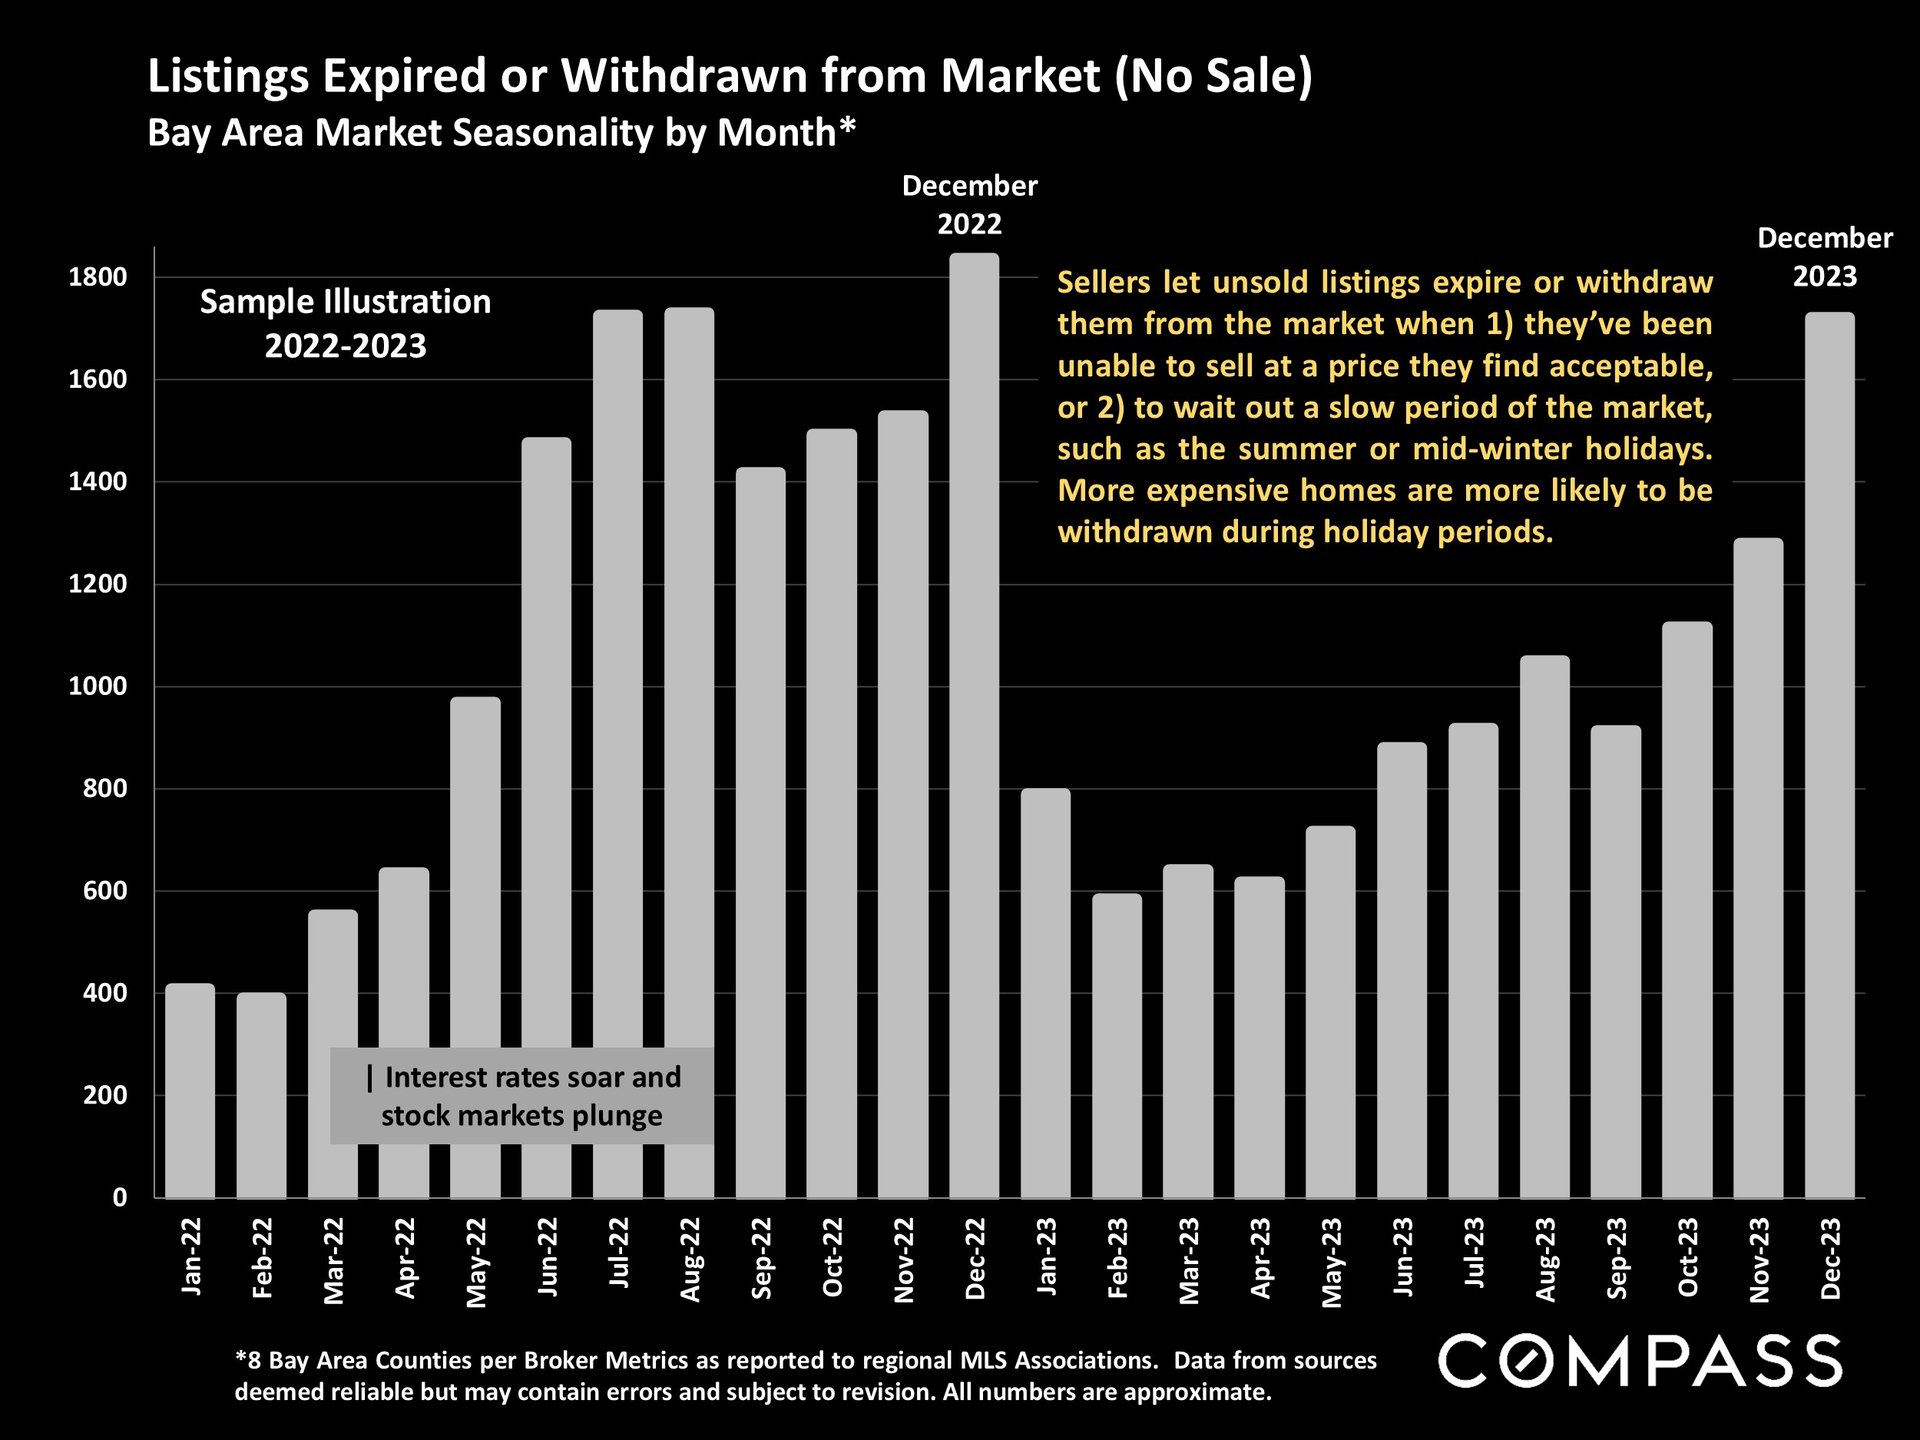
Bar chart of Bay Area listings withdrawn or expired without sale by month, with peaks in December 2022 and 2023.

Market report notes explain statistics and median sales price, followed by Compass legal disclosures.
Alexander Lurie smiling in a dark blazer and striped shirt.

Meet Alexander

Meet Alexander Lurie

Alexander Fromm Lurie is a highly accomplished San Francisco real estate professional and the leader of The Lurie Group, a top-performing team recognized among the top 1% of agents in the city. With over a decade of experience in the real estate industry and California DRE License #01952347, Alexander has built a reputation for delivering exceptional results, with hundreds of homes sold and over $1 billion in total sales volume. Born and raised in San Francisco, he brings deep local expertise, generational knowledge of the Bay Area, and a strong connection to the community into every client relationship. His approach goes beyond transactions—focusing on helping clients build meaningful connections to neighborhoods, schools, and local culture while navigating the buying or selling process with confidence.

Alexander’s background in management consulting and entrepreneurship further strengthens his strategic approach to real estate, allowing him to provide clients with a competitive edge in pricing, negotiation, and marketing. Known for his integrity, discretion, and client-first mindset, he continues to be a trusted advisor for buyers, sellers, and investors across San Francisco’s dynamic real estate market.

Alexander Lurie

Founder | Real Estate Advisor
LICENSE NUMBER
01952347
ADDRESS
629 Divisadero Ave, San Francisco, CA 94117

Let's Work Together

Our passion is supporting clients who value exceptional results and client care. We look forward to the opportunity to work together.
Modern condo living and dining area with a geometric chandelier and Bay Bridge views through large windows.
link
Follow Us