
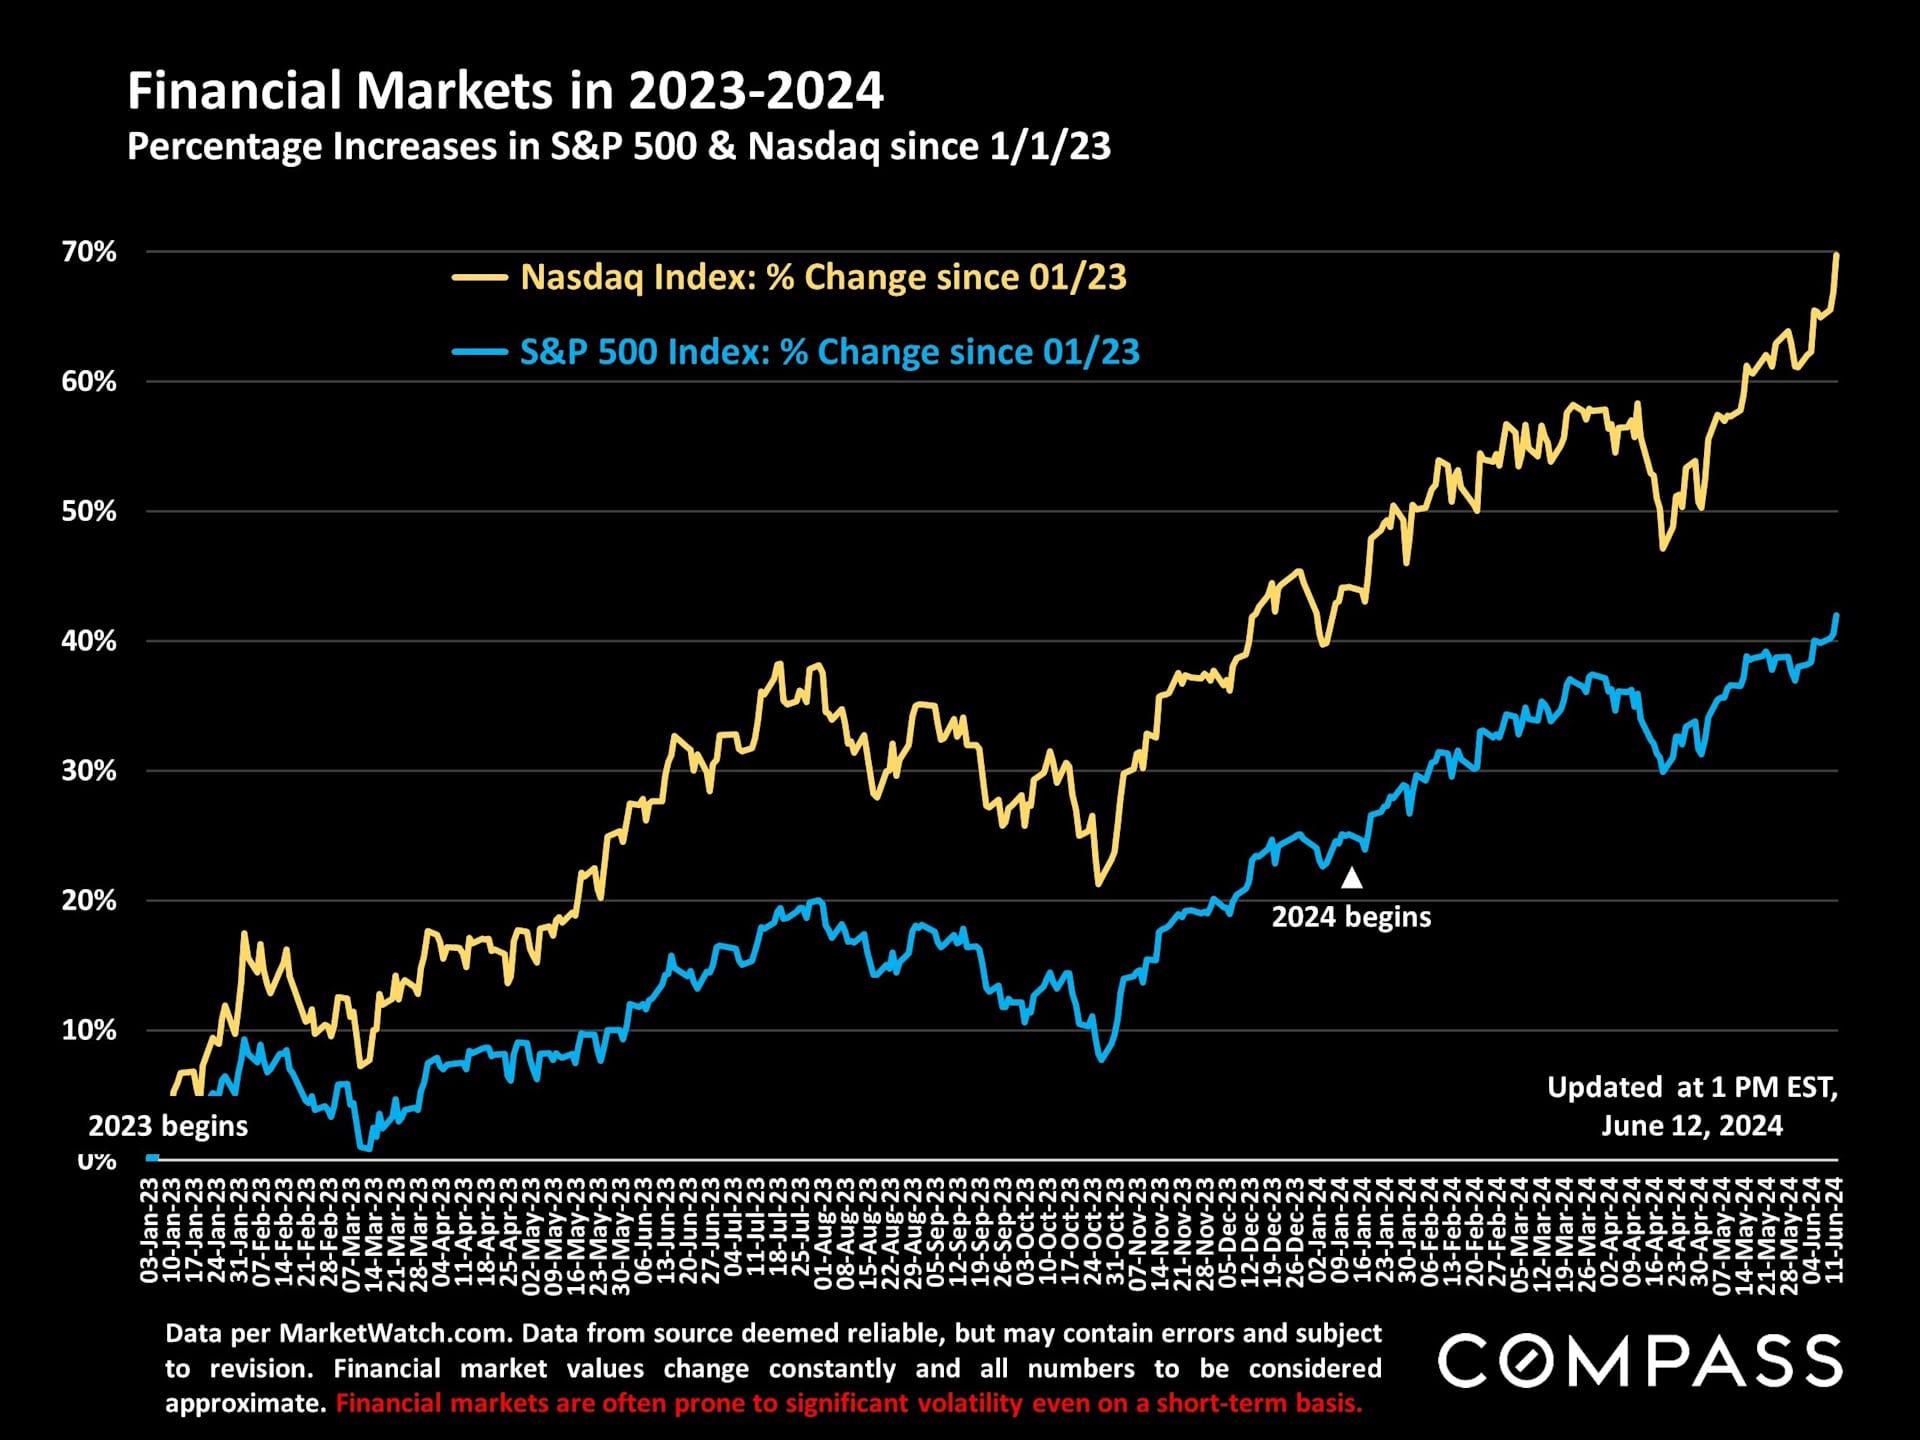
The May inflation rates, posted on June 12, showed a slight decline.
The "core" inflation reading was the lowest in 2 years, though still above the Fed's 2% target.
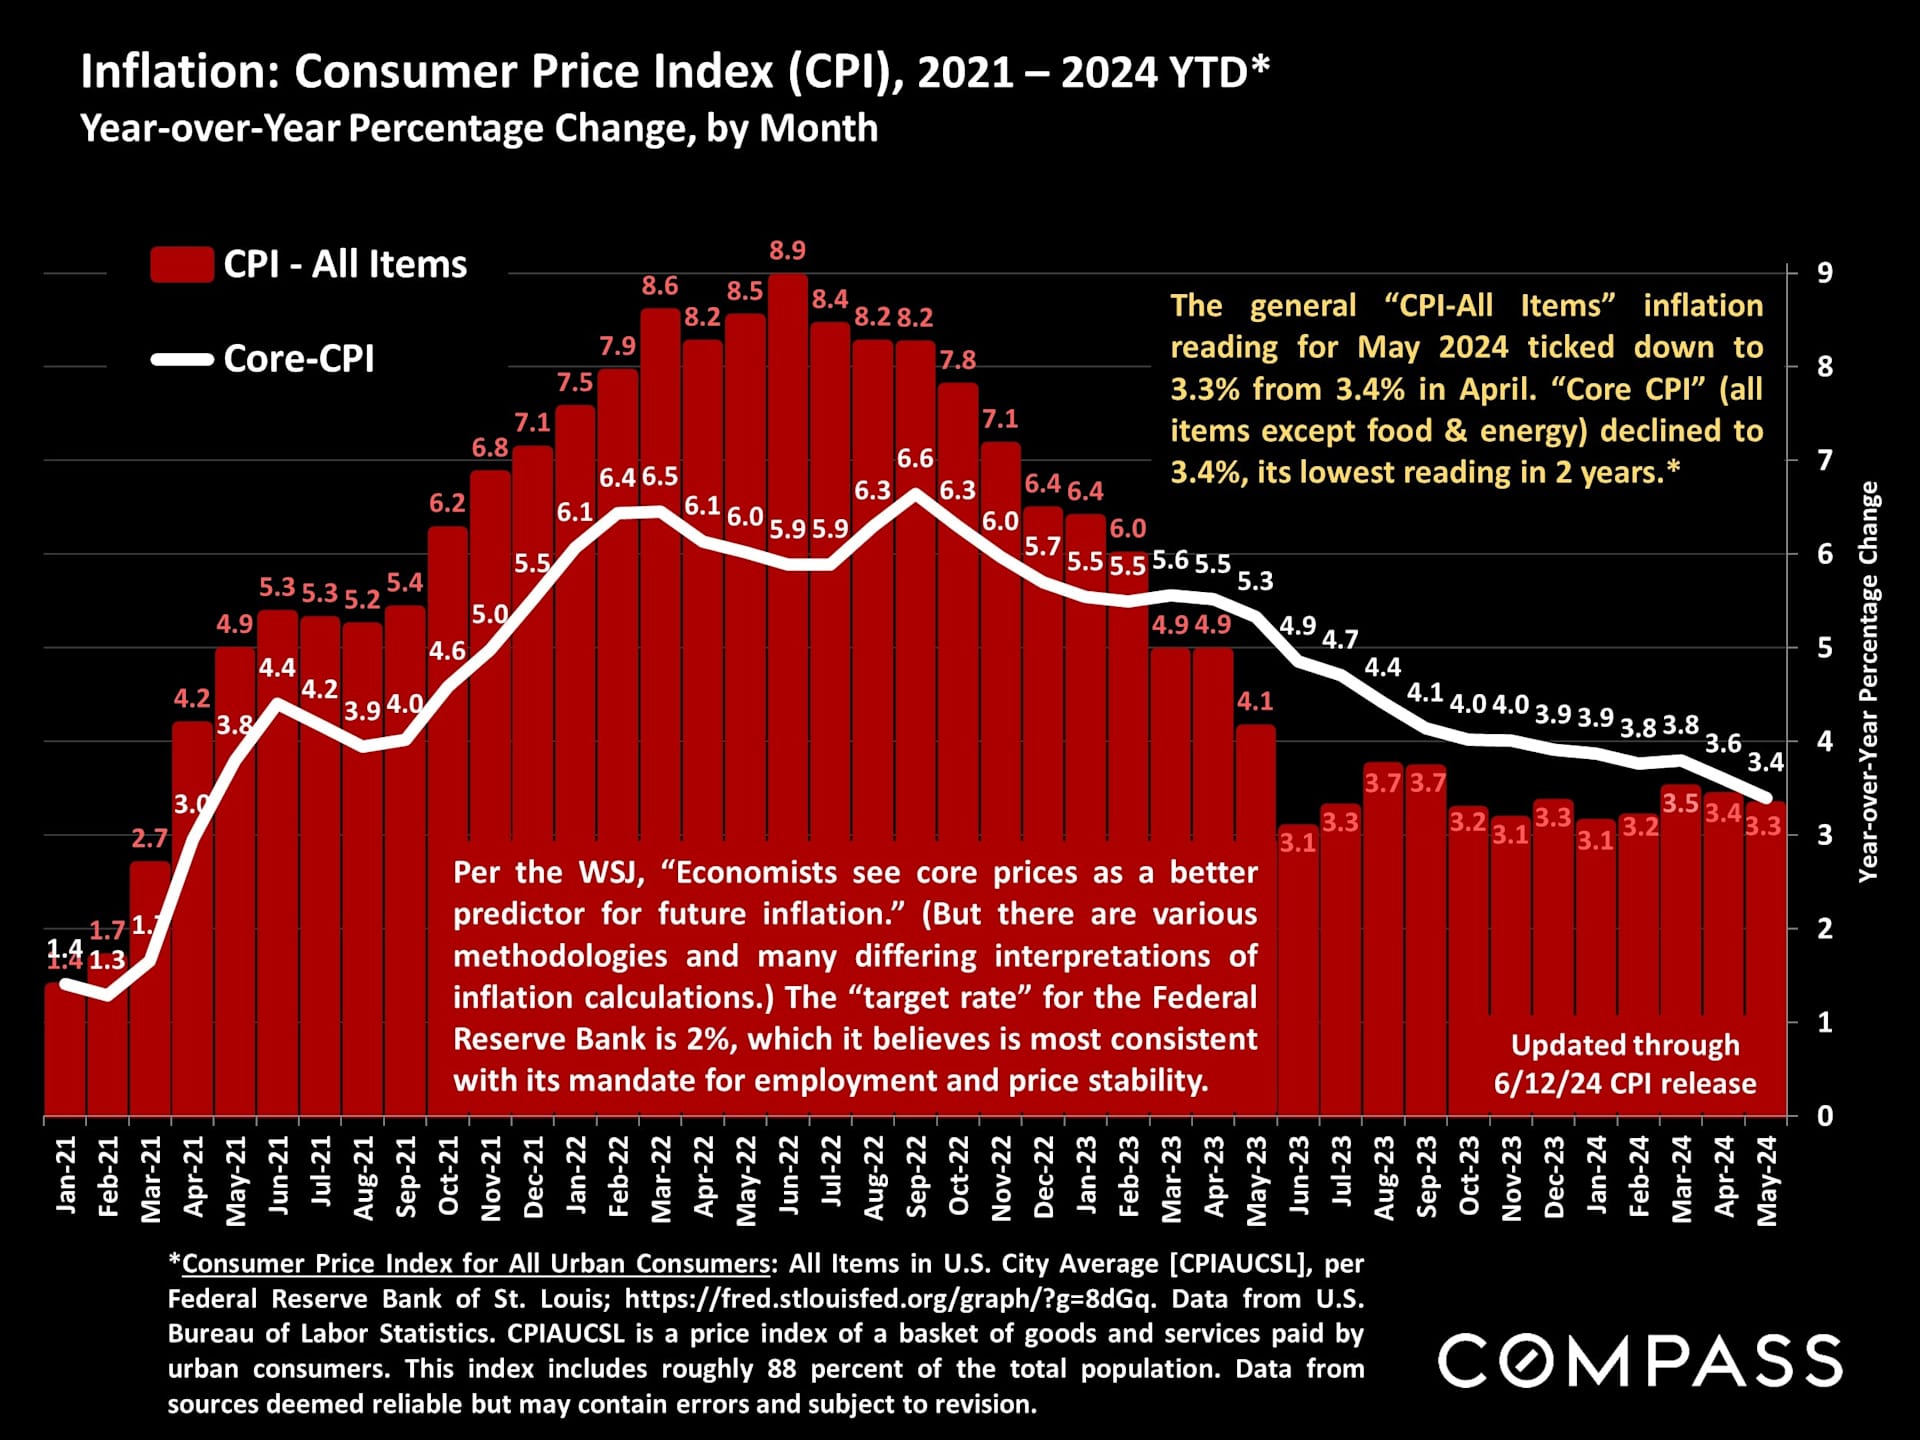
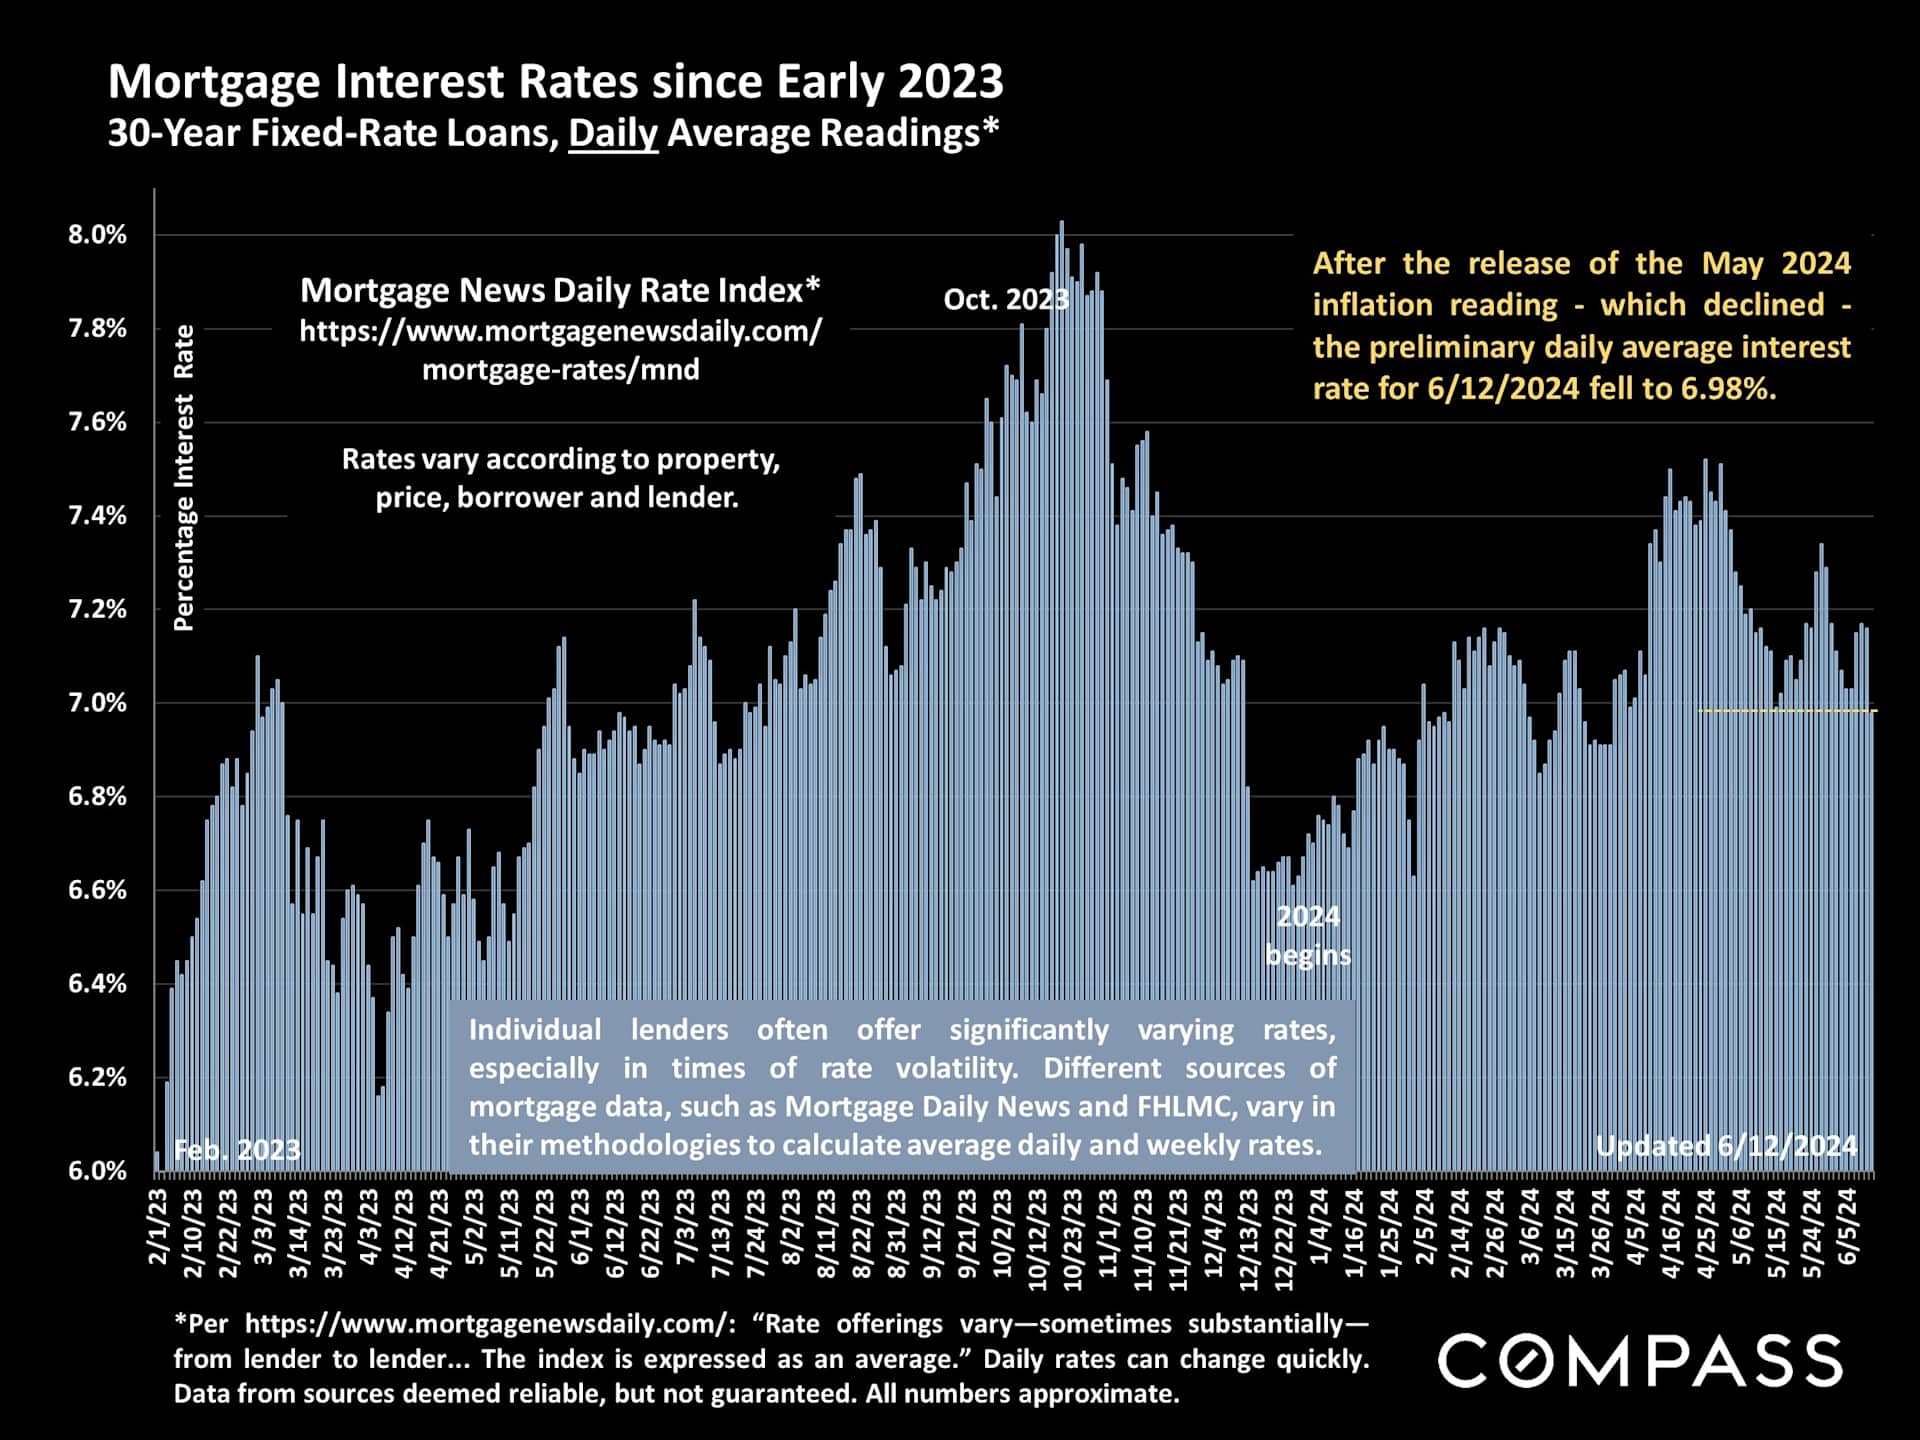
Stock markets reacted with rapture. A drop in inflation encourages hopes for earlier Fed reductions in their benchmark rate - though these predictions can change daily, optimistic and pessimistic in turn. Still, stock markets continue to hit dramatic new highs, a big factor in real estate markets, especially more affluent markets.
Some overview data and charts on general Bay Area market dynamics (which vary by county - see new June reports for specifics): Generally speaking, these dynamics on new, active and sold listings, and price reductions are also occurring nationally.
Bay Area: Year-over-year changes, comparing May 2024 with May 2023:
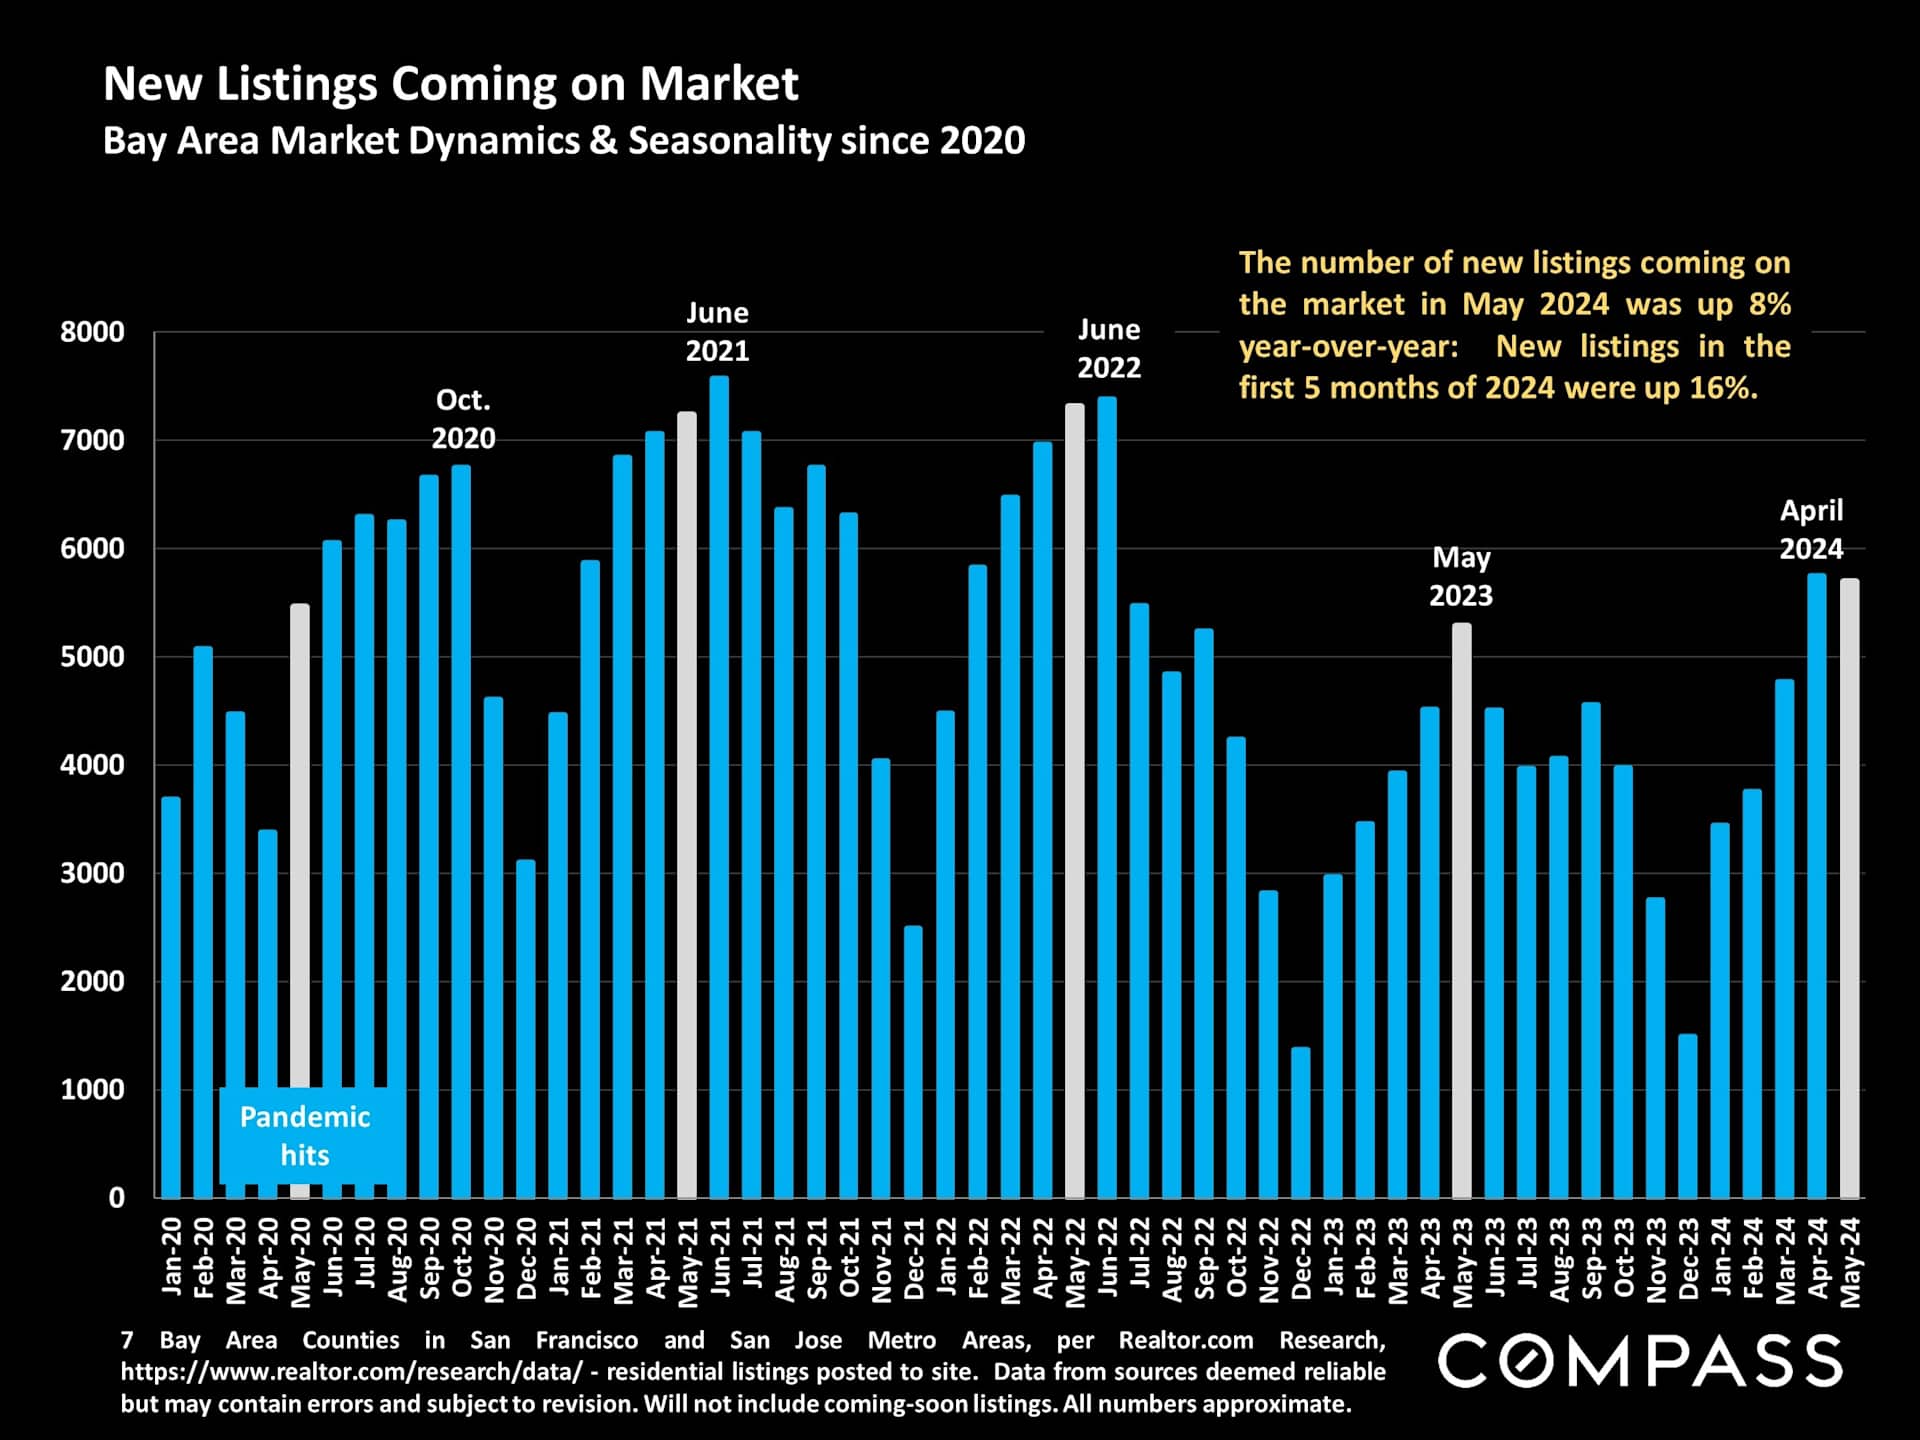
- The number of new listings coming on market: +8%
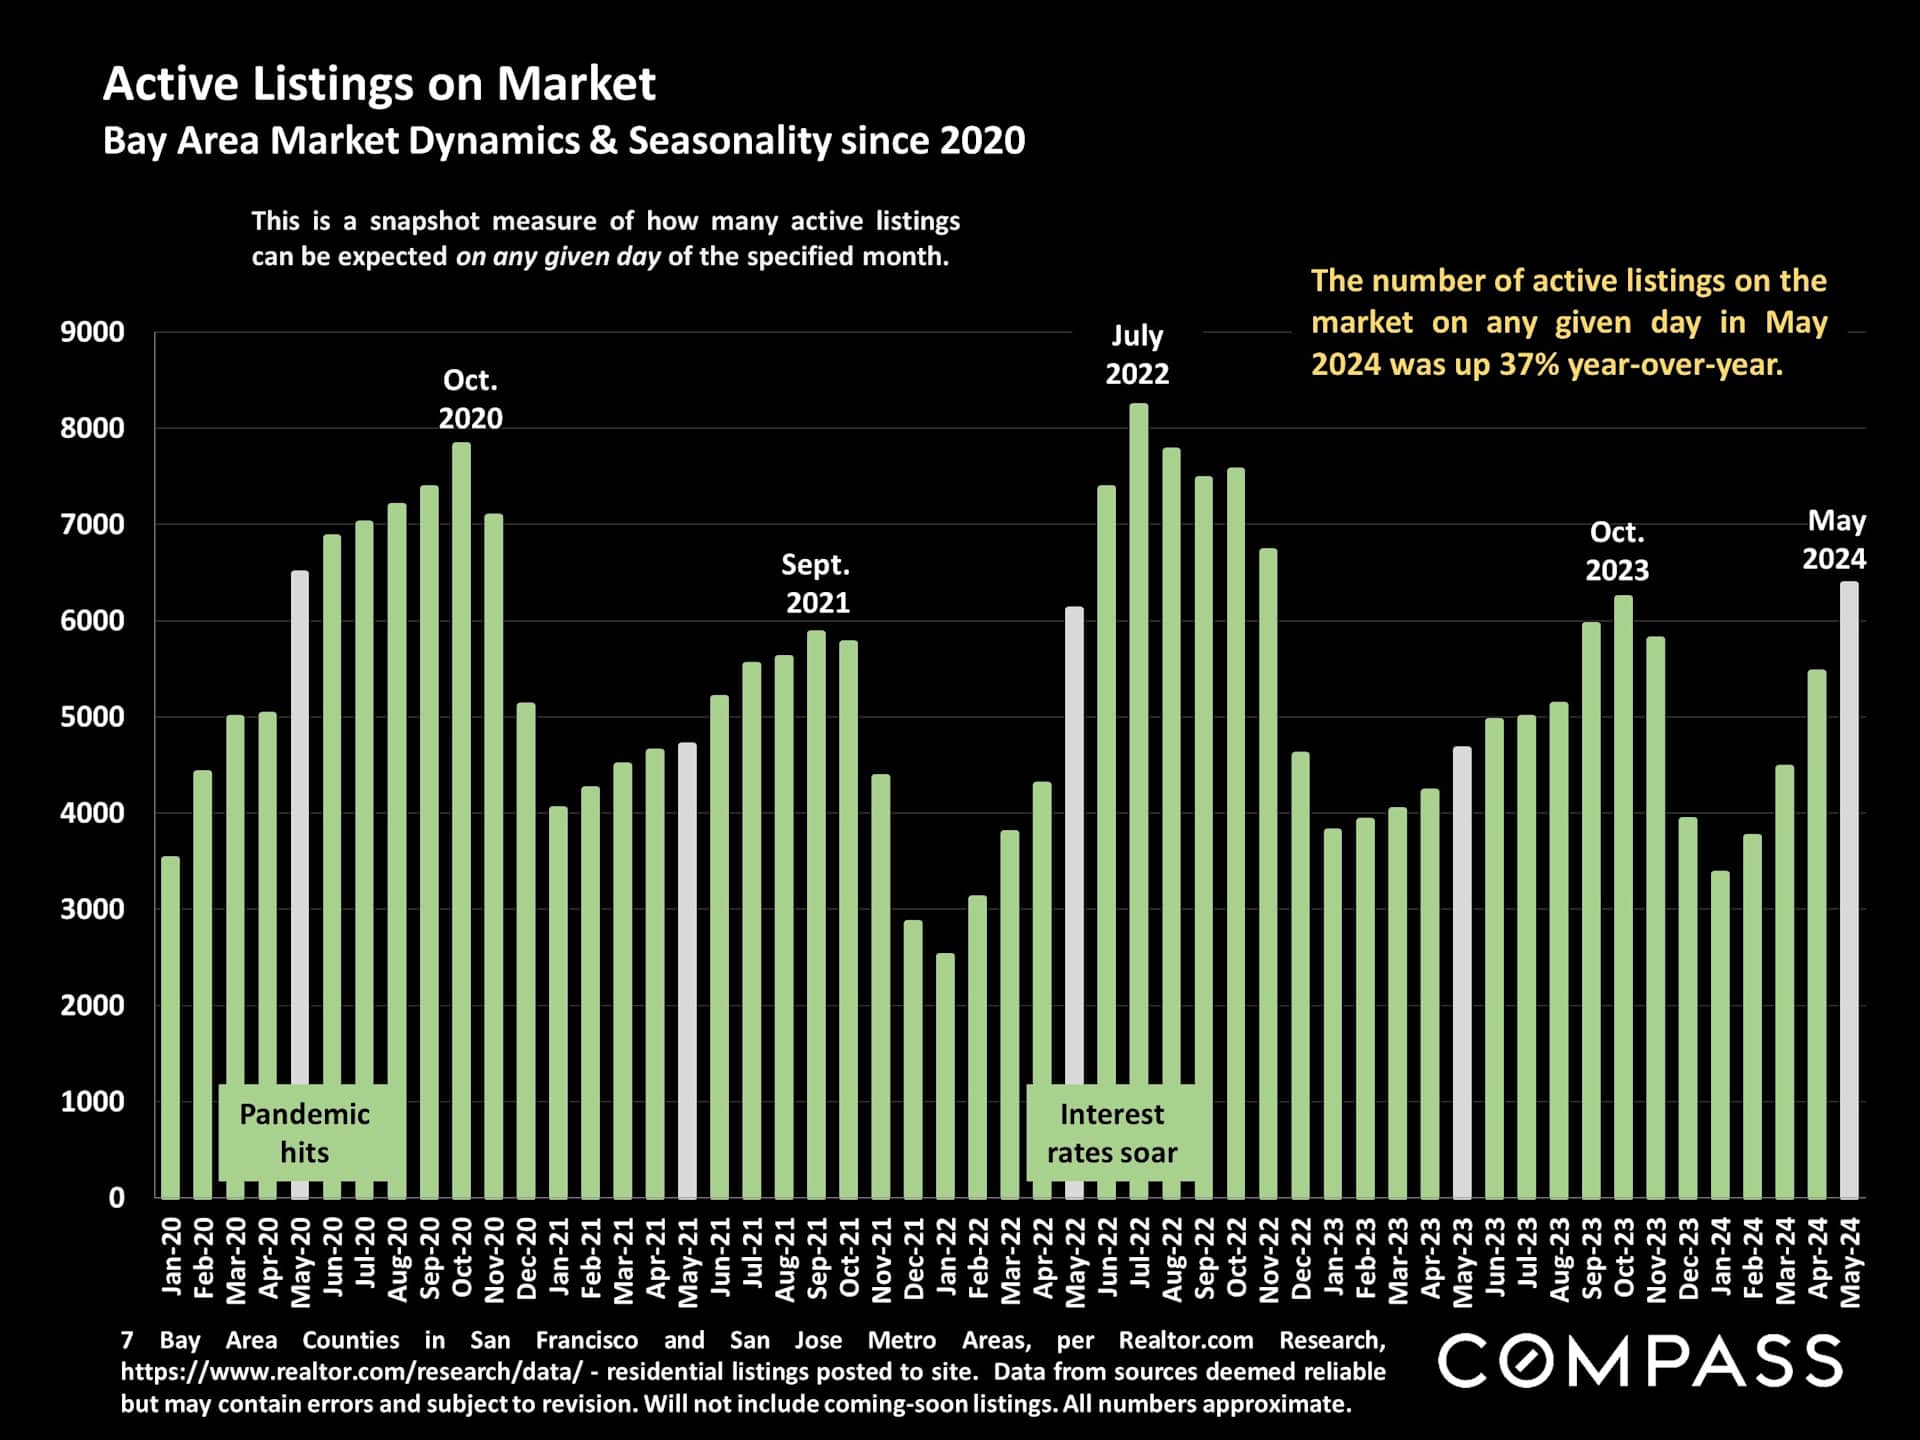
- The number of active listings on a given day: +37% - buyers have more choice
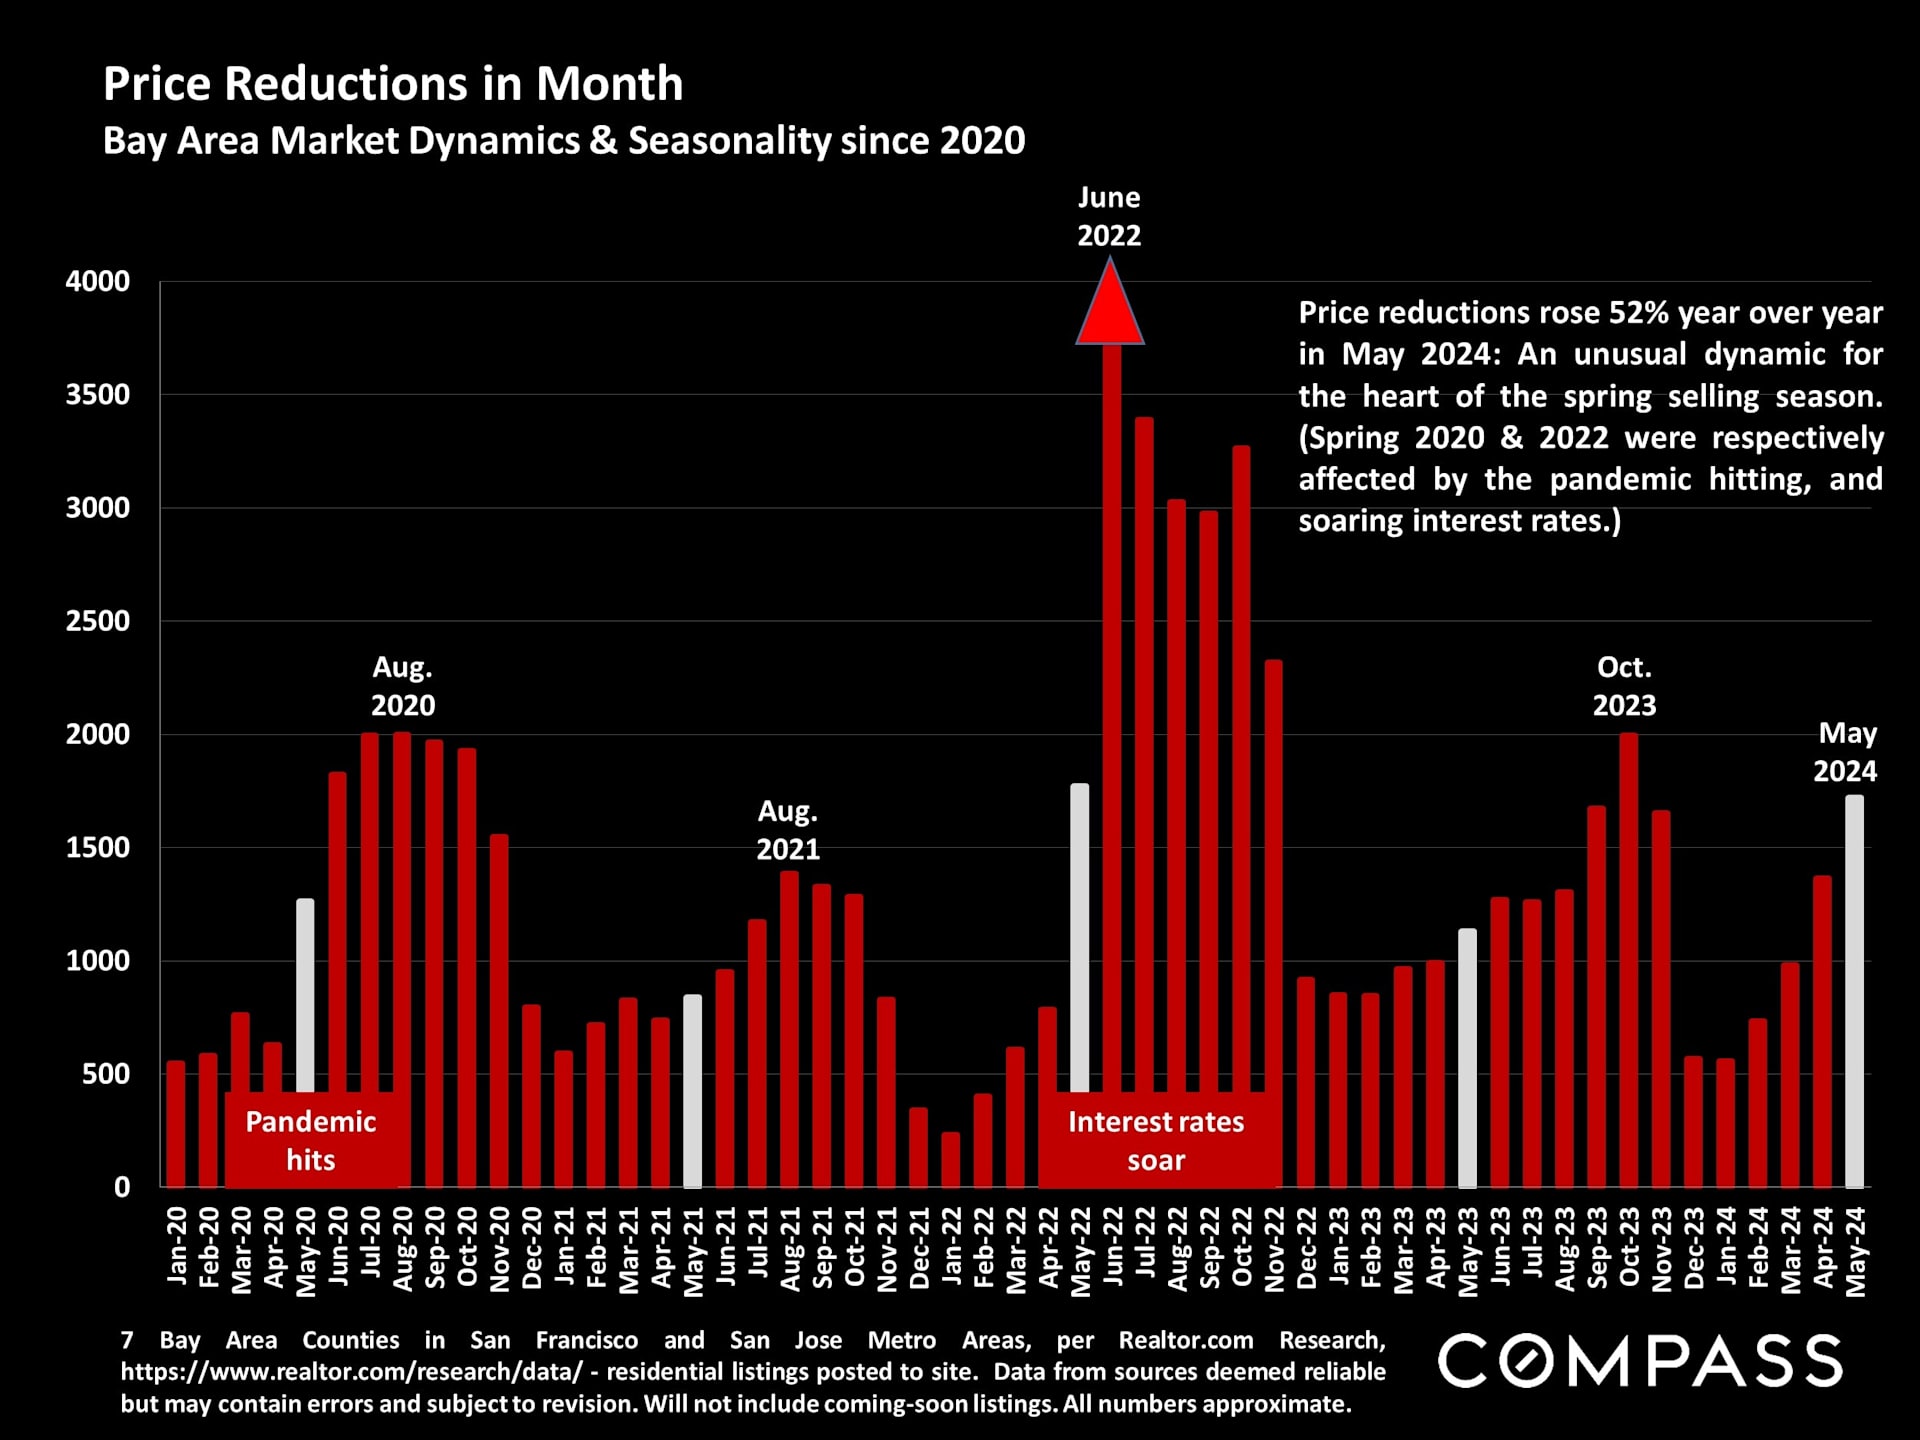
- The number of price reductions: +52% - an unusual dynamic for the heart of spring selling season. (Some markets have seen price reductions more than double year over year.)
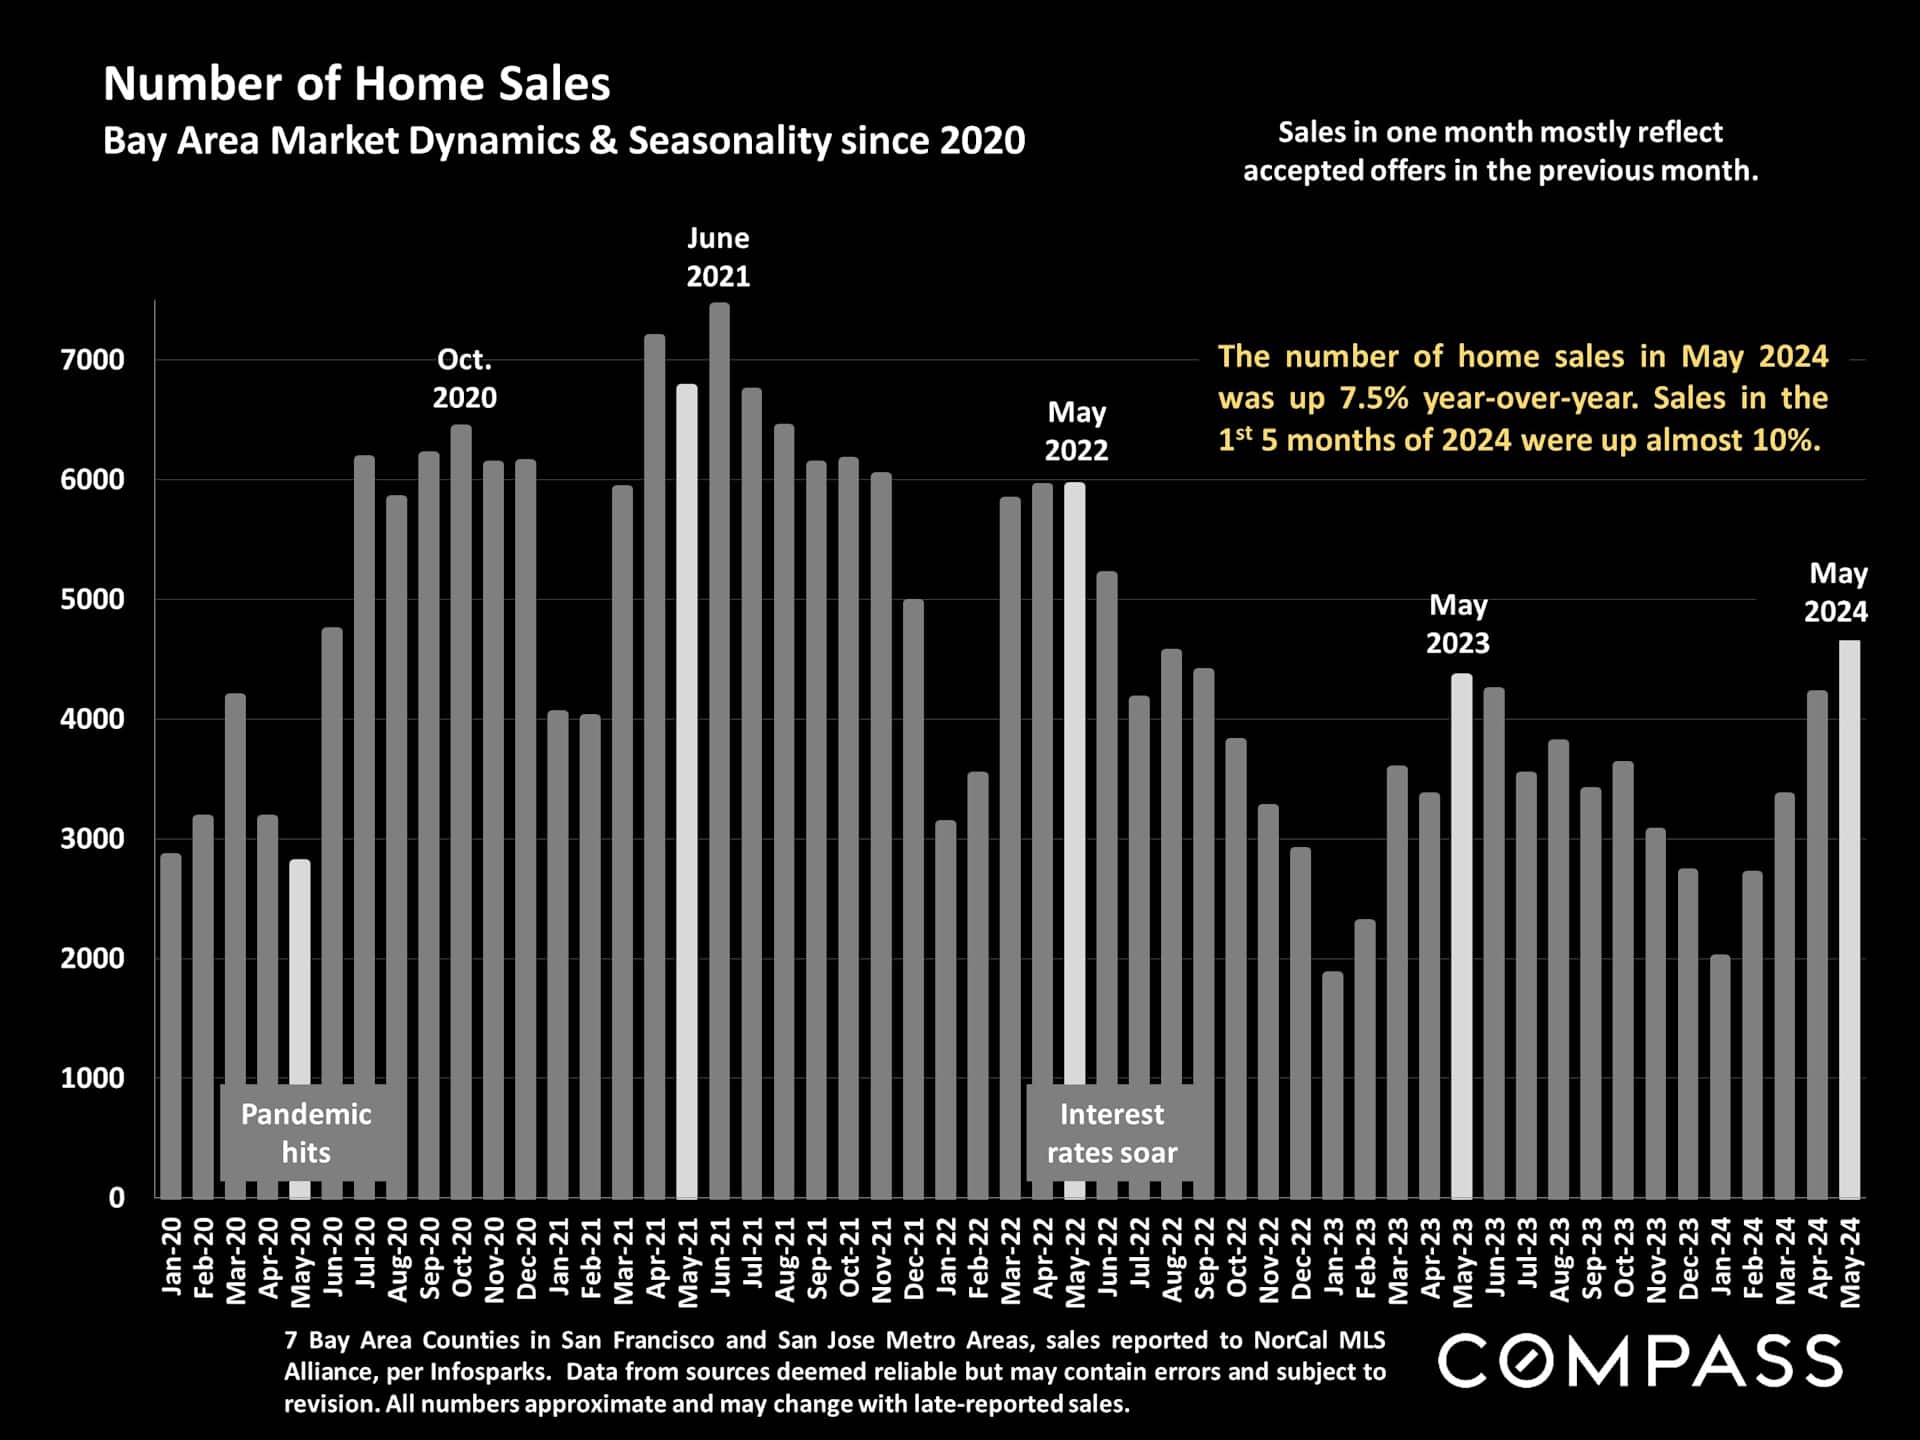
- The number of home sales: +7.5%
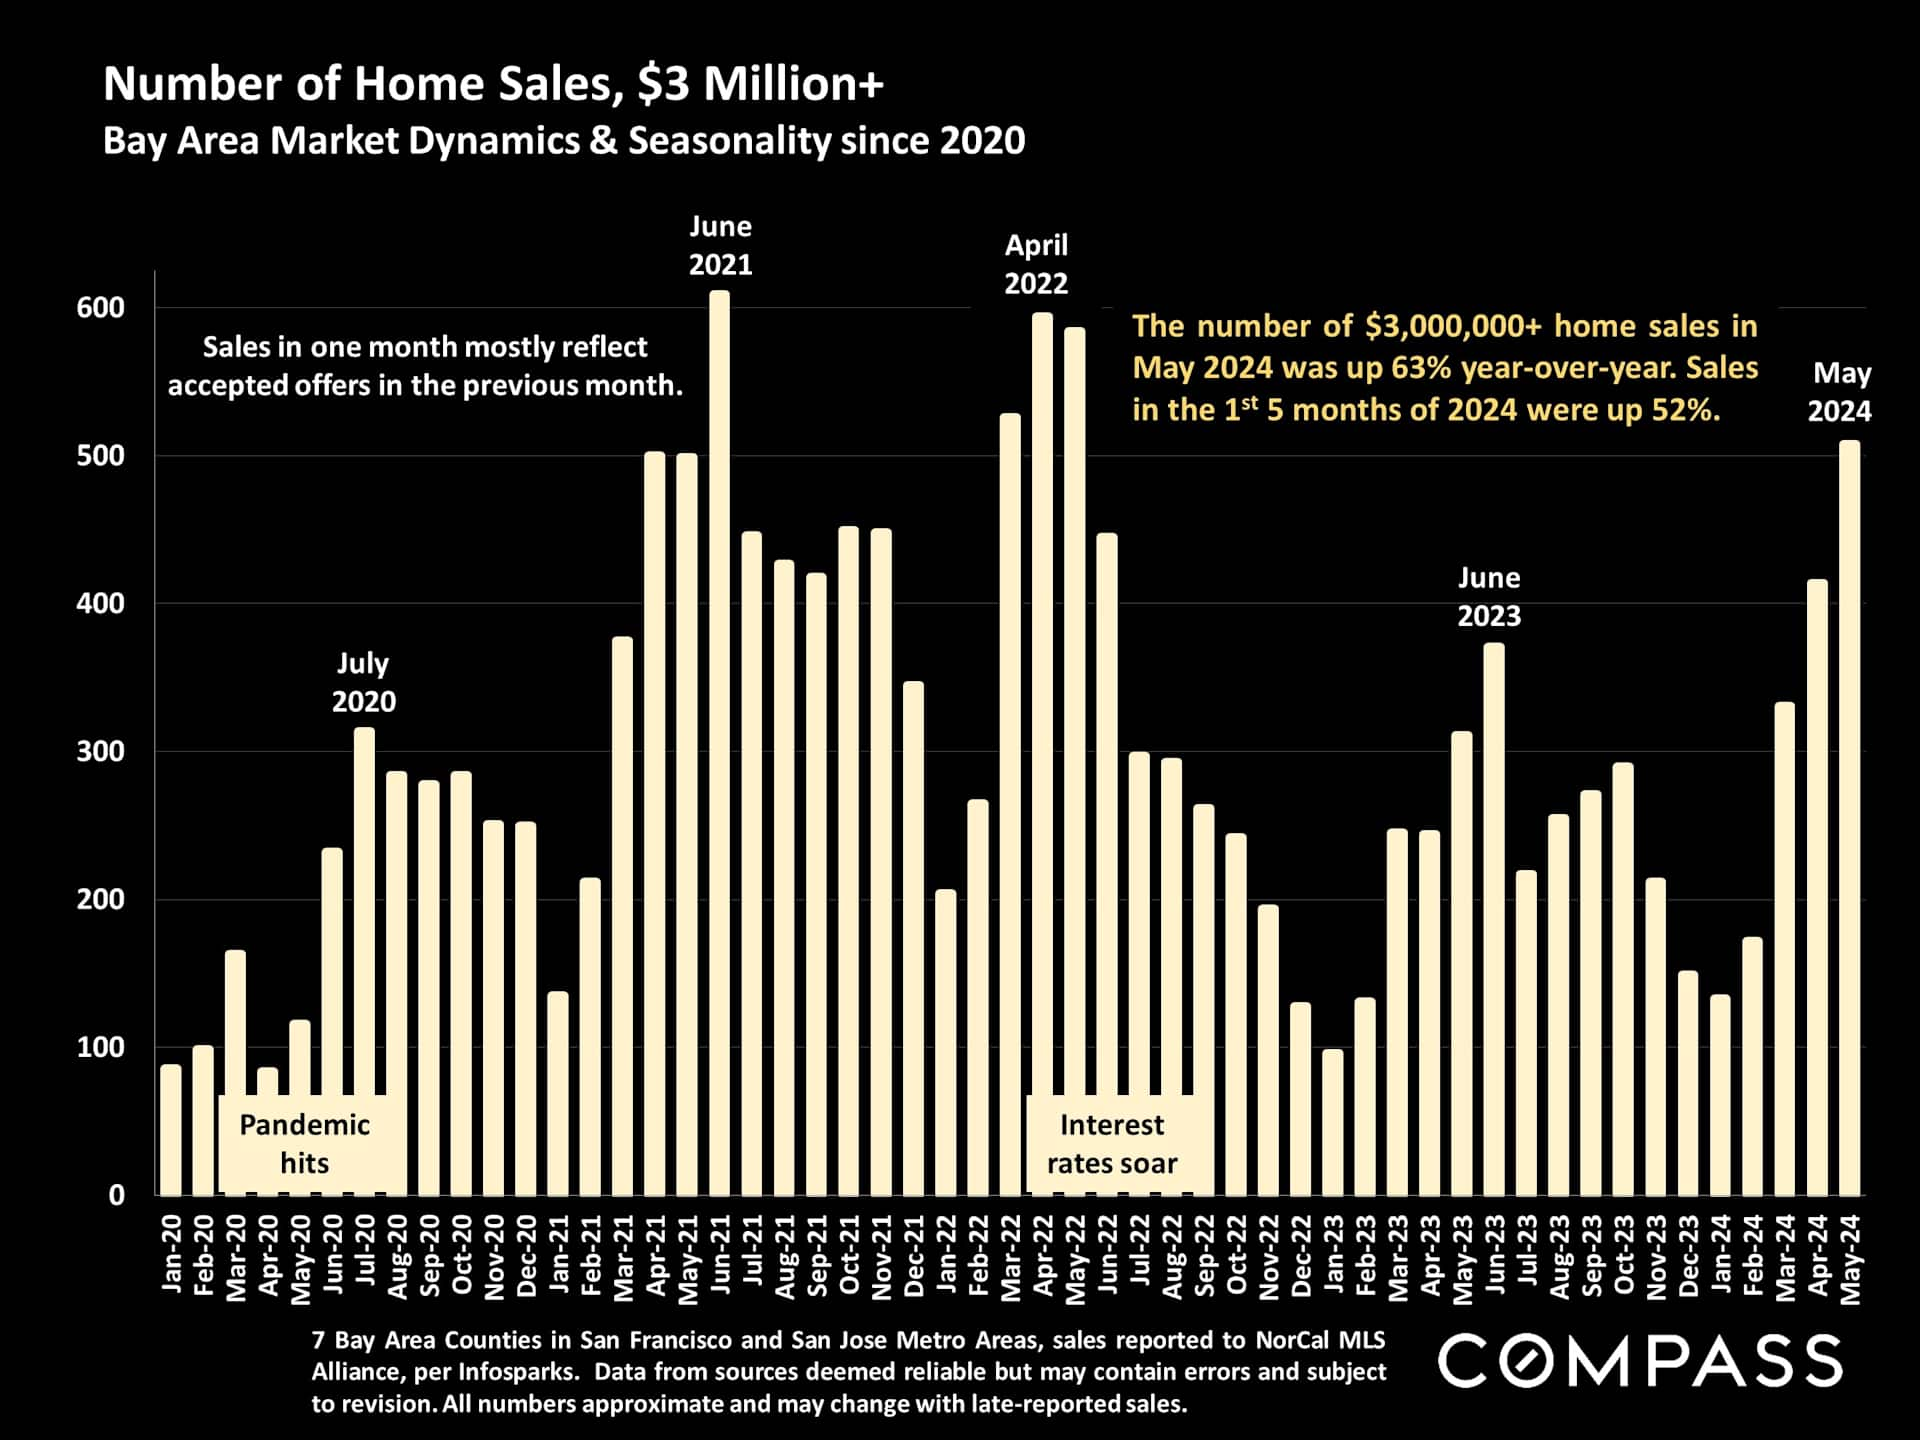
- The number of homes sales, $3 million & above: +63% - higher price and luxury home sales dramatically outpacing the general market
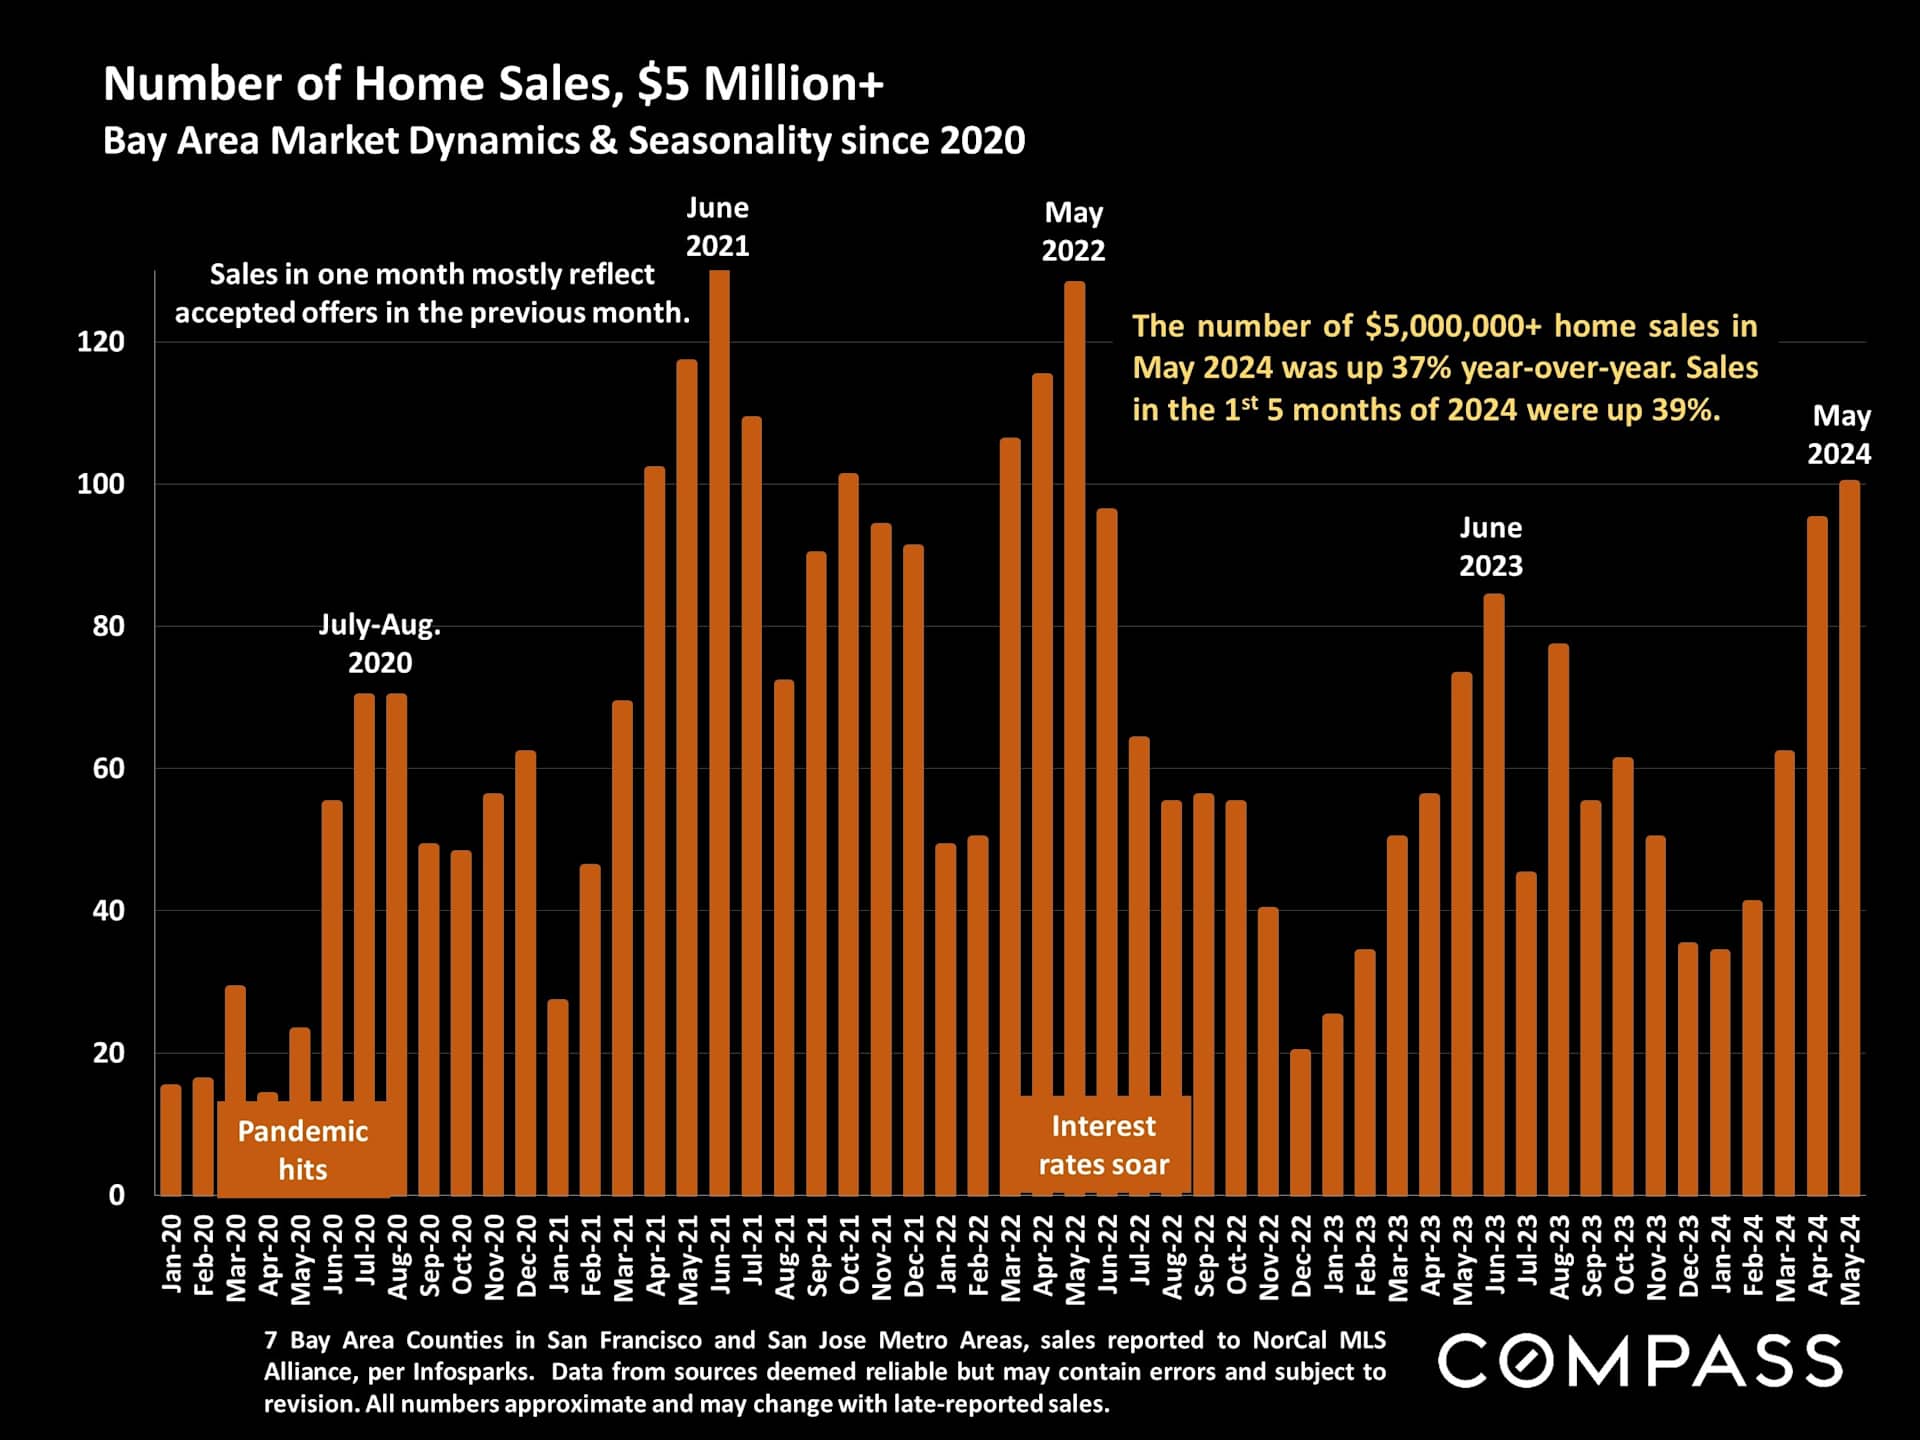
- The number of home sales, $5 million & above: +37%
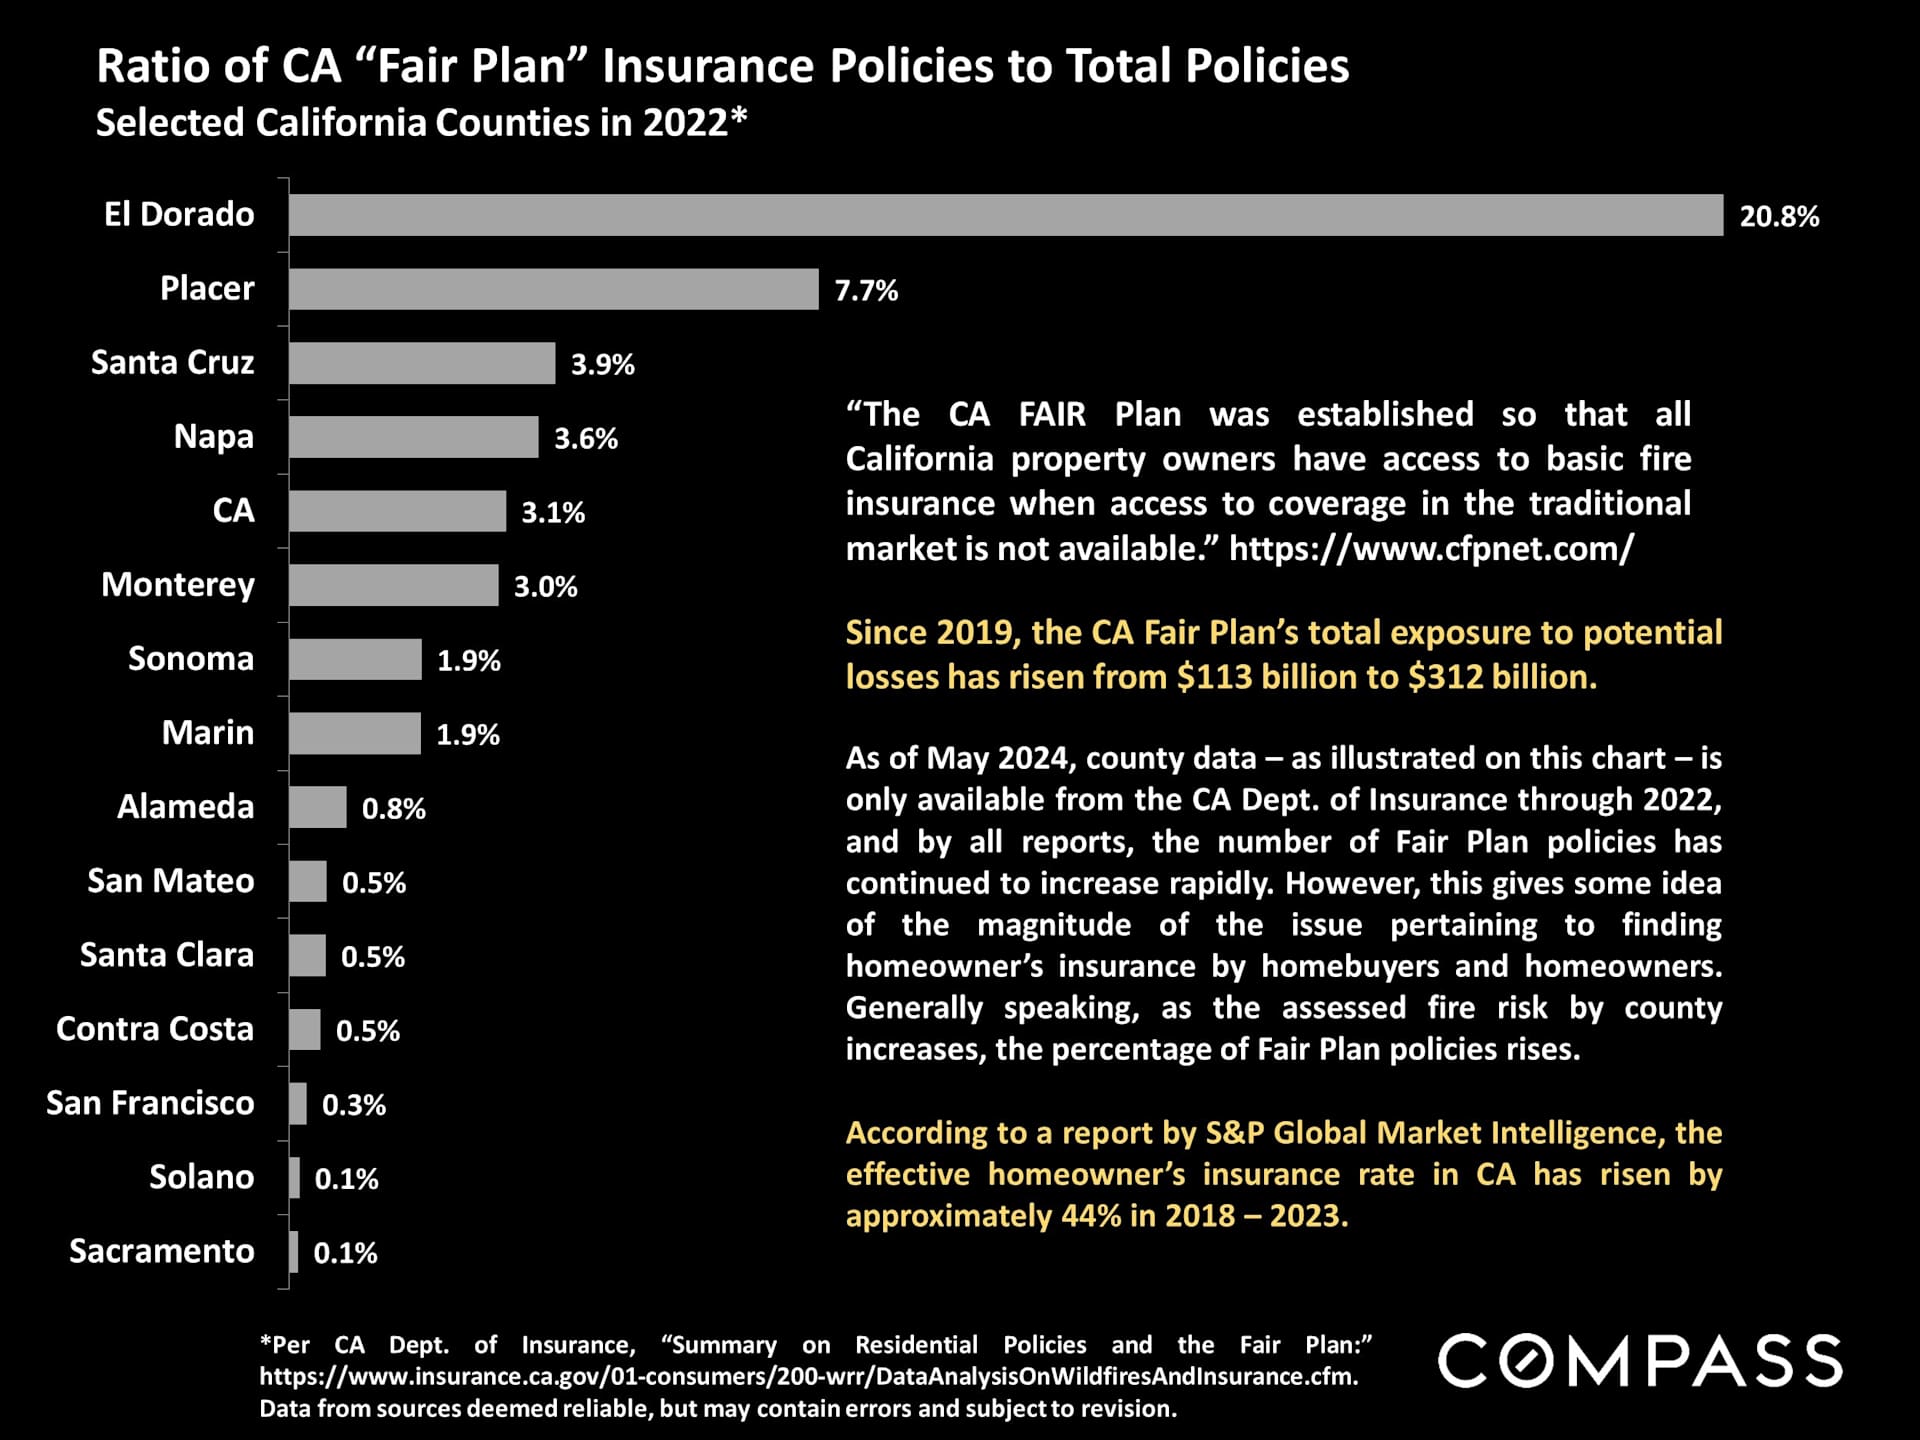
CA Dept. of Insurance published county data on Fair Plan policies for 2022 (and we know things only got worse in 2023). The Fair Plan website has data on the rise in Fair Plan financial exposure to potential losses across the state, 2018 through 2023: +176%.
A new census map was just published showing the latest 12-month population changes for the 15 largest cities of each state. Hover your cursor above the state to pull up the table of 15 cities. Link to Map.