

The Lurie Group
One Year After the Pandemic Hit

One Year After the Pandemic Hit

  • The Lurie Group
  • April 16, 2021

A hiker looks toward the Golden Gate Bridge emerging from fog beyond green San Francisco hills.


Cover of a 2021 San Francisco Bay Area real estate survey, featuring the Golden Gate Bridge and pandemic recovery title.

 
Bay Area real estate market highlights beside a labeled satellite map of the San Francisco region.
 
Chart of Bay Area median home prices from 1990 to 2021, showing a sharp rise after the pandemic began.
 
Chart of monthly Bay Area home sales, showing a sharp spring 2020 drop and strong recovery.
 
Chart of Bay Area $2 million-plus home sales, with monthly trends from 2019 through February 2021.
 
Bar chart comparing Bay Area house sales by county before and after shelter-in-place, with sales increases in every county.
 
Chart comparing 2020 and 2021 median home prices across 11 Bay Area counties, with year-over-year gains.
 
Chart compares Bay Area county median home values per square foot in early 2020 and 2021; Monterey rose 29%.
 
Chart comparing 2020 and 2021 median two-bedroom condo sale prices across seven Bay Area counties.
 
Chart comparing condo sales before and after shelter-in-place across 11 Bay Area counties; sales rose 4% overall.
 
Infographic explaining Bay Area luxury home sale price ranges by county and the rise in higher-priced sales after the pandemic began.
 
Bar chart comparing Bay Area luxury home sales by county before and after shelter-in-place.
 
Chart comparing ultra-luxury home sales by Bay Area county before and after shelter-in-place, with increases across all areas.
 
Bar chart of Bay Area home sales above $5 million by county; San Mateo County leads with 215 sales.
 
Bay Area infographic comparing 12 highest-price sales with 12 highest-priced active listings in March 2021.
 
Chart comparing active home listings and months of inventory supply across Bay Area counties in March 2021.
 
Chart tracking Bay Area unsold housing inventory from 1992 to 2020, with market events and a pandemic marker.
 
Bar chart compares sale-to-list percentages across 11 Bay Area counties, from 99.7% in Monterey to 107.2% in Alameda.
 
Bay Area home days-on-market chart from 1992 to 2020, with the pandemic-era figure reaching a 30-year low.
 
Bar chart of Bay Area median days on market, led by Napa at 43 days and ending with Santa Clara and Contra Costa at 10.
 
Chart of quick home sales by Bay Area county, comparing houses and condos during the first pandemic year.
 
Chart of Bay Area housing affordability from 1991 to 2020, with recession, boom, and recovery annotations.
 
Slide previews Bay Area housing market graphs and tables, alongside a winding road through sunlit hills.
 
Line chart of Bay Area county home prices, 1990–2020, showing rising prices and the pandemic-era market.
 
Chart of Bay Area county home prices, 1990–2020, showing the housing crash and post-2012 recovery.
 
2020 Bay Area median house values by market area, with sale prices, price per square foot, and house sizes.
 
2020 Bay Area median house values by market, with sale prices and home sizes.
 
2020 Bay Area median house values by market area, with sales prices, price per square foot, and home sizes.
 
Table of 2020 Bay Area median home values by market area, including sale prices, price per square foot, and home size.
 
2020 Bay Area median house values table listing market areas, counties, sale prices, price per square foot, and home sizes.
 
Table comparing 2020 median home prices, price per square foot, and sizes across Bay Area markets.
 
2020 Bay Area median house values by market area, with sales prices, price per square foot, and house sizes.
 
Chart of 30-year mortgage rates, declining from late 2018 highs to a January 2021 low before rising.
 
Chart of Bay Area employment from 2000–2020, showing pandemic job losses and recovery through December 2020.
 
Chart of Bay Area county unemployment rates, showing a sharp pandemic-era spike in spring 2020.
 
Bar chart comparing Bay Area county populations from 2010 to 2019, with Santa Clara highest and Napa lowest.
 
Pie chart comparing the land areas of Bay Area counties, with Monterey largest and San Francisco smallest.
 
Chart comparing population density across Bay Area counties, with San Francisco far above the others.
 
Disclaimer page for a Compass San Francisco Bay Area real estate market report, with Lurie Group and Compass logos.


Alexander Lurie smiling in a dark blazer and striped shirt.

Meet Alexander

Meet Alexander Lurie

Alexander Fromm Lurie is a highly accomplished San Francisco real estate professional and the leader of The Lurie Group, a top-performing team recognized among the top 1% of agents in the city. With over a decade of experience in the real estate industry and California DRE License #01952347, Alexander has built a reputation for delivering exceptional results, with hundreds of homes sold and over $1 billion in total sales volume. Born and raised in San Francisco, he brings deep local expertise, generational knowledge of the Bay Area, and a strong connection to the community into every client relationship. His approach goes beyond transactions—focusing on helping clients build meaningful connections to neighborhoods, schools, and local culture while navigating the buying or selling process with confidence.

Alexander’s background in management consulting and entrepreneurship further strengthens his strategic approach to real estate, allowing him to provide clients with a competitive edge in pricing, negotiation, and marketing. Known for his integrity, discretion, and client-first mindset, he continues to be a trusted advisor for buyers, sellers, and investors across San Francisco’s dynamic real estate market.

Alexander Lurie

Founder | Real Estate Advisor
LICENSE NUMBER
01952347
ADDRESS
629 Divisadero Ave, San Francisco, CA 94117

Let's Work Together

Our passion is supporting clients who value exceptional results and client care. We look forward to the opportunity to work together.

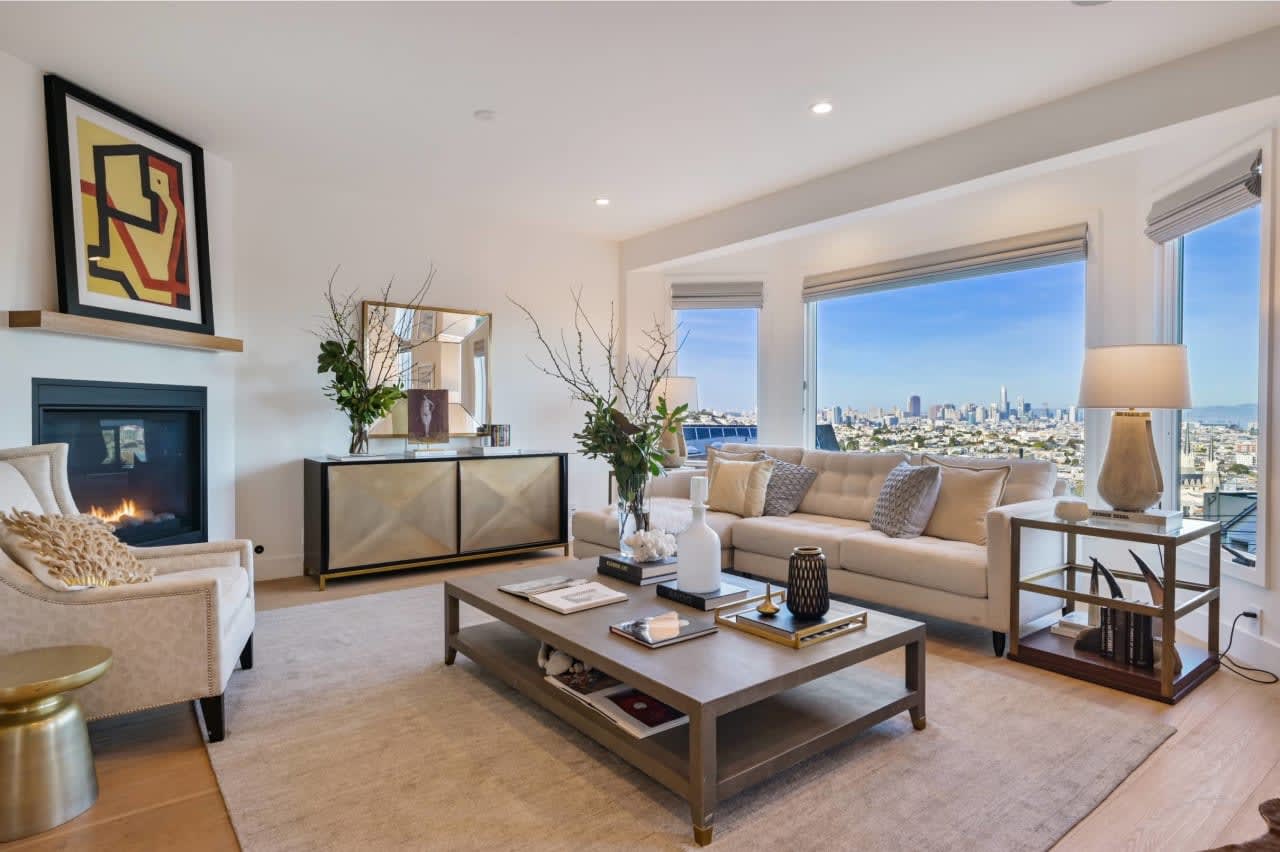
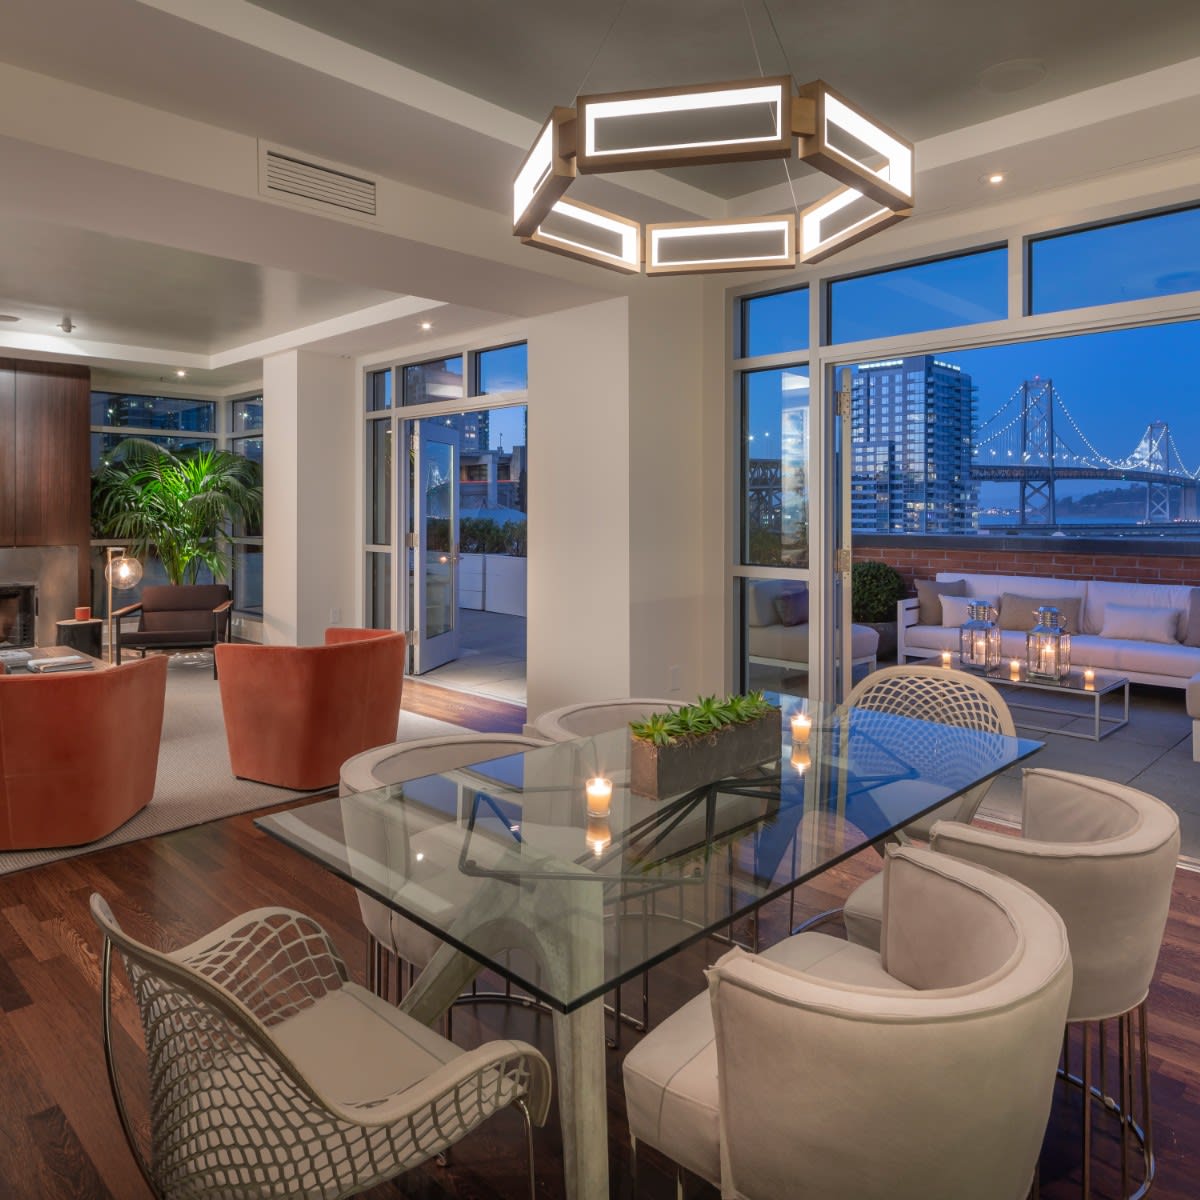
Modern condo living and dining area with a geometric chandelier and Bay Bridge views through large windows.
link
Follow Us