
The Lurie Group
San Francisco 2024 February Real Estate Report

San Francisco 2024 February Real Estate Report

  • Alexander Lurie
  • February 13, 2024

San Francisco Real Estate
February 2024 Report

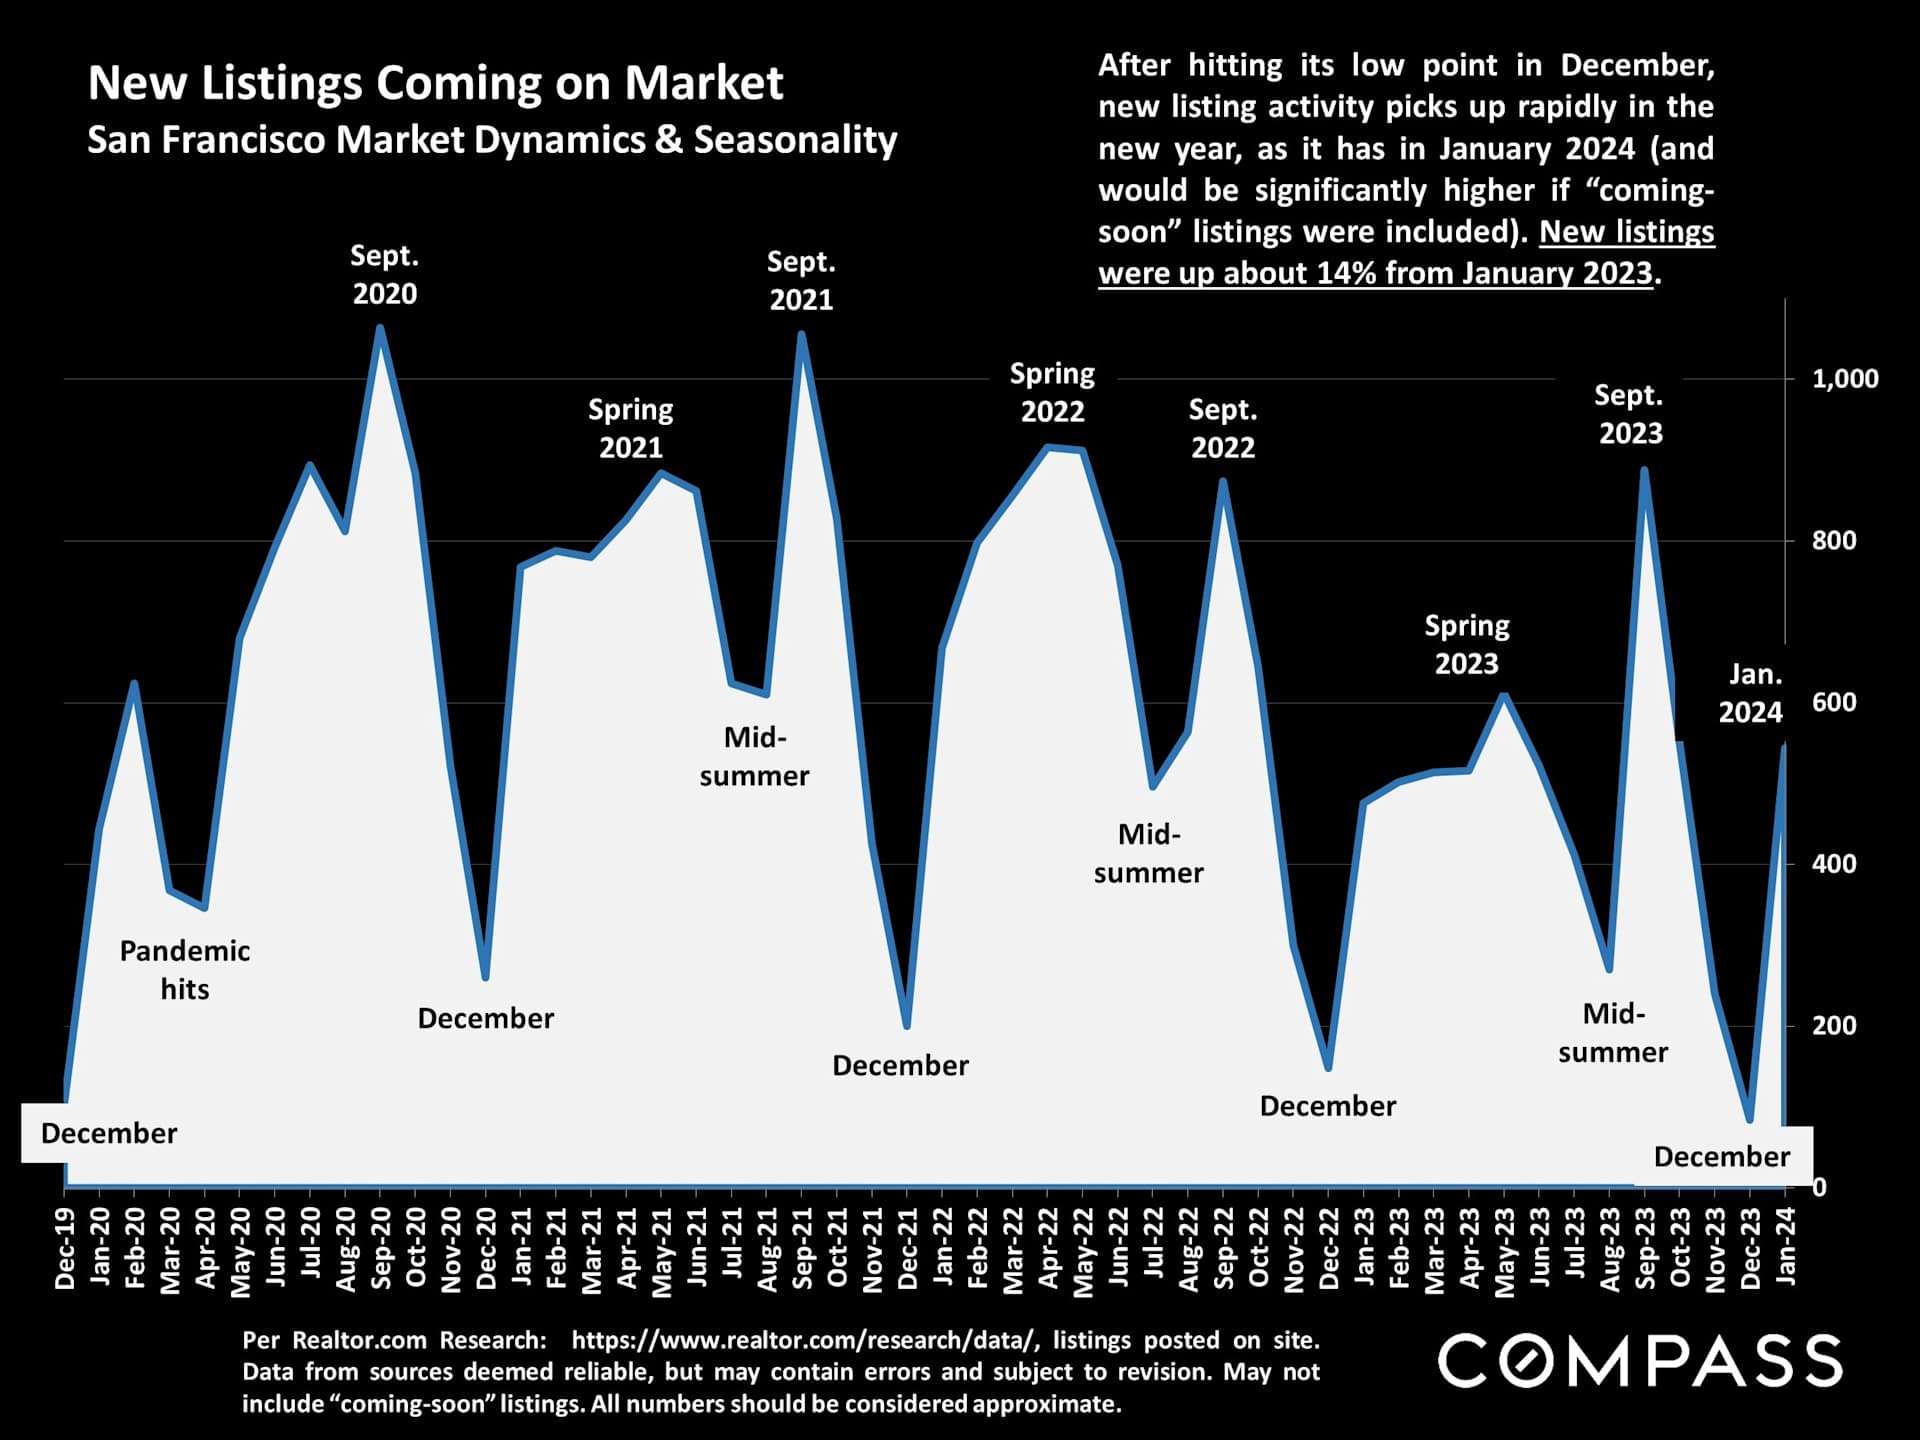
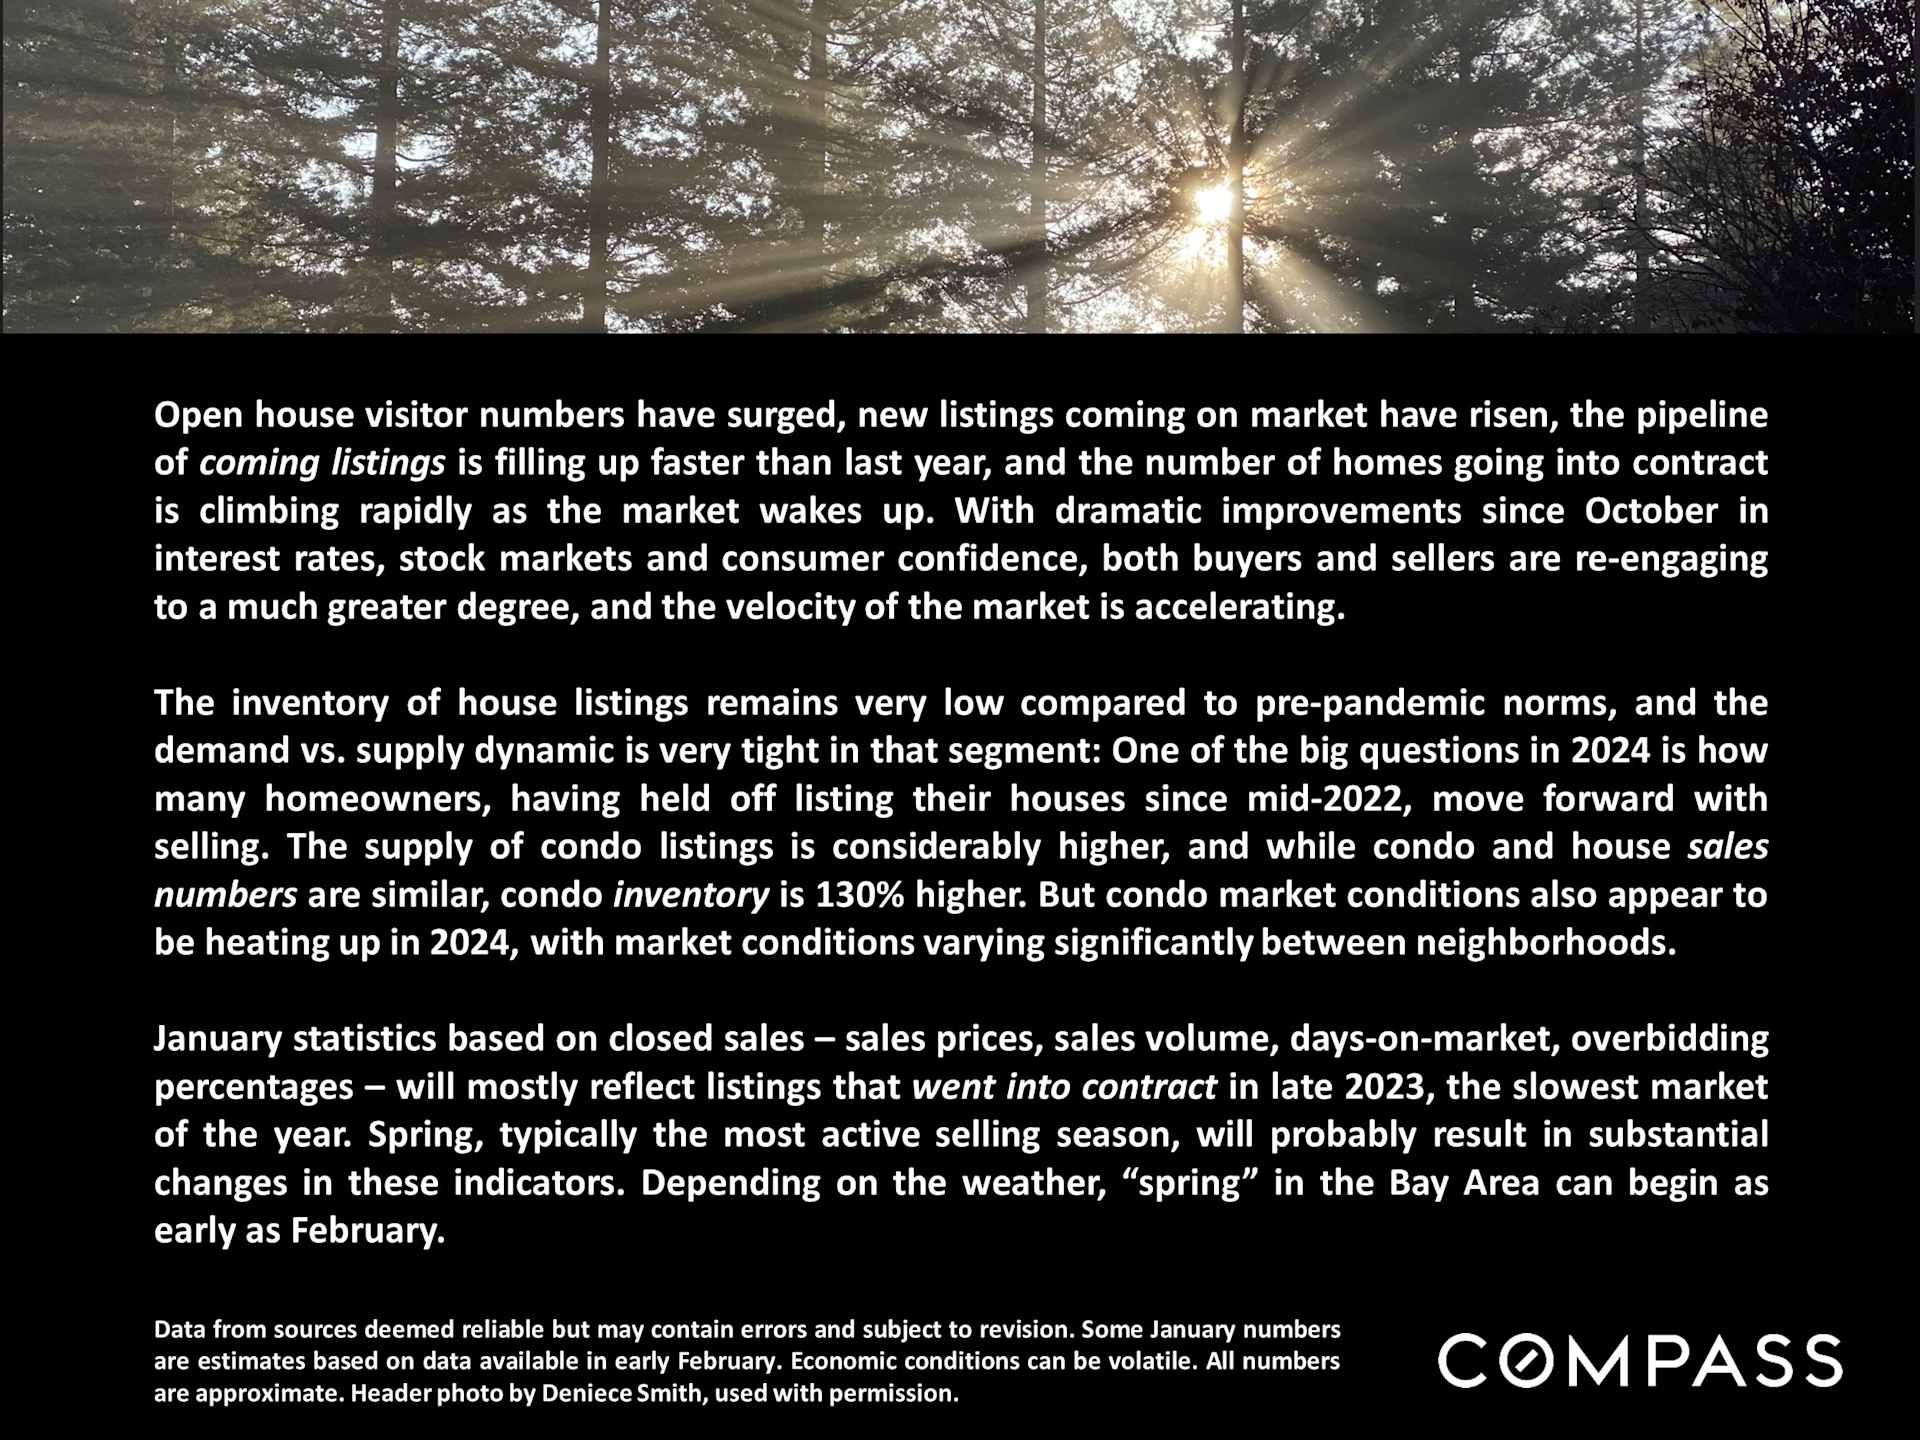
Open house visitor numbers have surged, new listings coming on market have risen, the pipeline
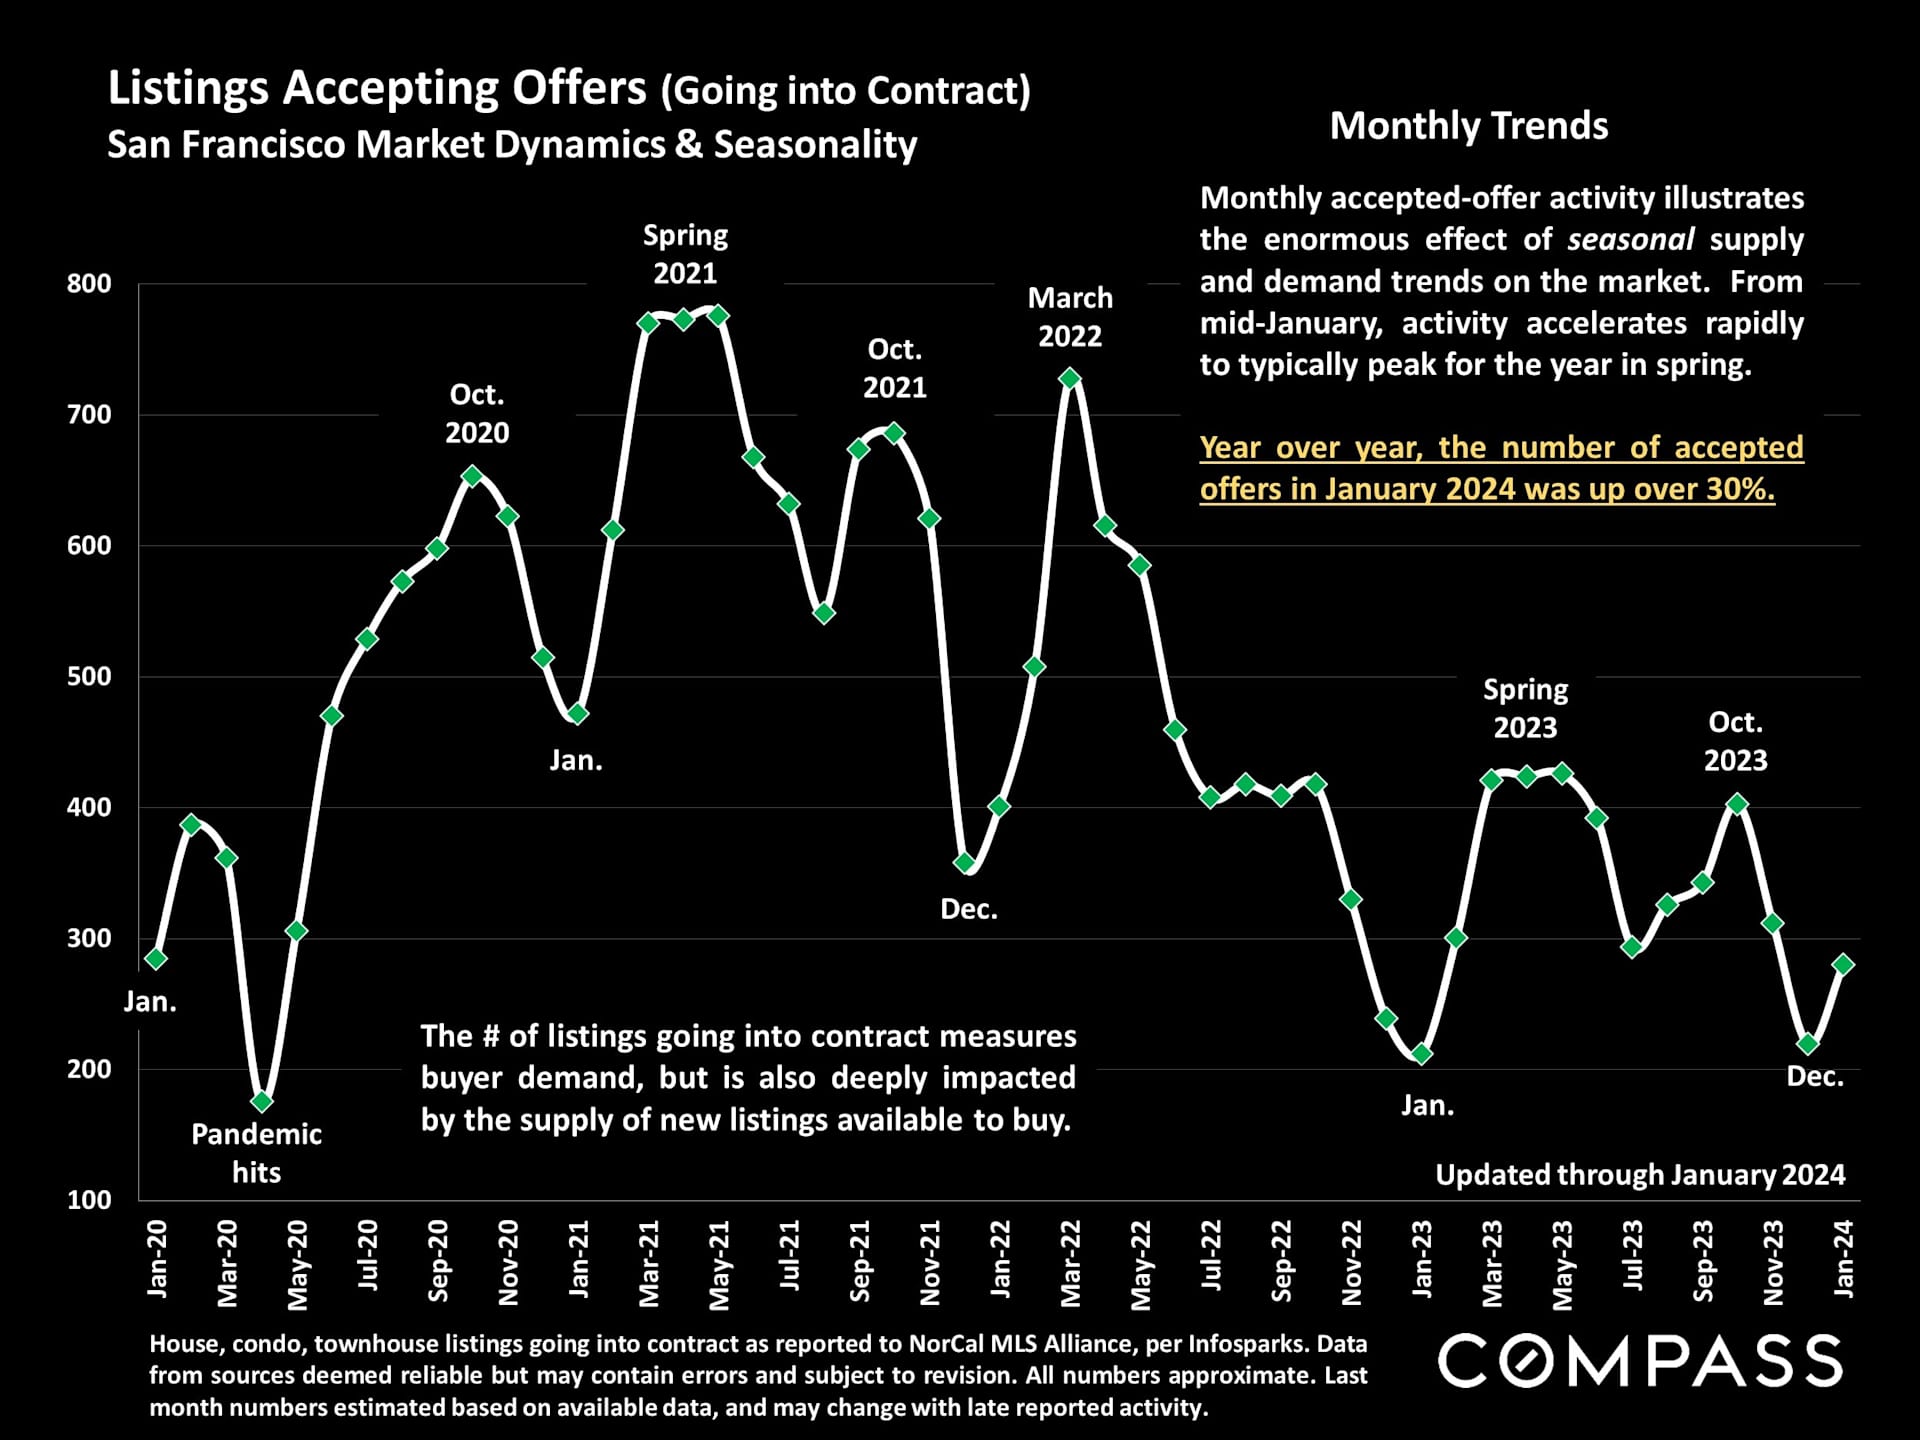
of coming listings is filling up faster than last year, and the number of homes going into contract
is climbing rapidly as the market wakes up. With dramatic improvements since October in
interest rates, stock markets and consumer confidence, both buyers and sellers are re-engaging
to a much greater degree, and the velocity of the market is accelerating.

The inventory of house listings remains very low compared to pre-pandemic norms, and the
demand vs. supply dynamic is very tight in that segment: One of the big questions in 2024 is how
many homeowners, having held off listing their houses since mid-2022, move forward with
selling. The supply of condo listings is considerably higher, and while condo and house sales
numbers are similar, condo inventory is 130% higher. But condo market conditions also appear to
be heating up in 2024, with market conditions varying significantly between neighborhoods.

January statistics based on closed sales – sales prices, sales volume, days-on-market, overbidding
percentages – will mostly reflect listings that went into contract in late 2023, the slowest market
of the year. Spring, typically the most active selling season, will probably result in substantial
changes in these indicators. Depending on the weather, “spring” in the Bay Area can begin as
early as February.

“Although affordability continues to impact homeownership, the combination of a solid economy,
strong demographics and lower mortgage rates are setting the stage for a more robust housing
market. Mortgage rates have been stable for nearly two months, but with continued deceleration
in inflation, rates are expected to decline further. The economy continues to outperform due to
solid job and income growth, while household formation is increasing at rates above pre-pandemic
levels. These favorable factors should provide strong fundamental support to the market in the
months ahead.” FHLMC (Freddie Mac), 2/1/24

“Over the last two months, [consumer] sentiment has climbed a cumulative 29%, the largest two-
month increase since 1991...For the second straight month, all five index components rose... there
was a broad consensus of improved sentiment across age, income, education, and geography.”
University of Michigan, Consumer Sentiment Index, Preliminary January Report, 1/19/24

“The recession America was expecting never showed up...Instead, the economy grew 3.1% last
year, up from less than 1% in 2022, and faster than the average for the 5 years leading up to the
pandemic. Inflation has retreated substantially [and] unemployment remains at historic lows...”
The New York Times, 1/26/24, “Economists Predicted a Recession. So Far They’ve Been Wrong.”

The California Association of Realtors forecasts that compared to 2023, the number of state home
sales in 2024 will increase 23%, the CA median house sales price will rise 6.2%, and the average 30-
year mortgage interest rate will decline to 6.3%. Jordan Levine, CAR chief economist, 1/18/2024

Data from sources deemed reliable but may contain errors and subject to revision. Some January numbers
are estimates based on data available in early February. Economic conditions can be volatile. All numbers
are approximate.

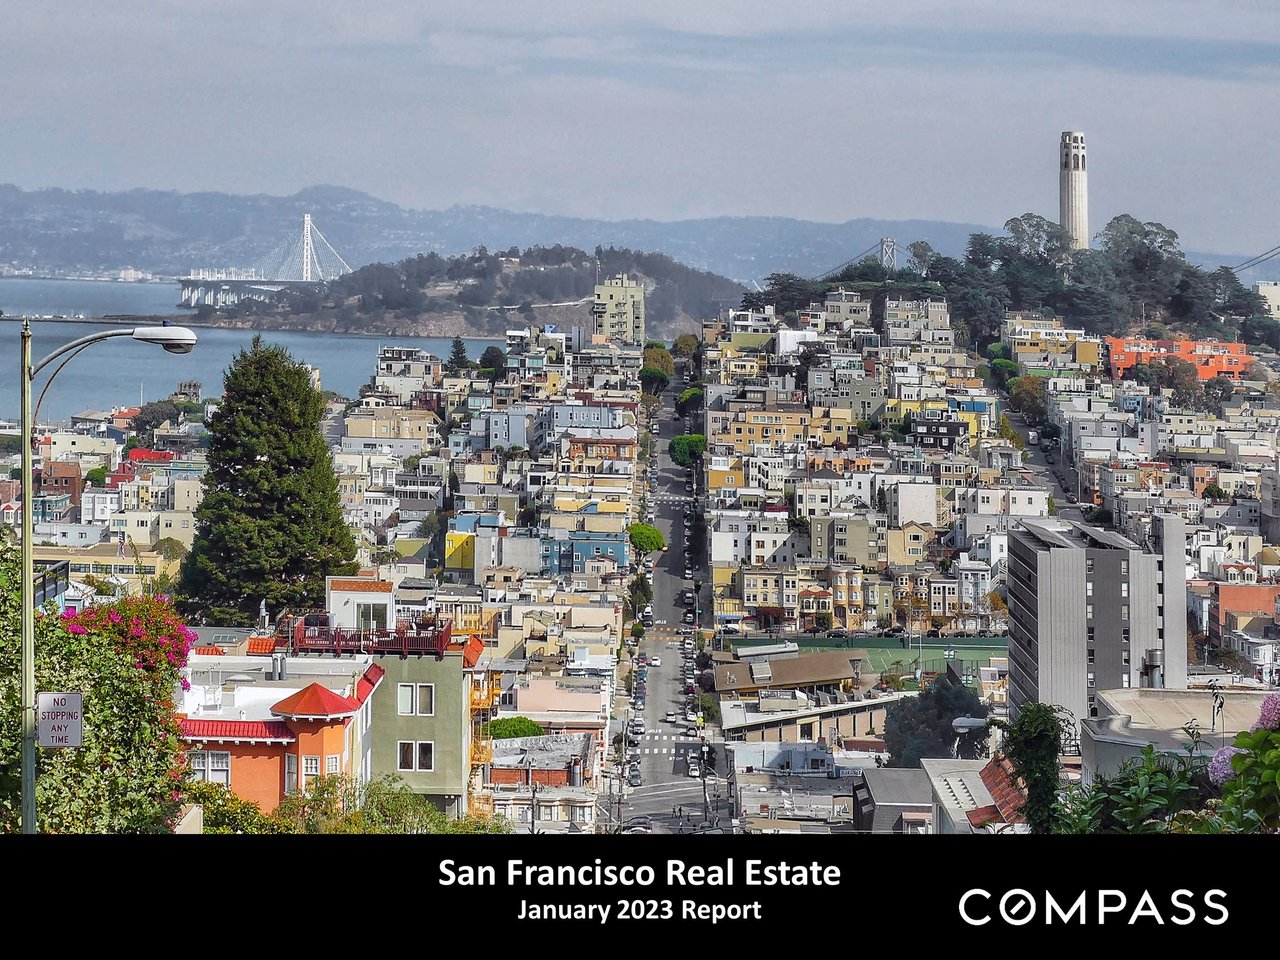
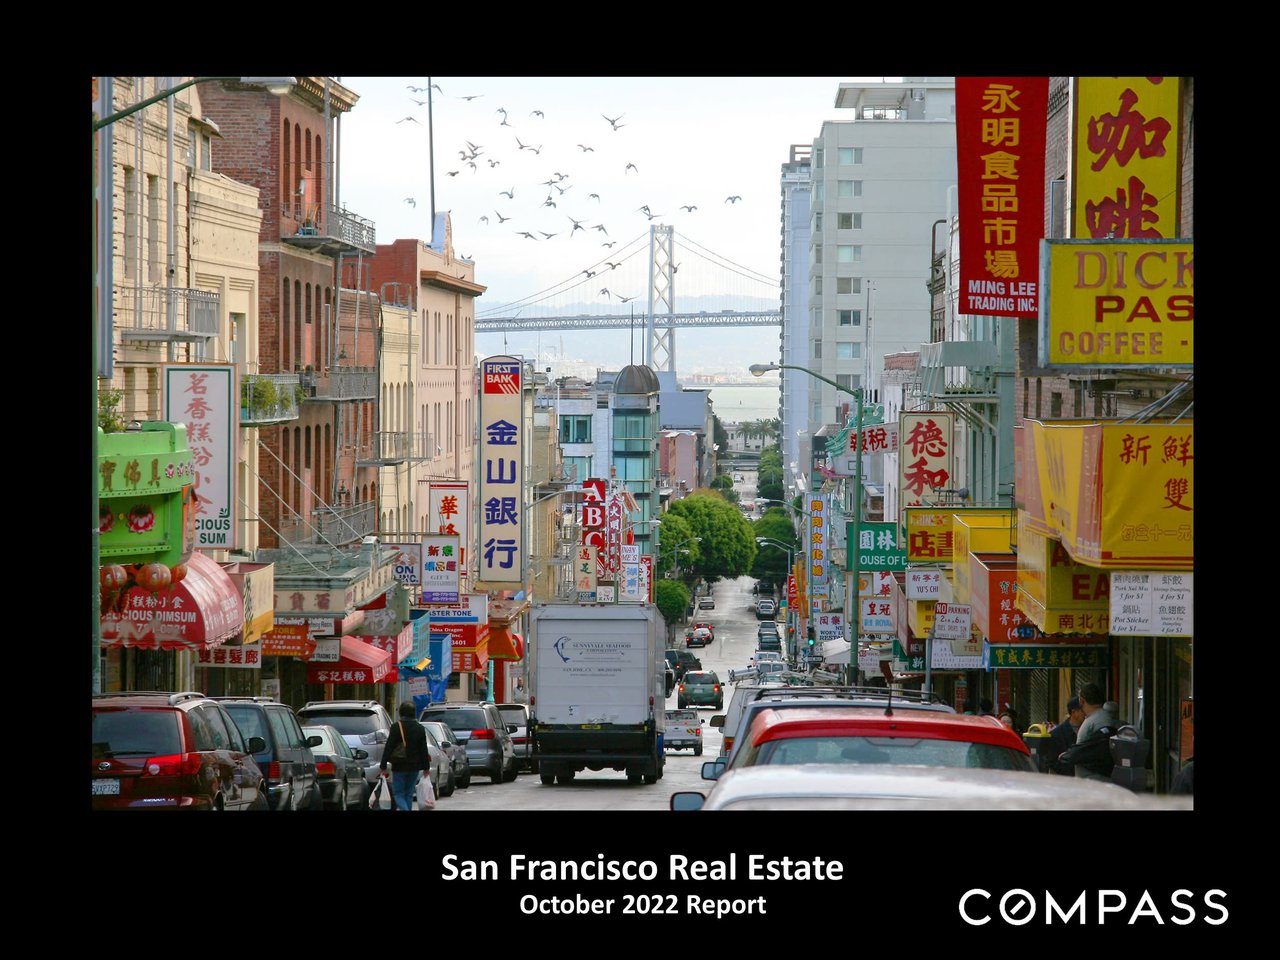
San Francisco February 2024 real estate report: activity is rising, house inventory is low, and condo inventory is higher.

Market report graphic with economic and housing forecasts, quotations, sources, and the Compass wordmark.

Chart of San Francisco new listings from December 2019 to January 2024, showing recurring seasonal peaks and December lows.

Chart of San Francisco listings going into contract, January 2020–January 2024, with seasonal trends and a 2021 peak.

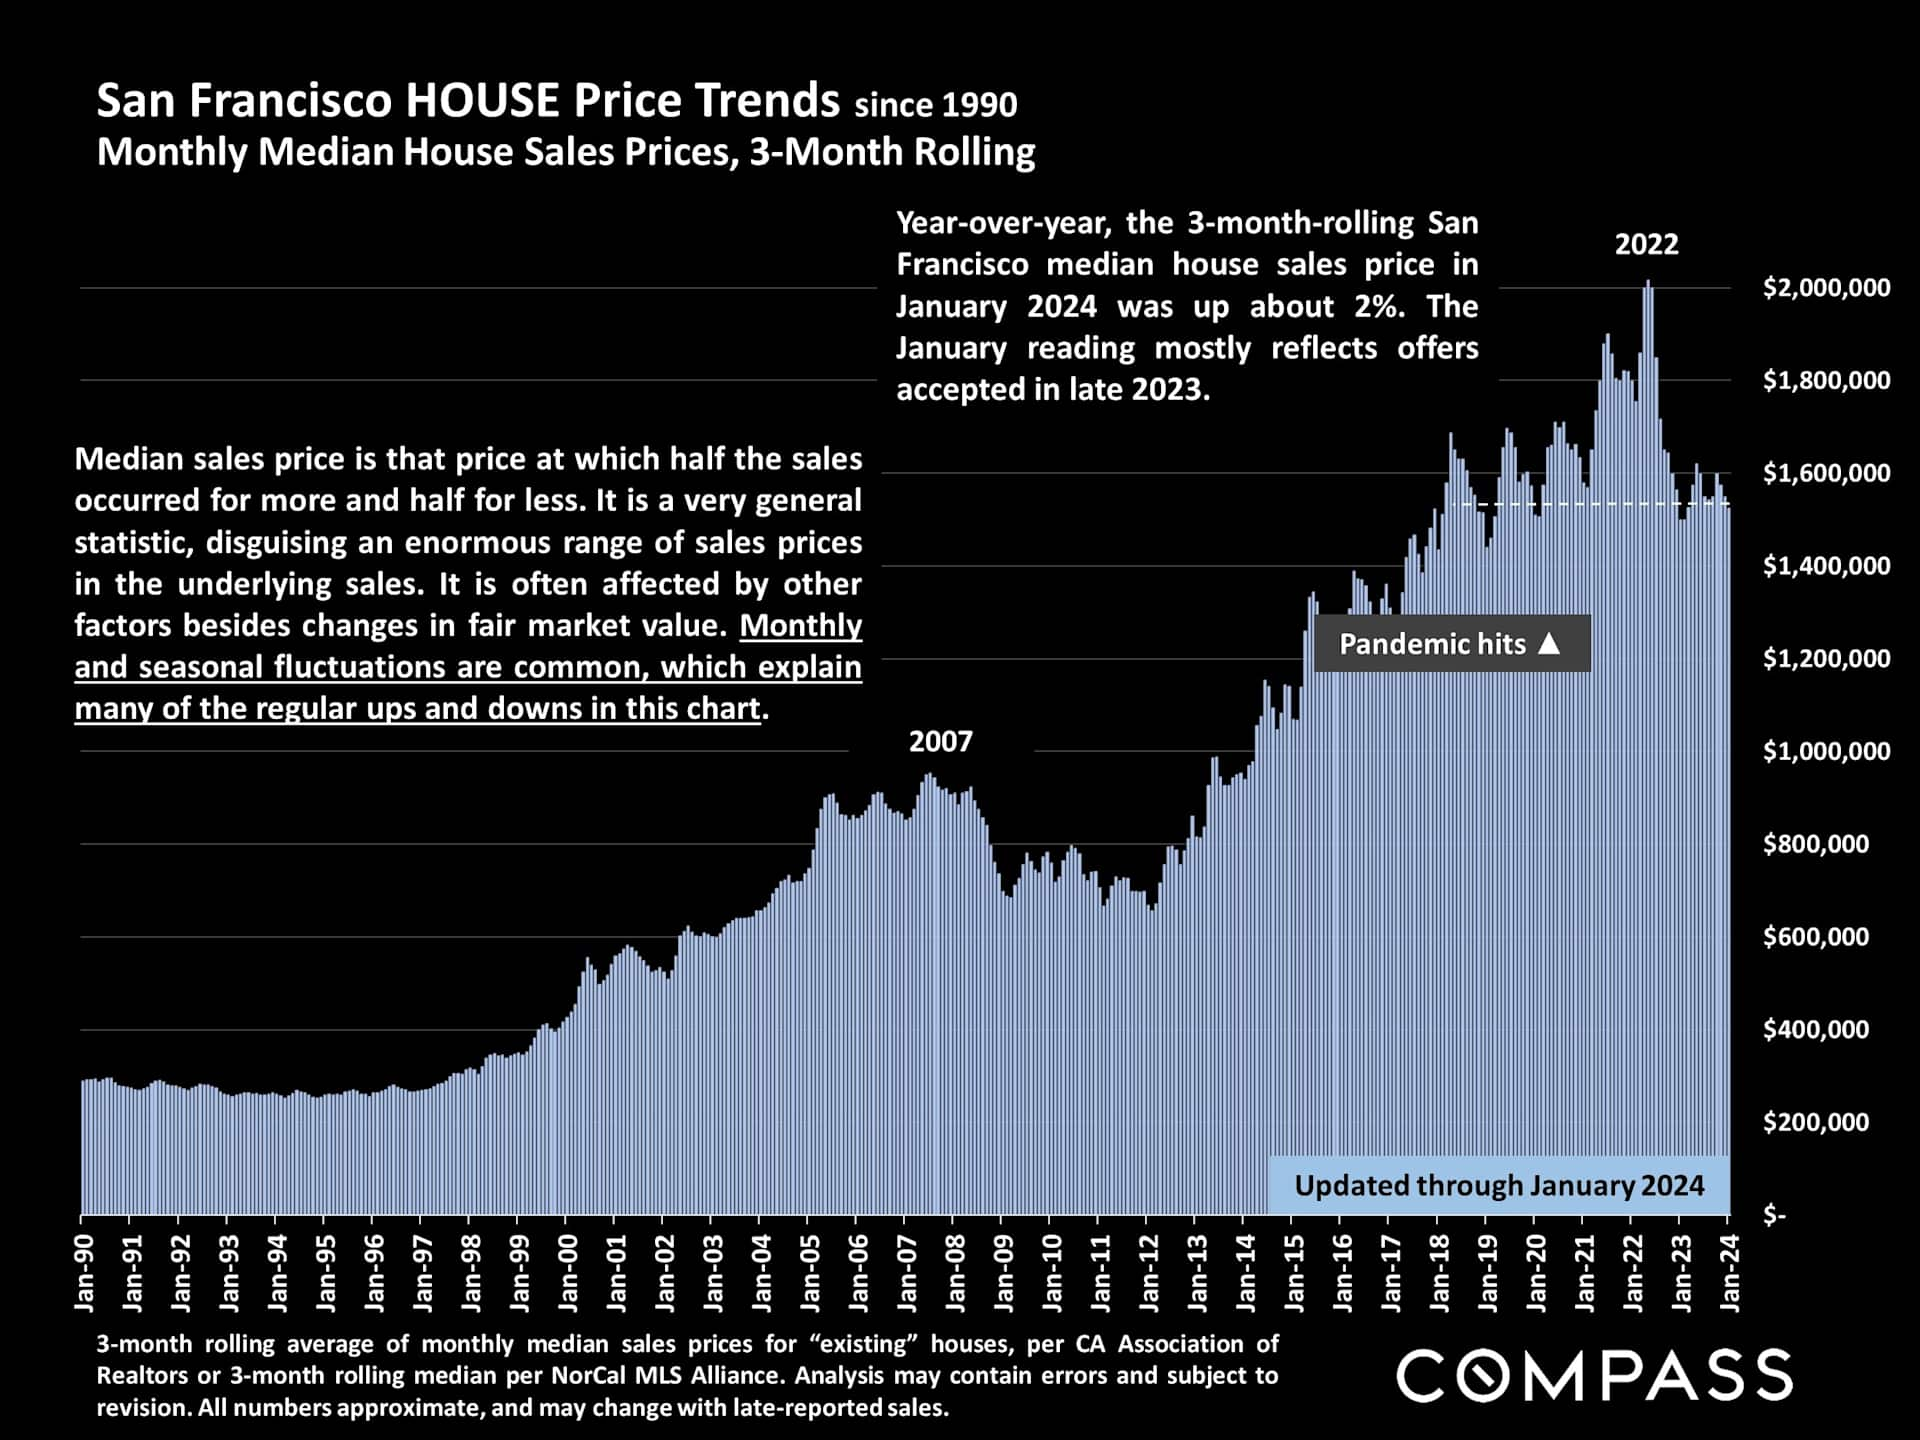
Bar chart of San Francisco median house prices from 1990 to January 2024, with a pandemic-era peak.

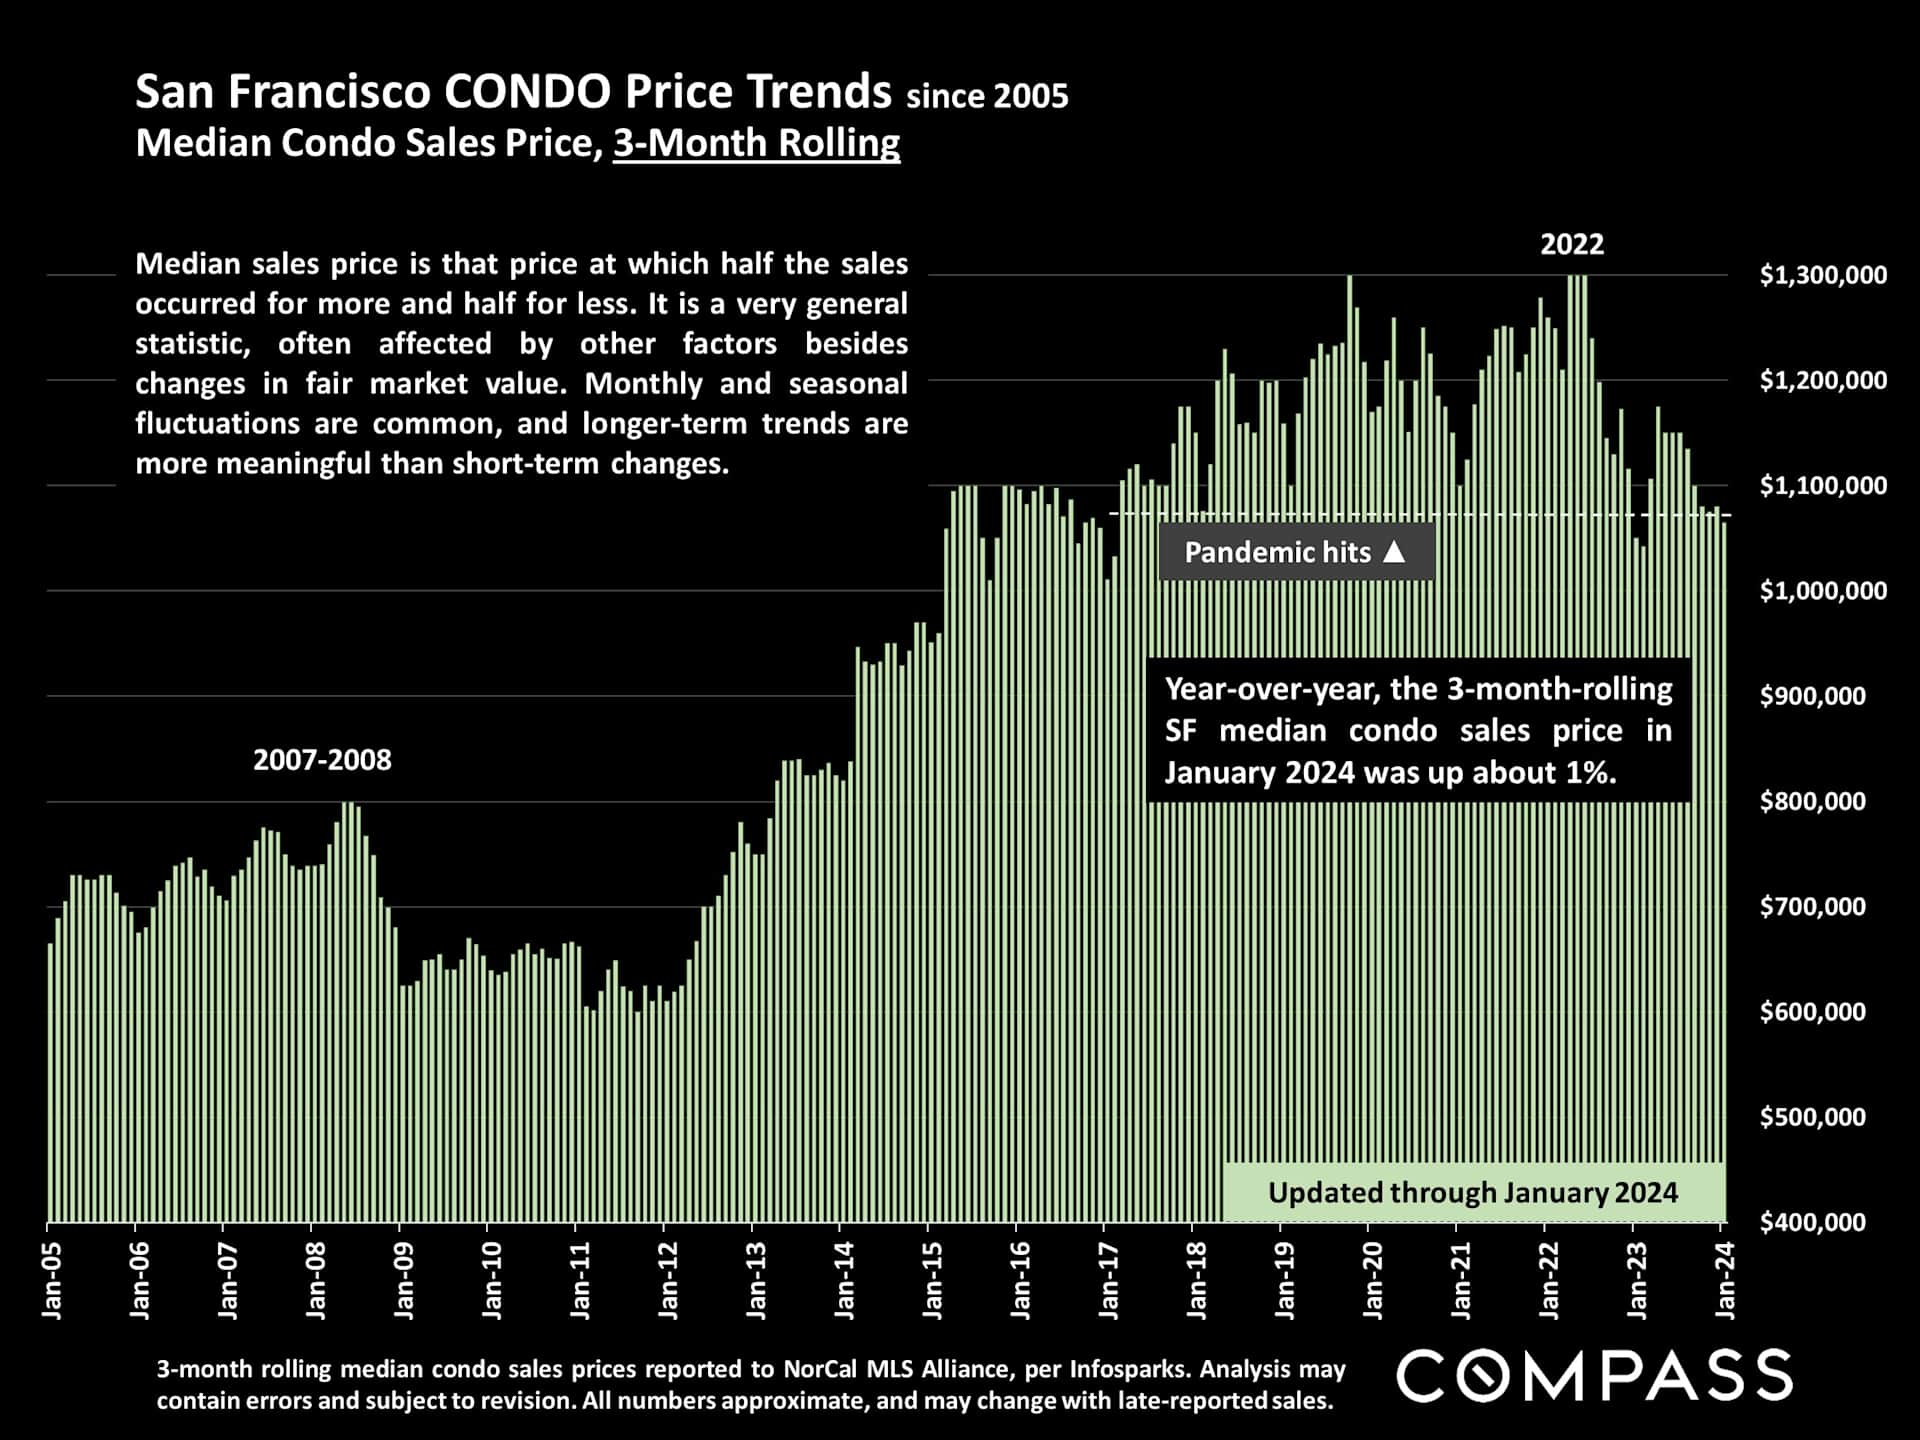
Chart of San Francisco condo prices from 2005 to 2024, with January 2024 prices up about 1% year over year.

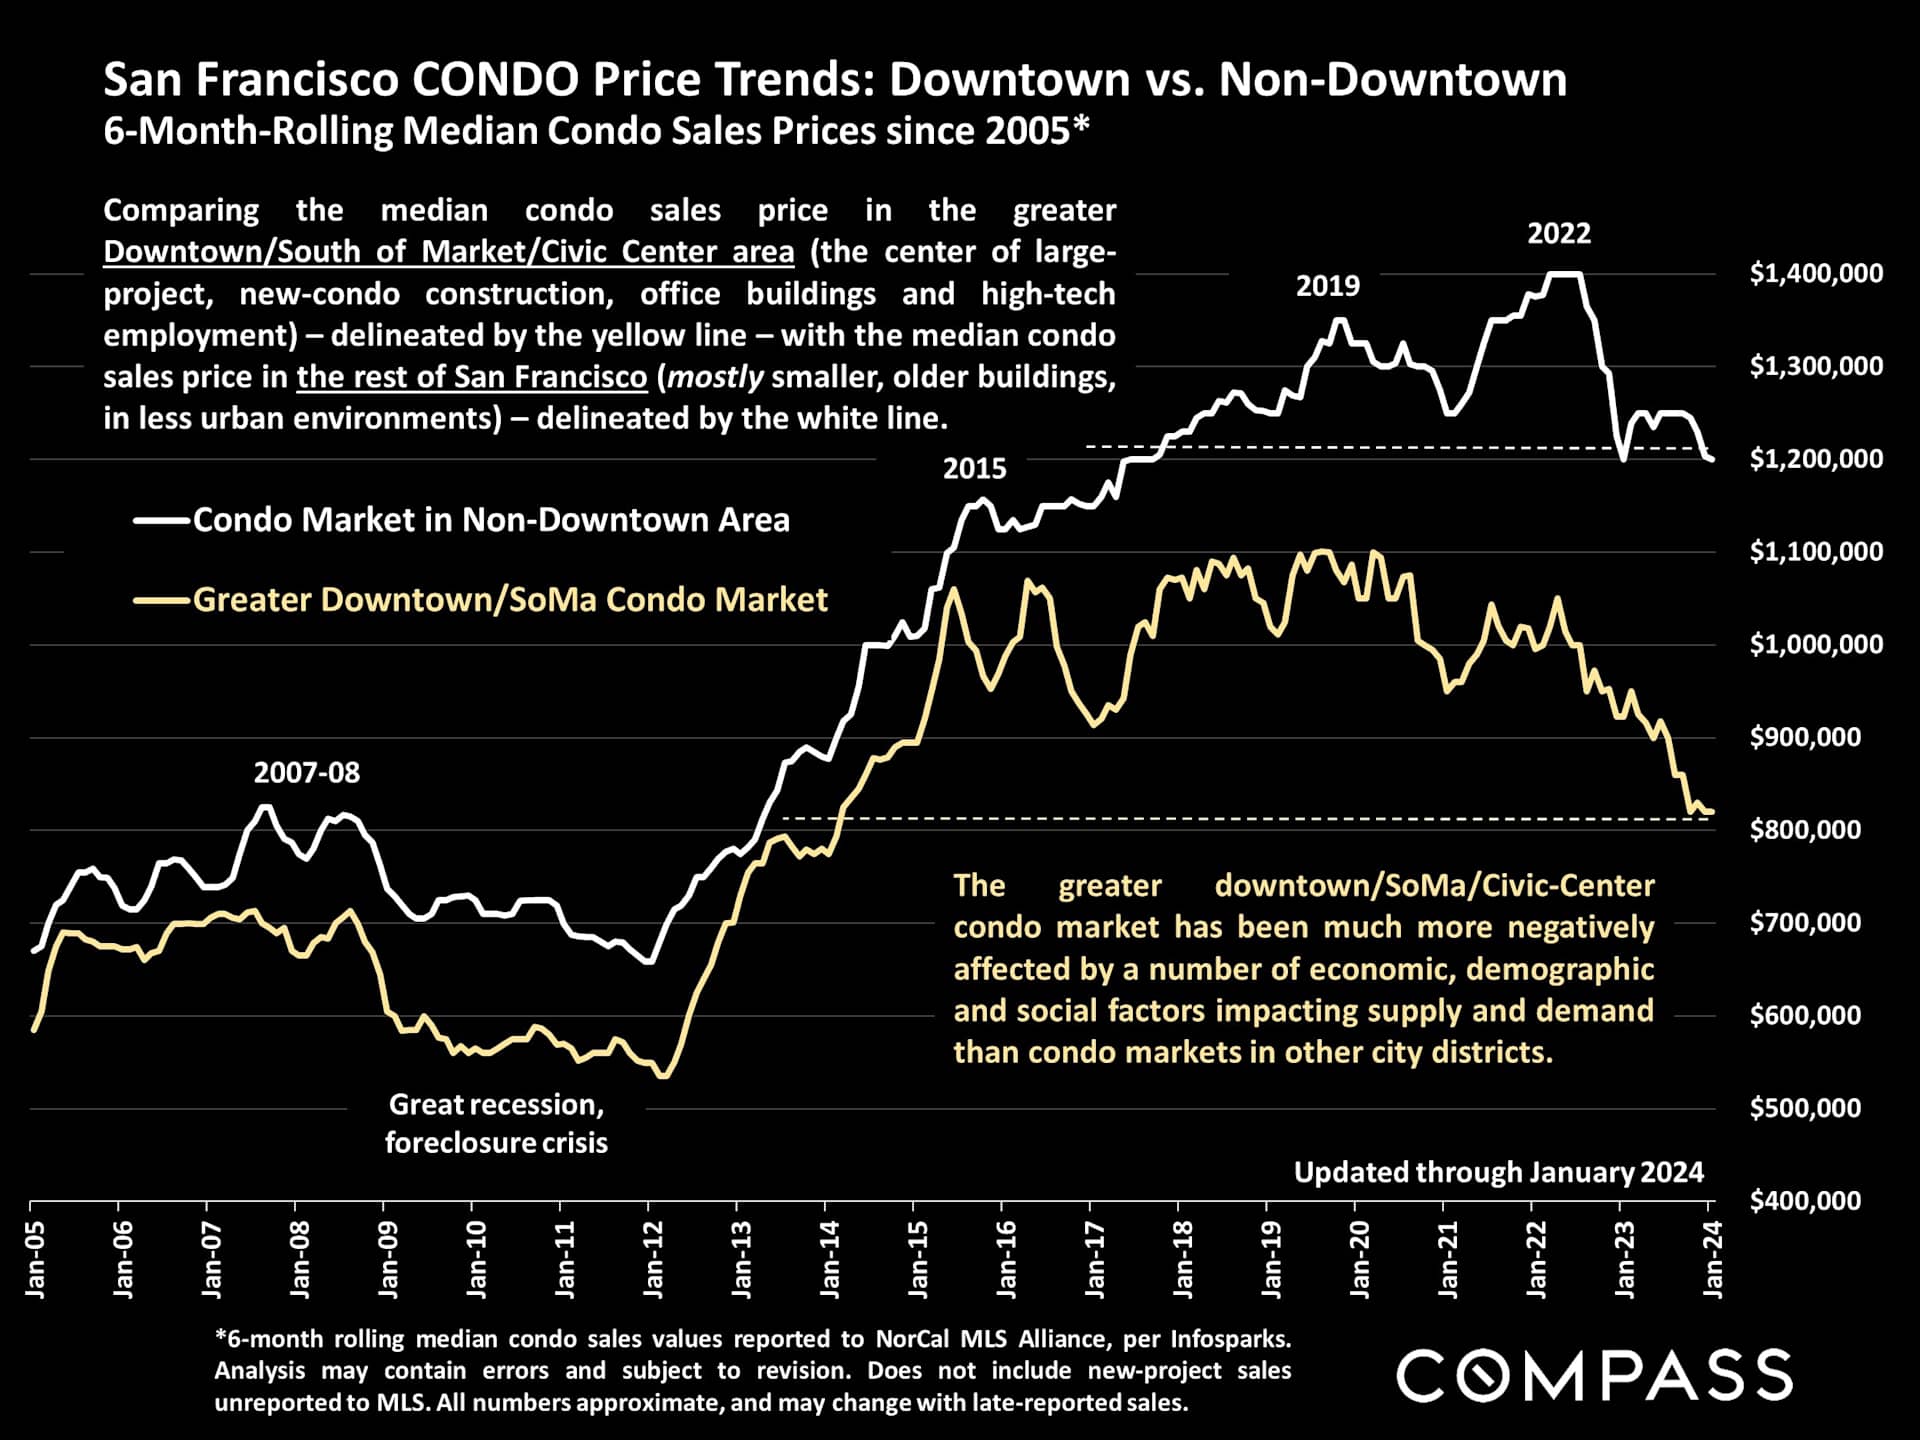
Chart comparing San Francisco downtown and non-downtown condo sale prices from 2005 through January 2024.

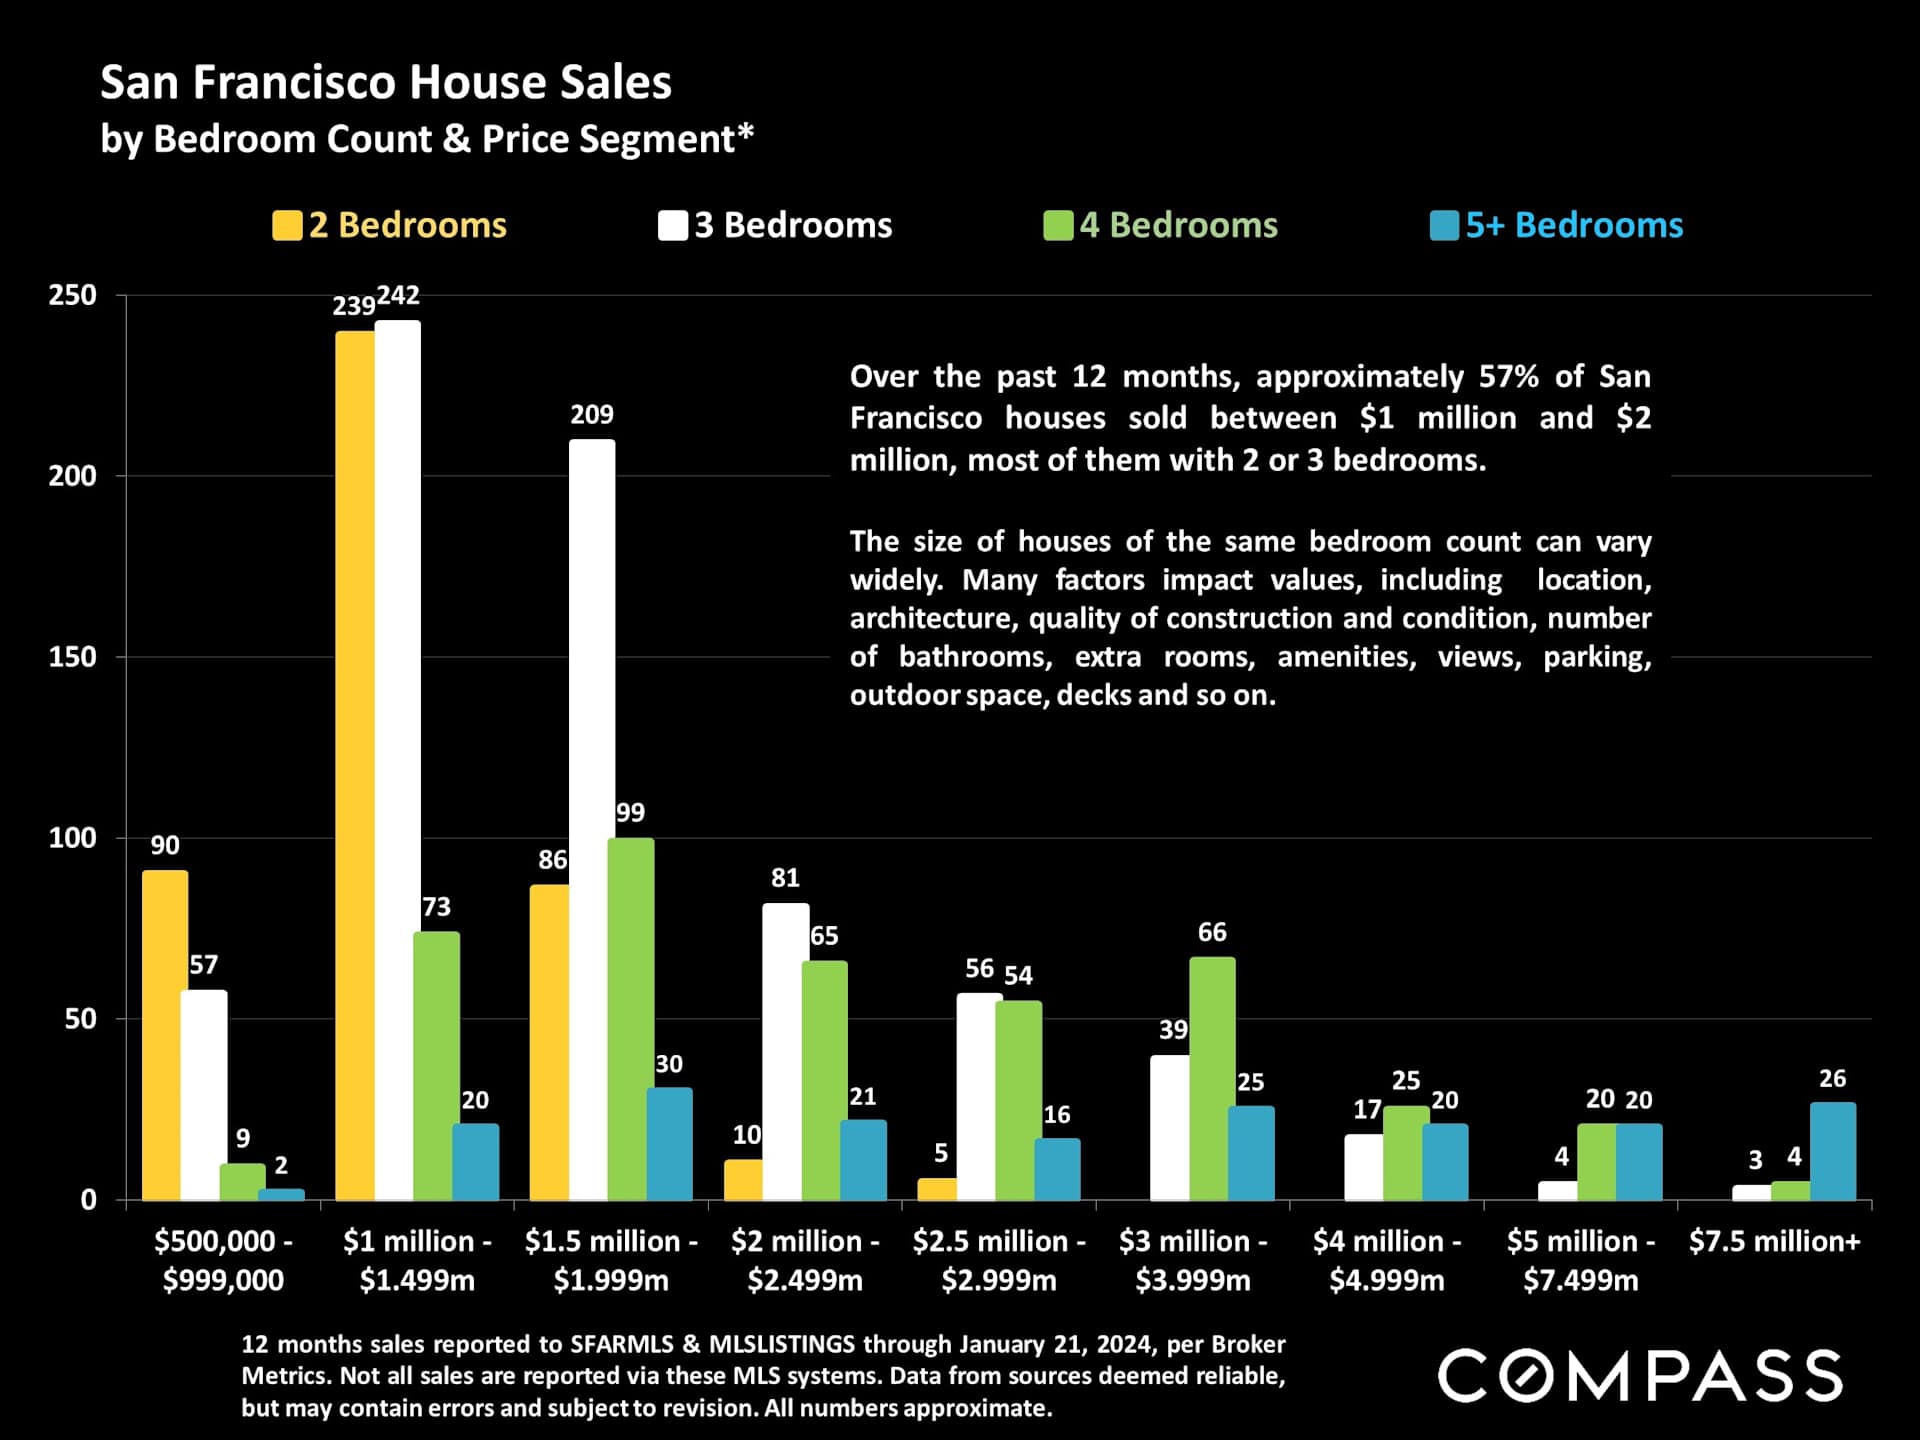
Chart of San Francisco house sales by bedroom count and price segment, with a note about the $1–2 million range.

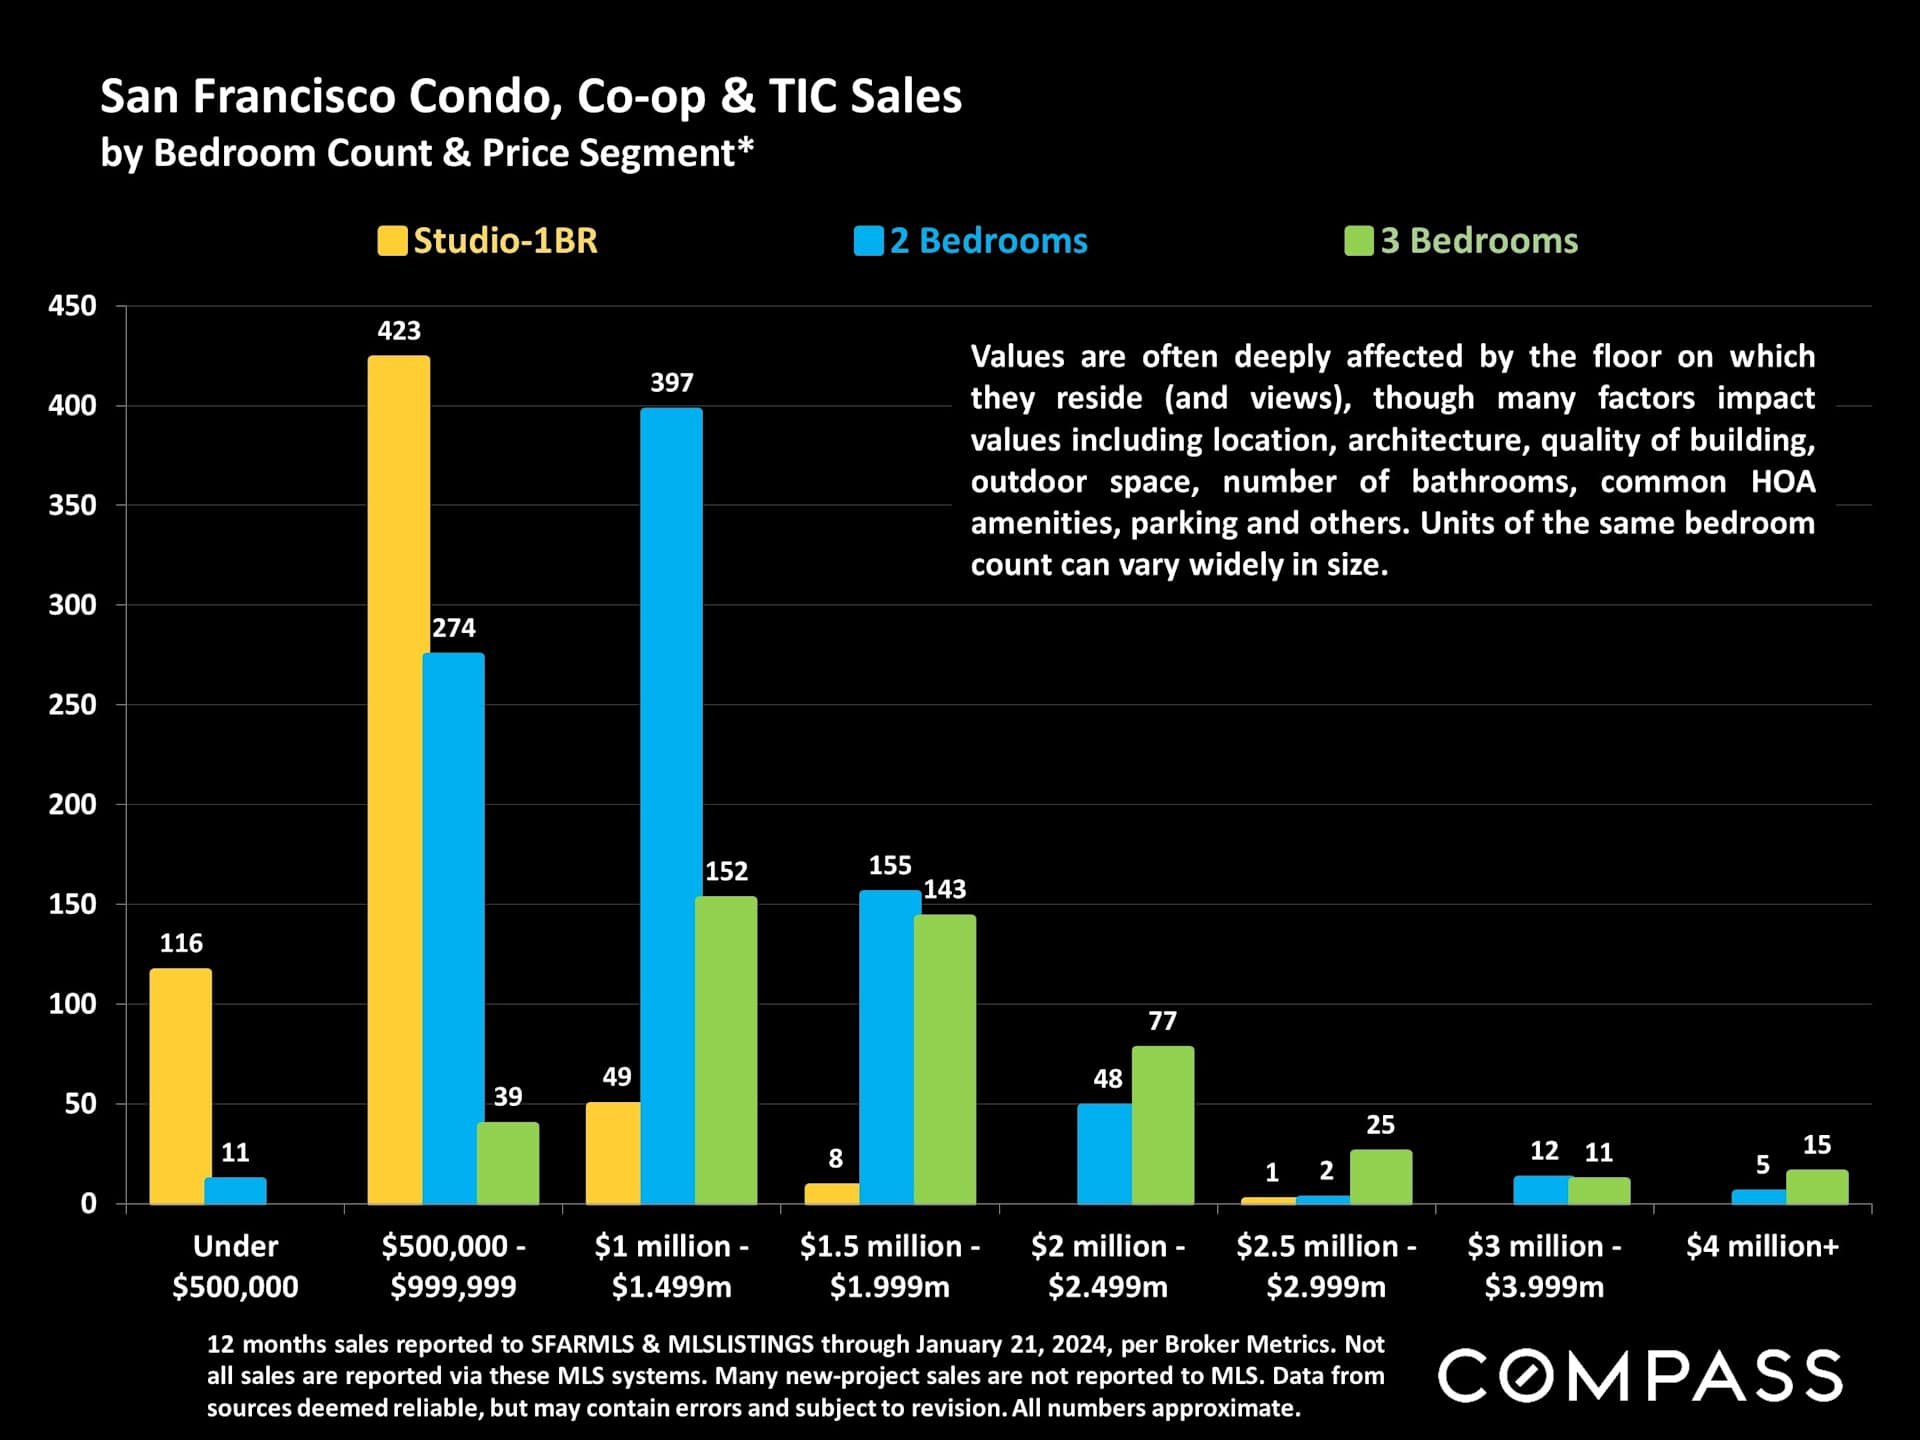
San Francisco condo sales chart by bedroom count and price segment, with Compass branding.

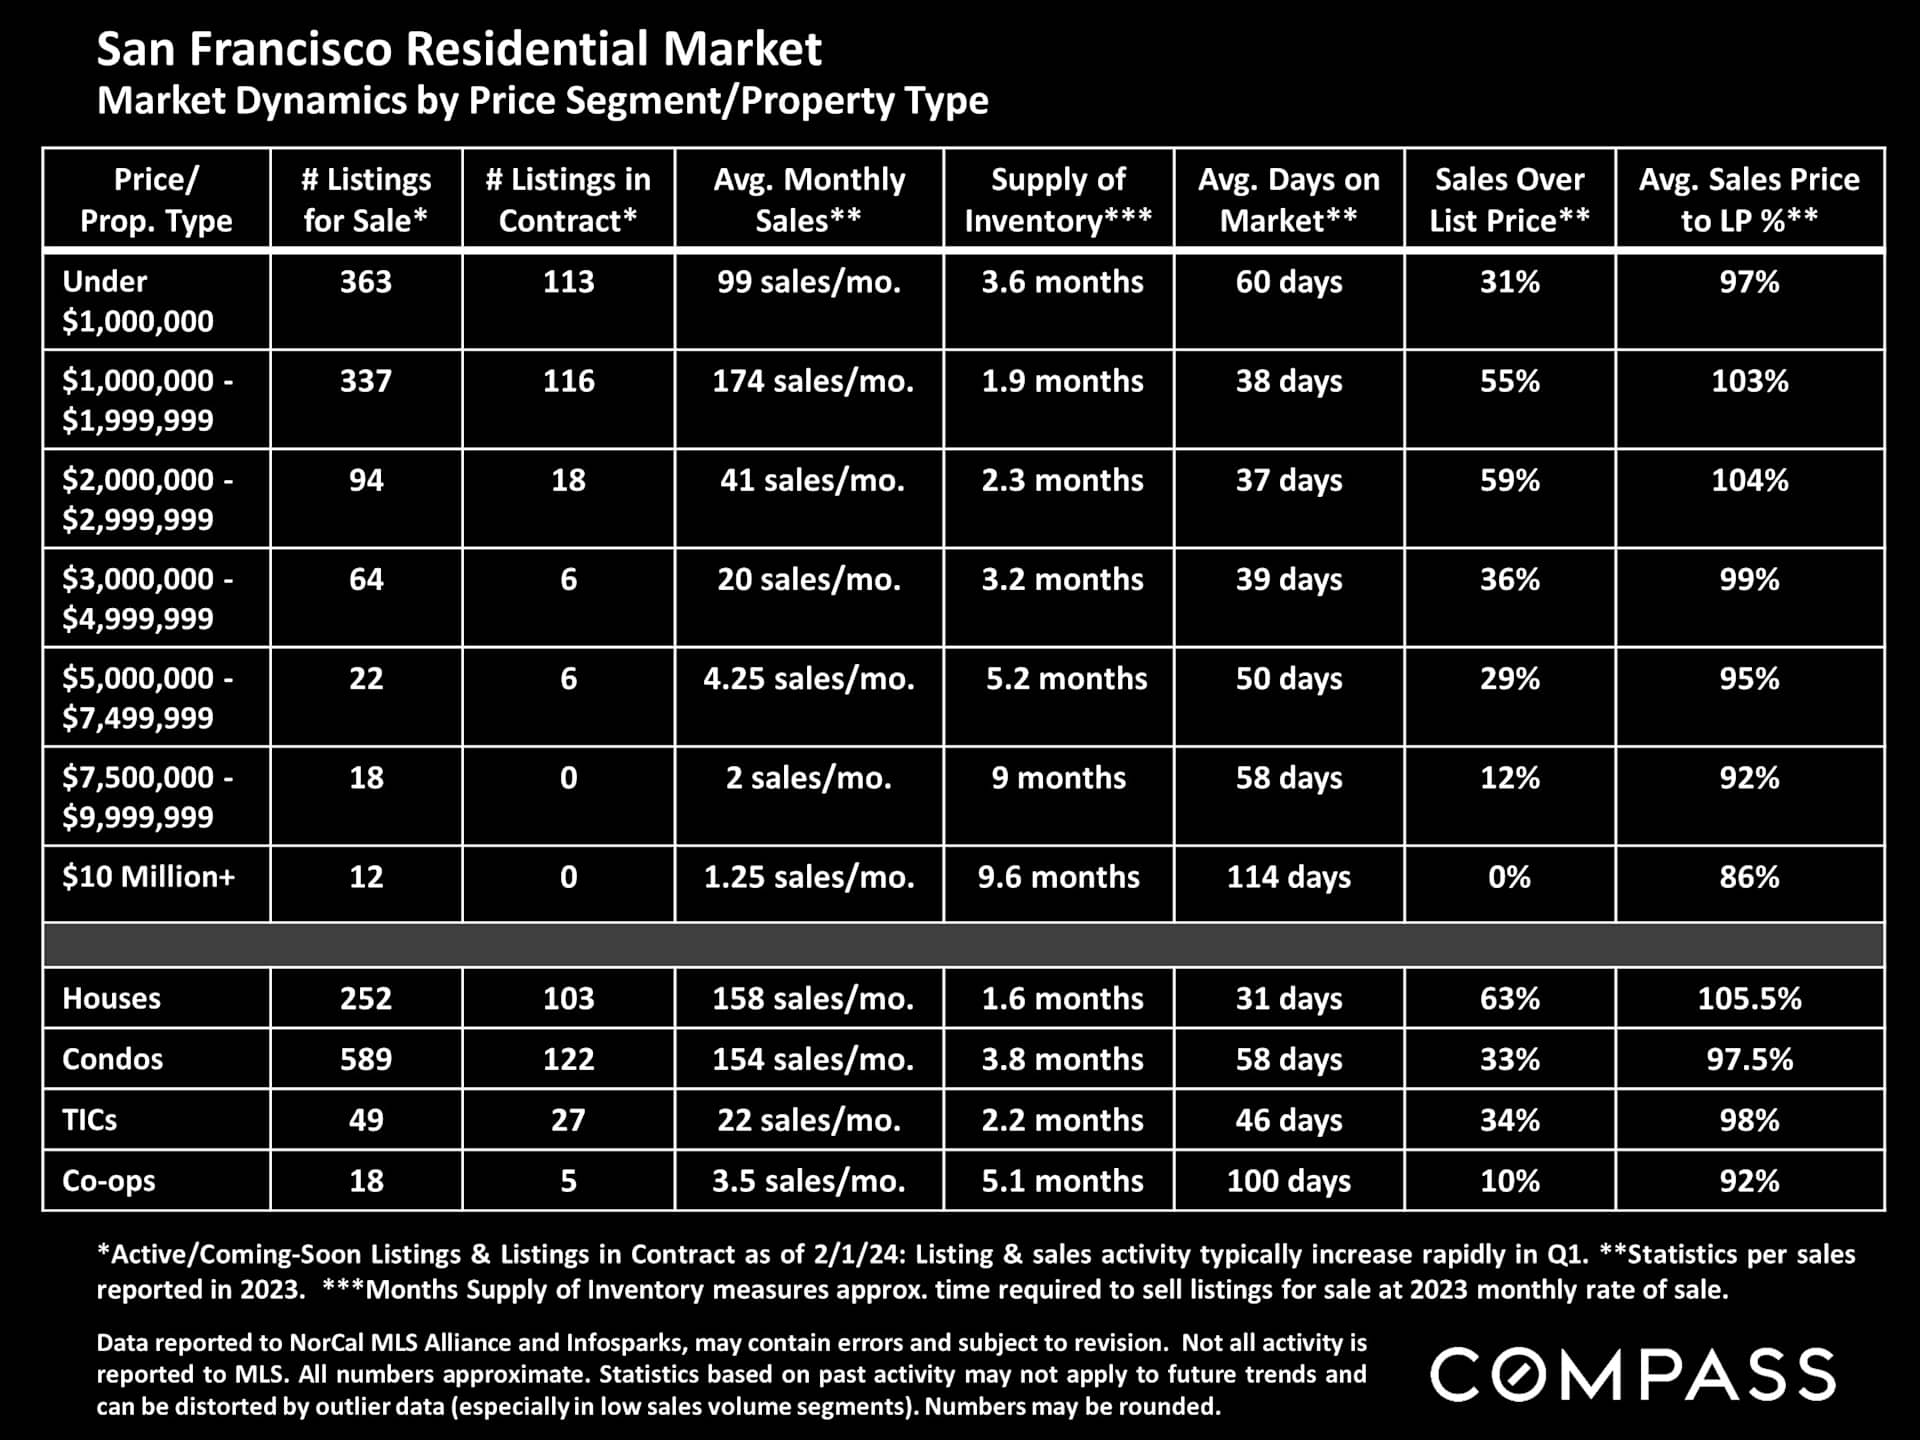
San Francisco residential market dynamics table by price segment and property type, with Compass branding.

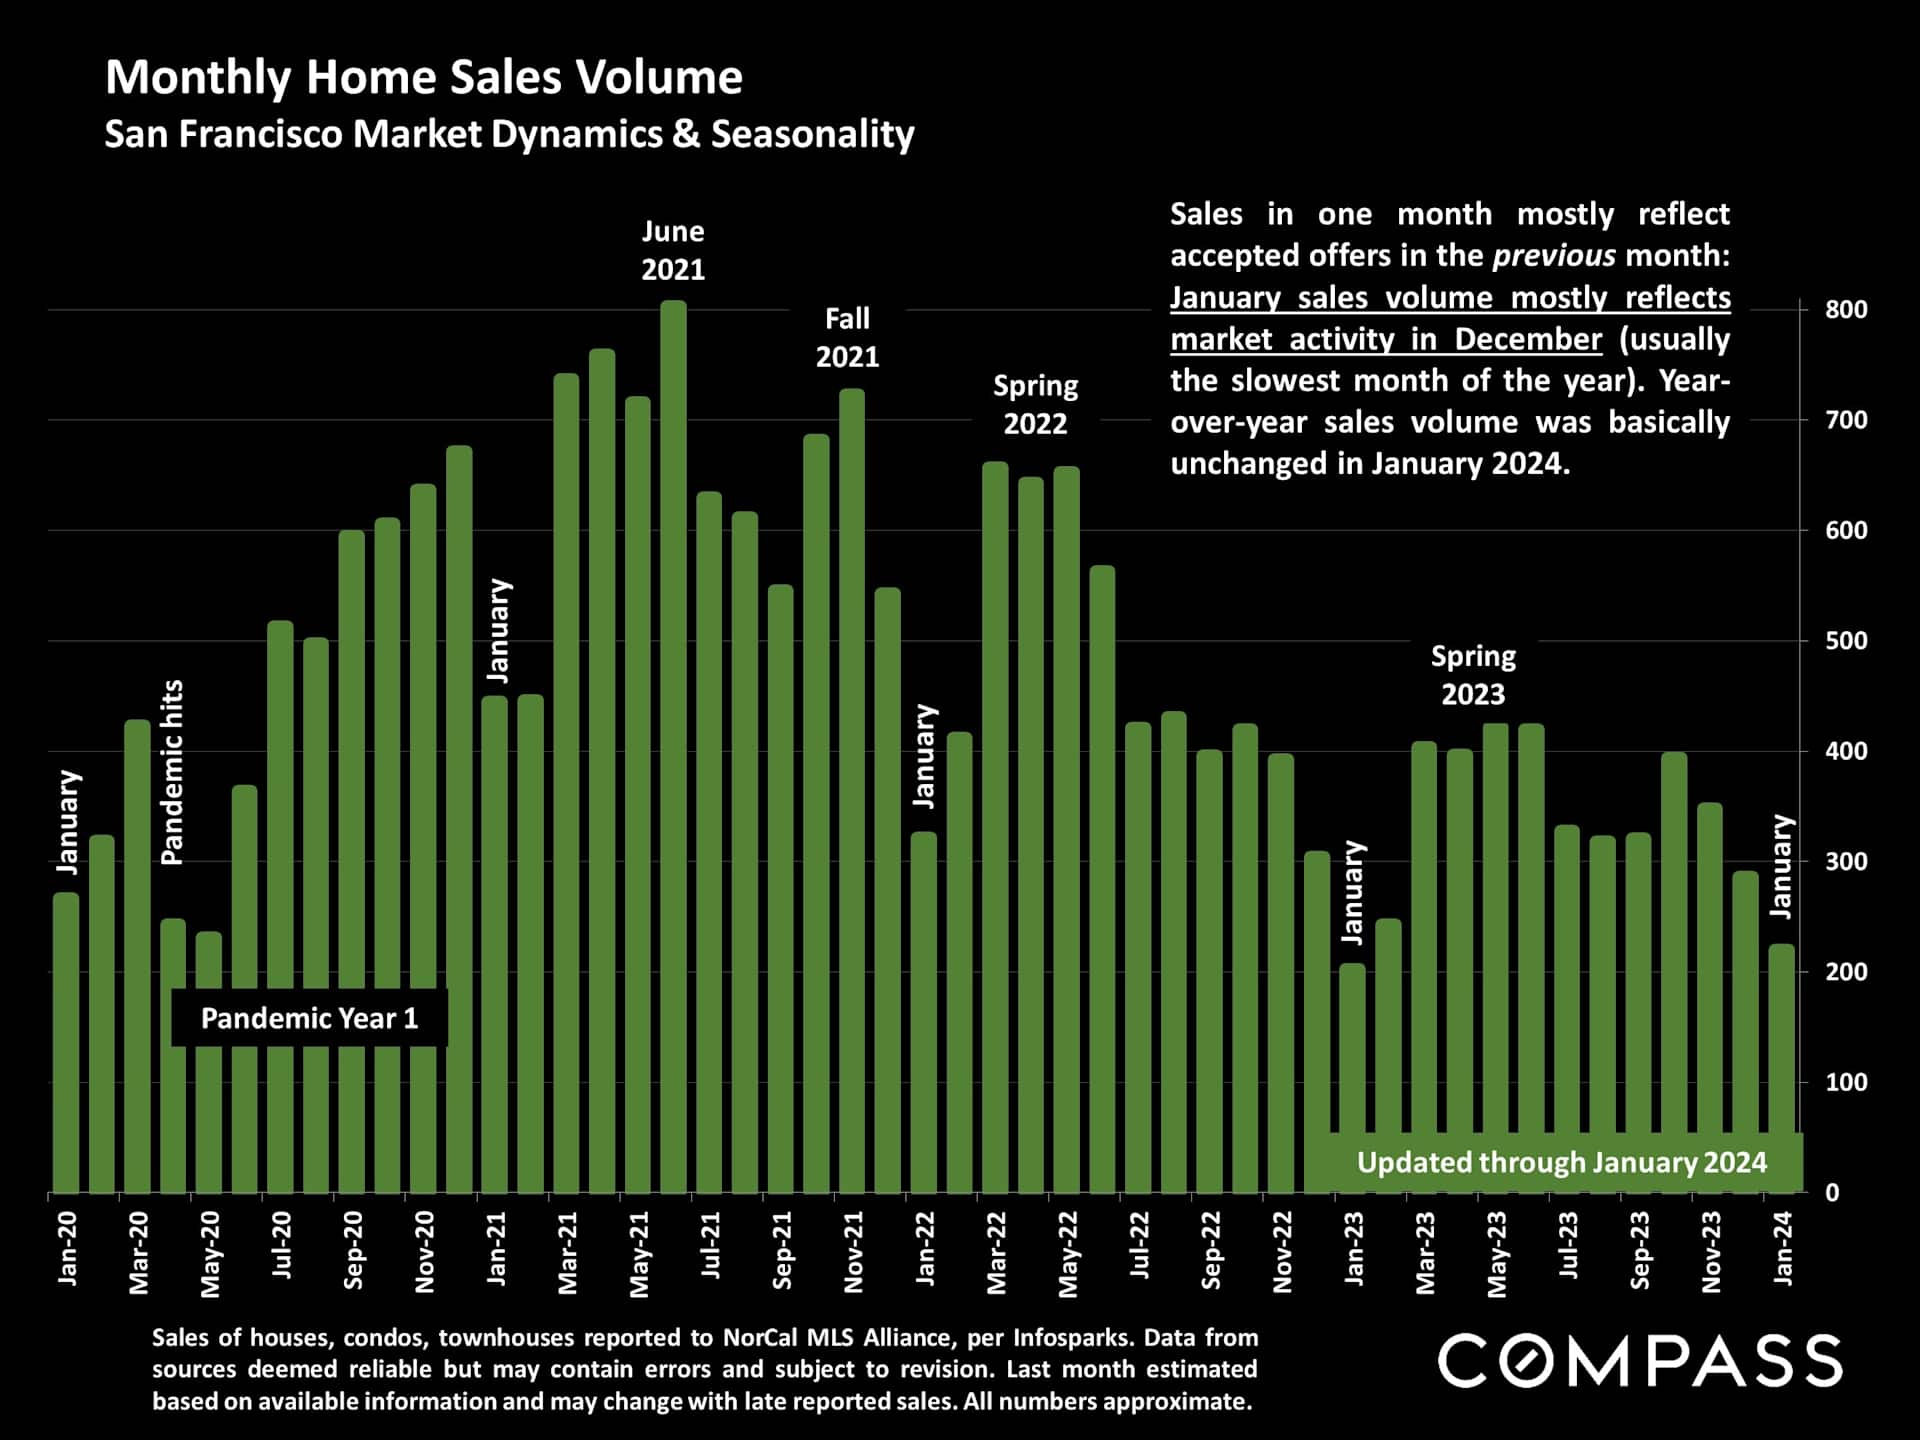
San Francisco monthly home sales chart, January 2020–January 2024, with green bars and pandemic and seasonal annotations.

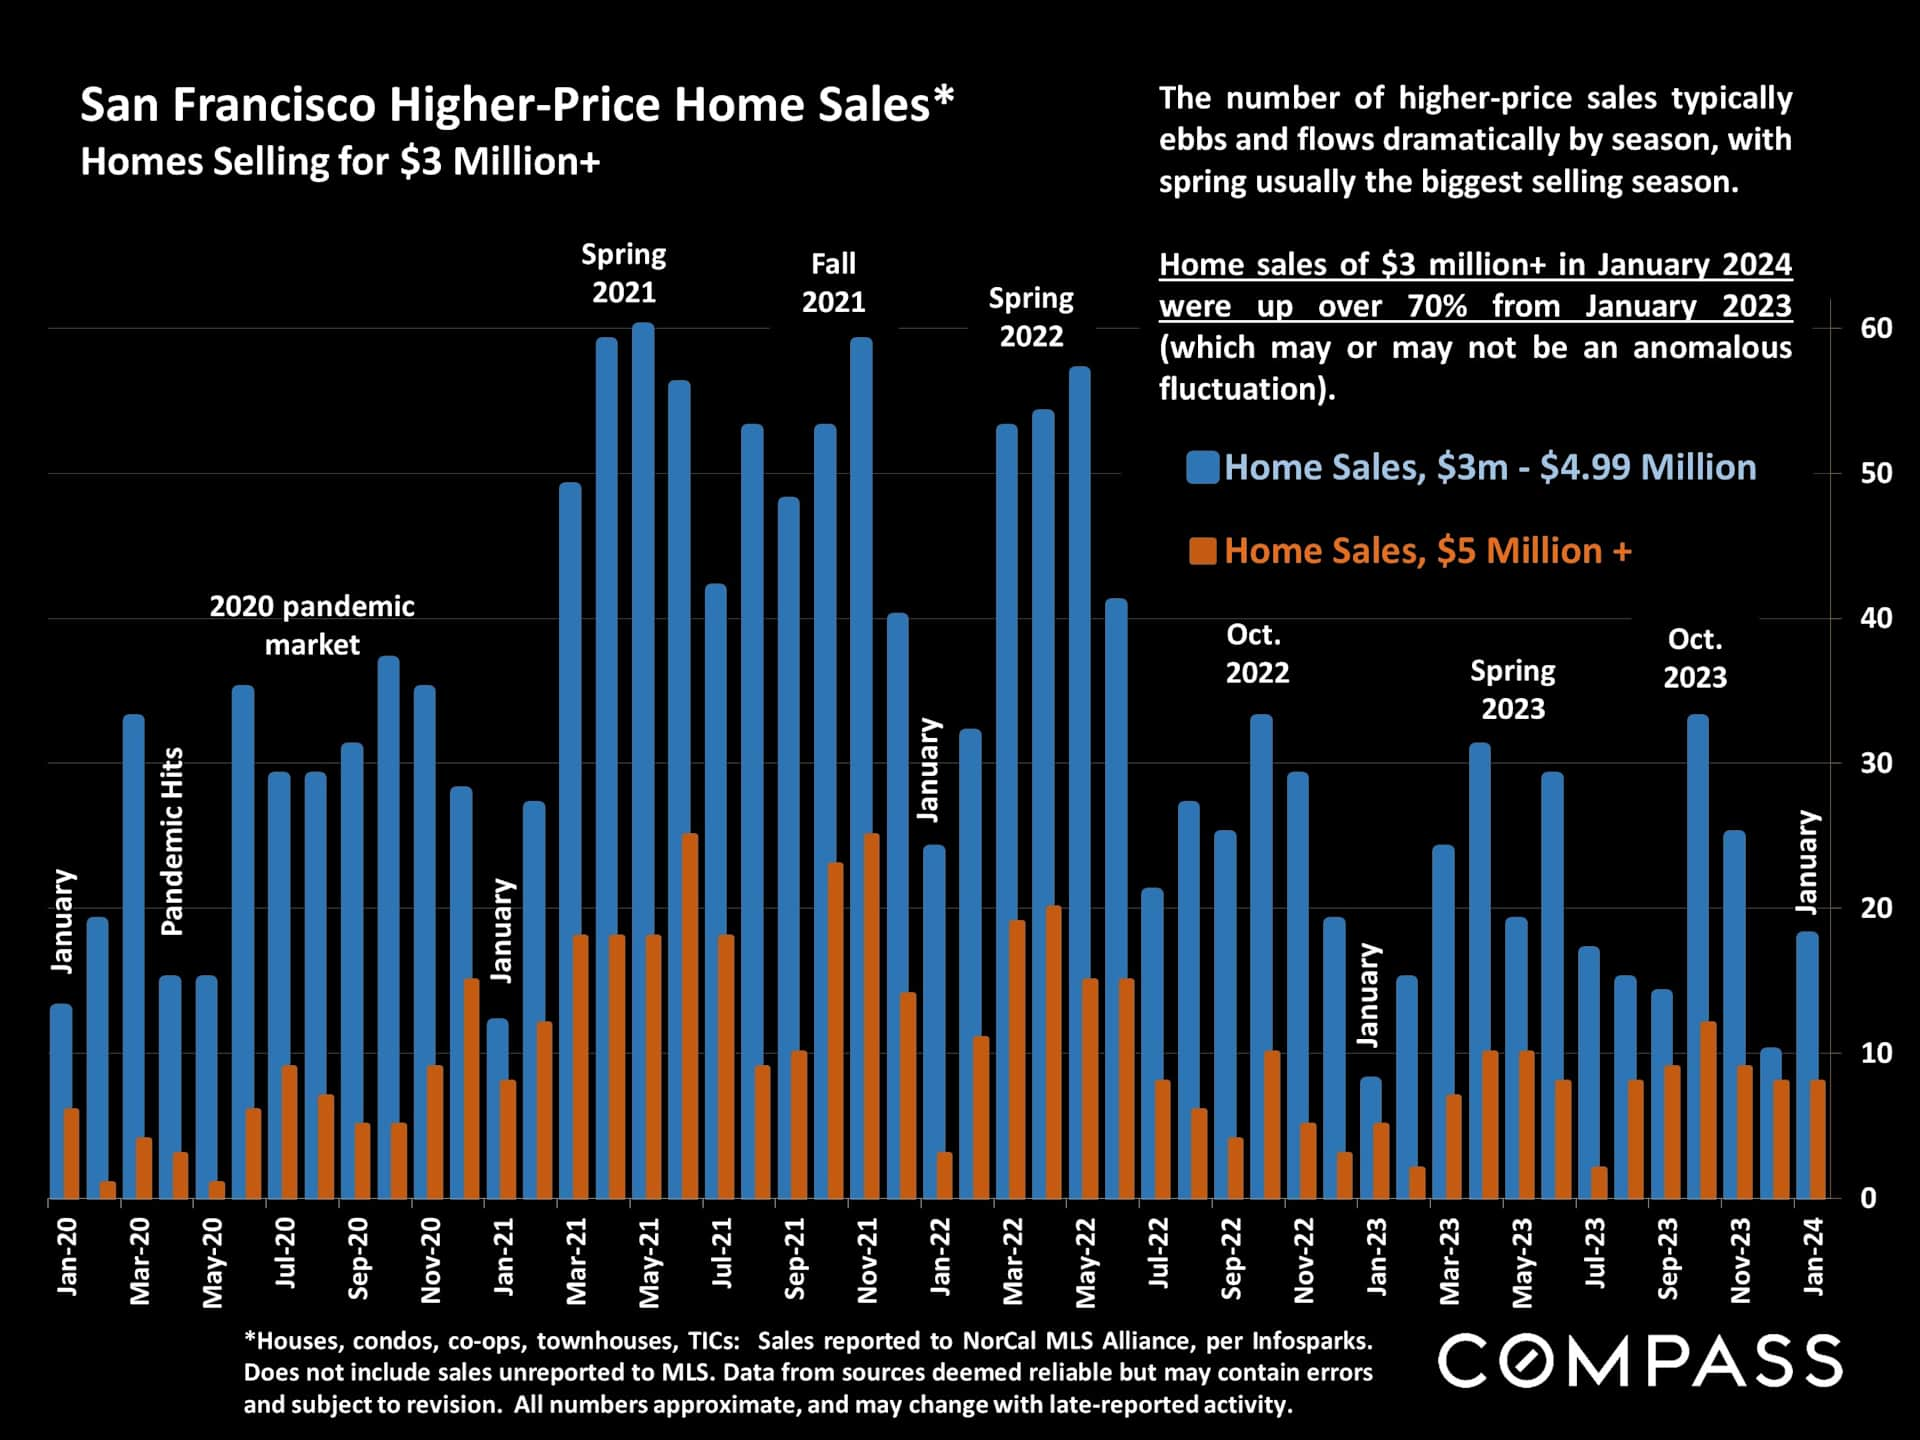
Bar chart comparing monthly San Francisco home sales of $3 million or more, January 2020–January 2024.

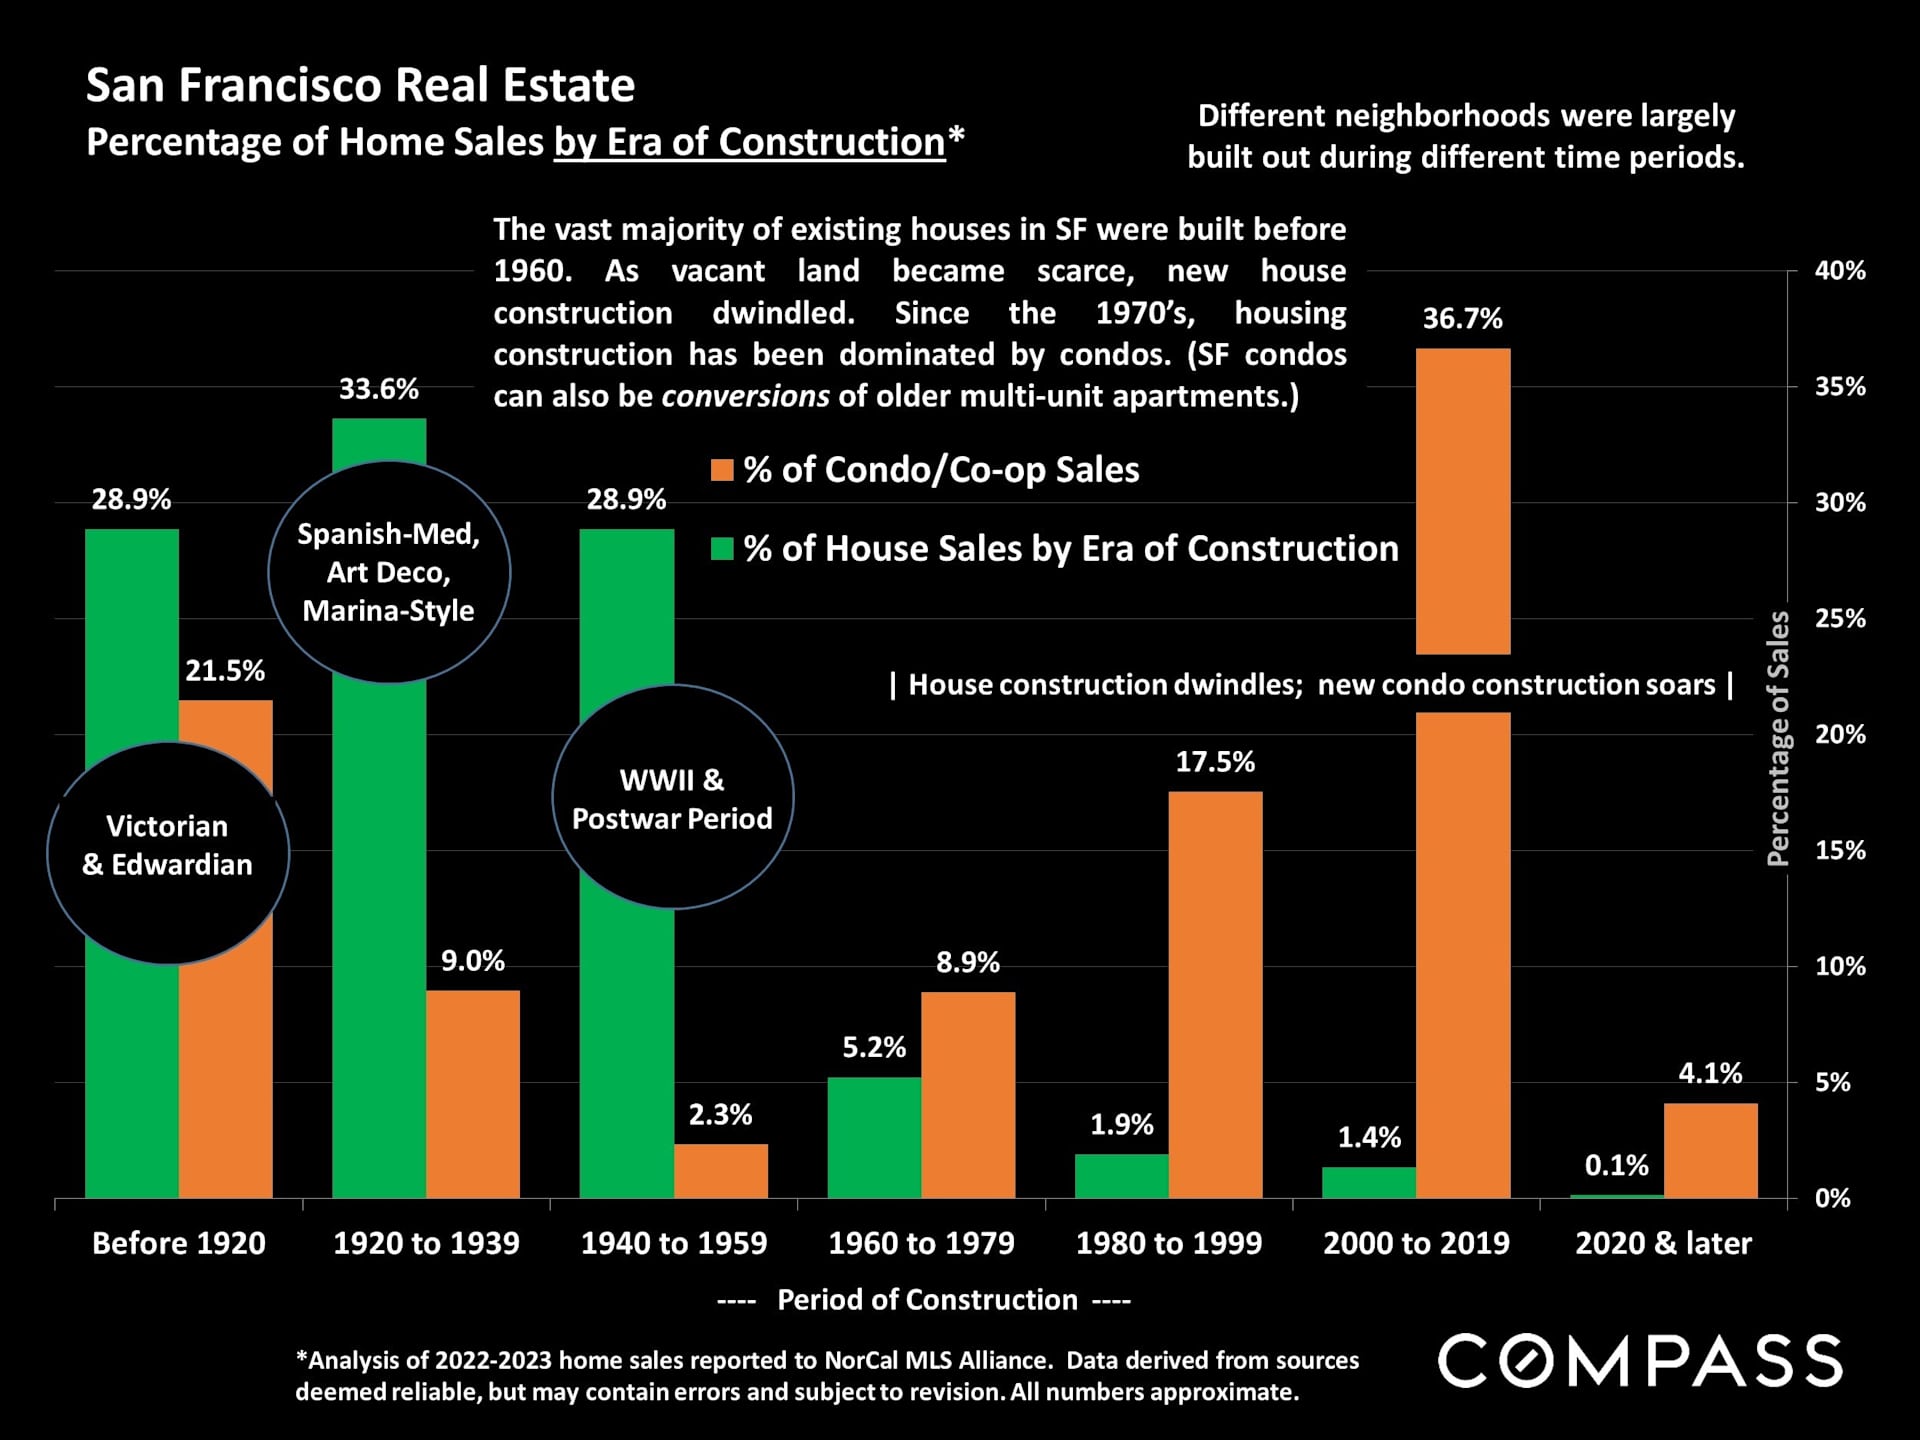
Bar chart comparing San Francisco house and condo/co-op sales by construction era, with percentages for seven periods.

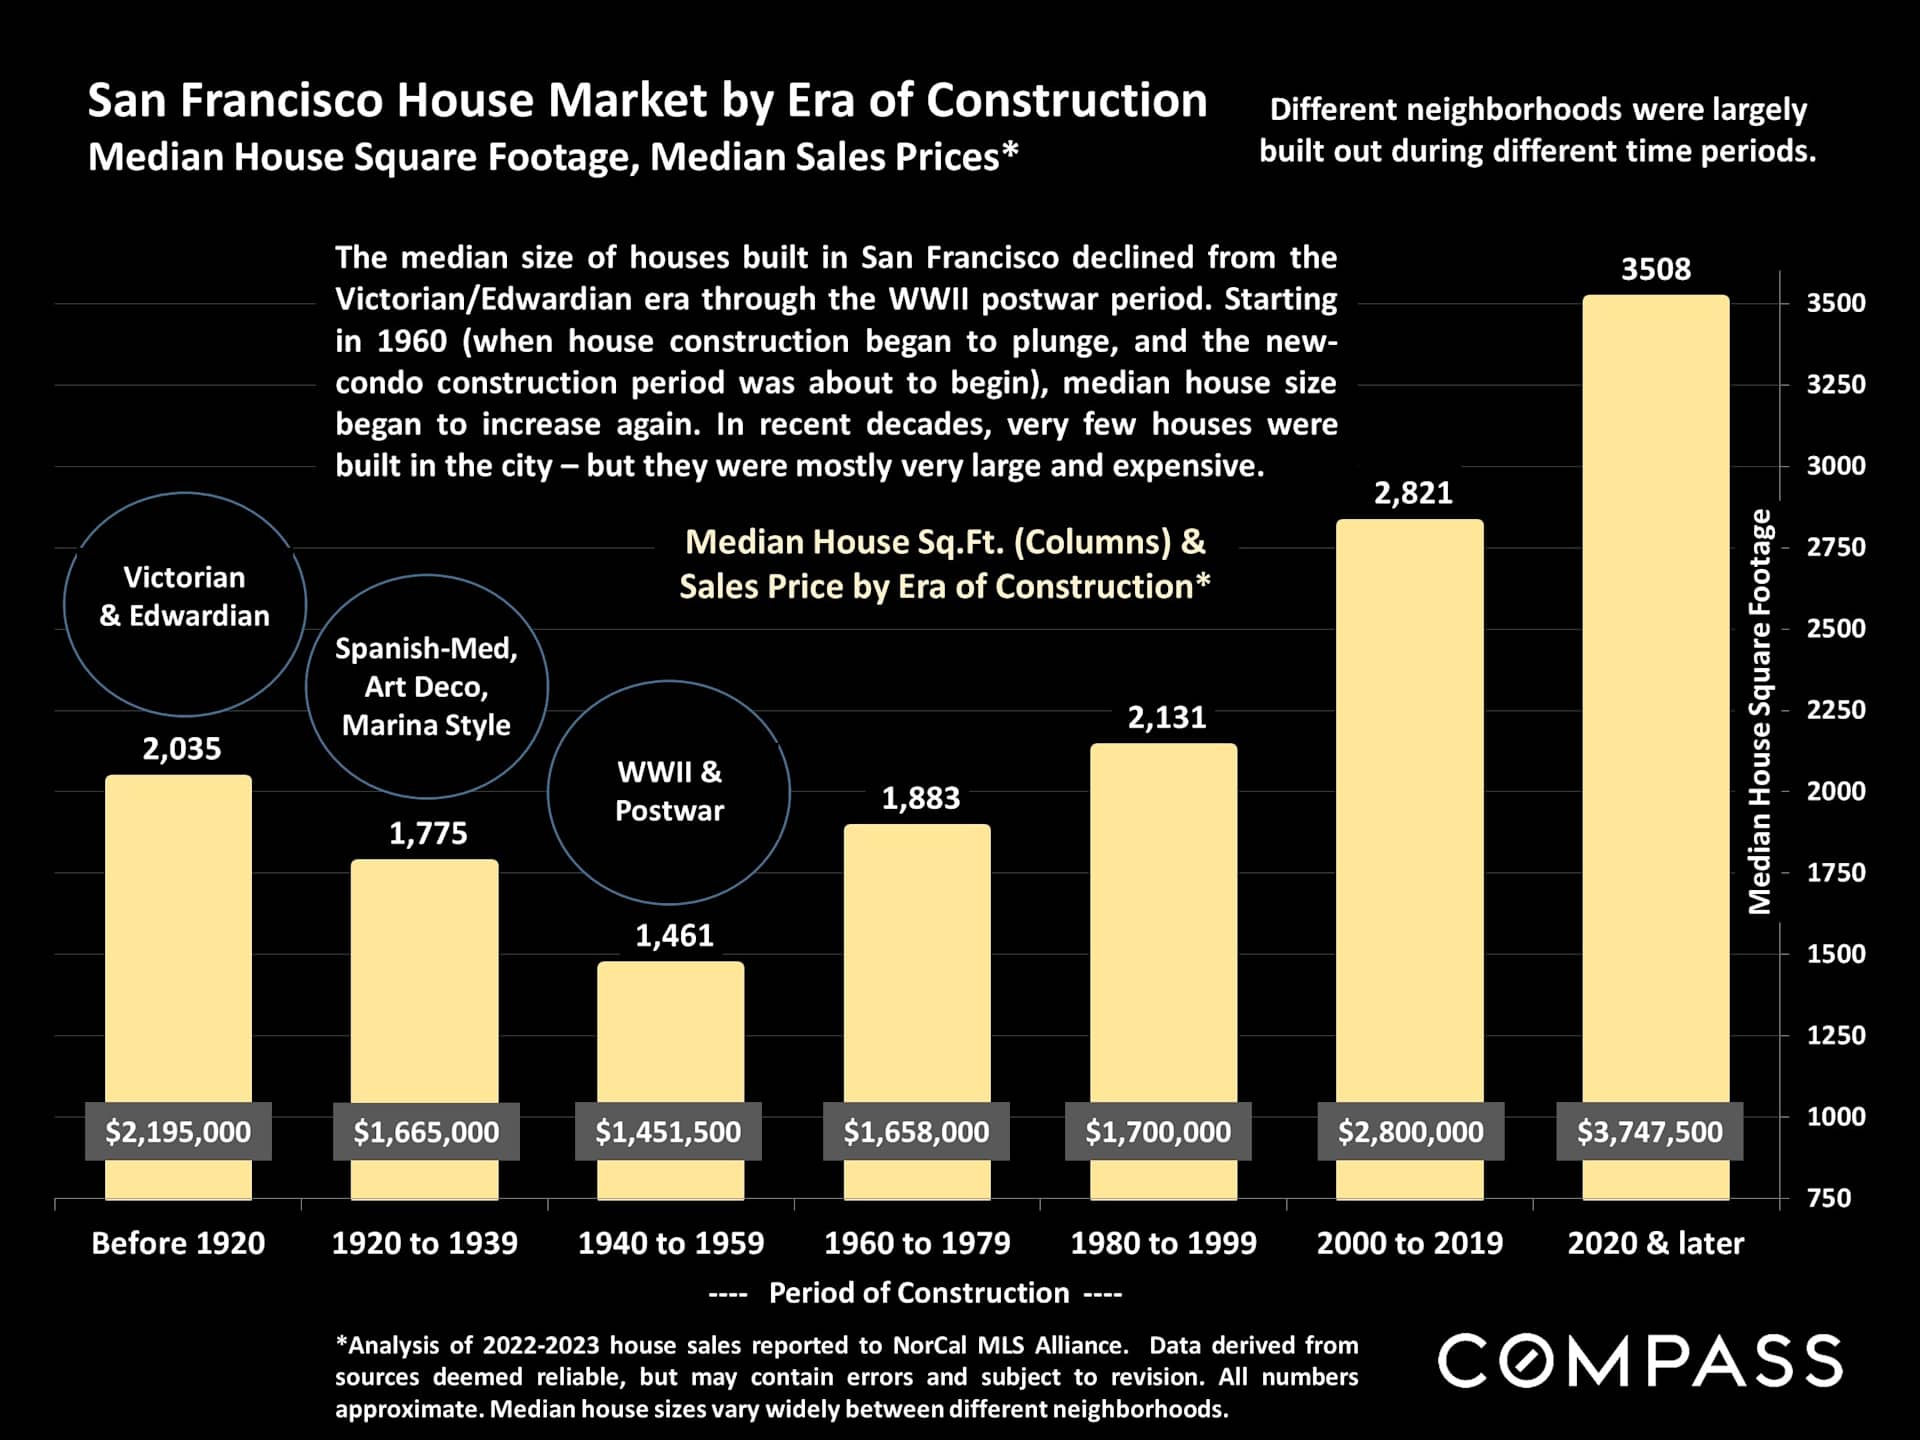
Infographic comparing San Francisco median house size and sale price across seven construction eras.

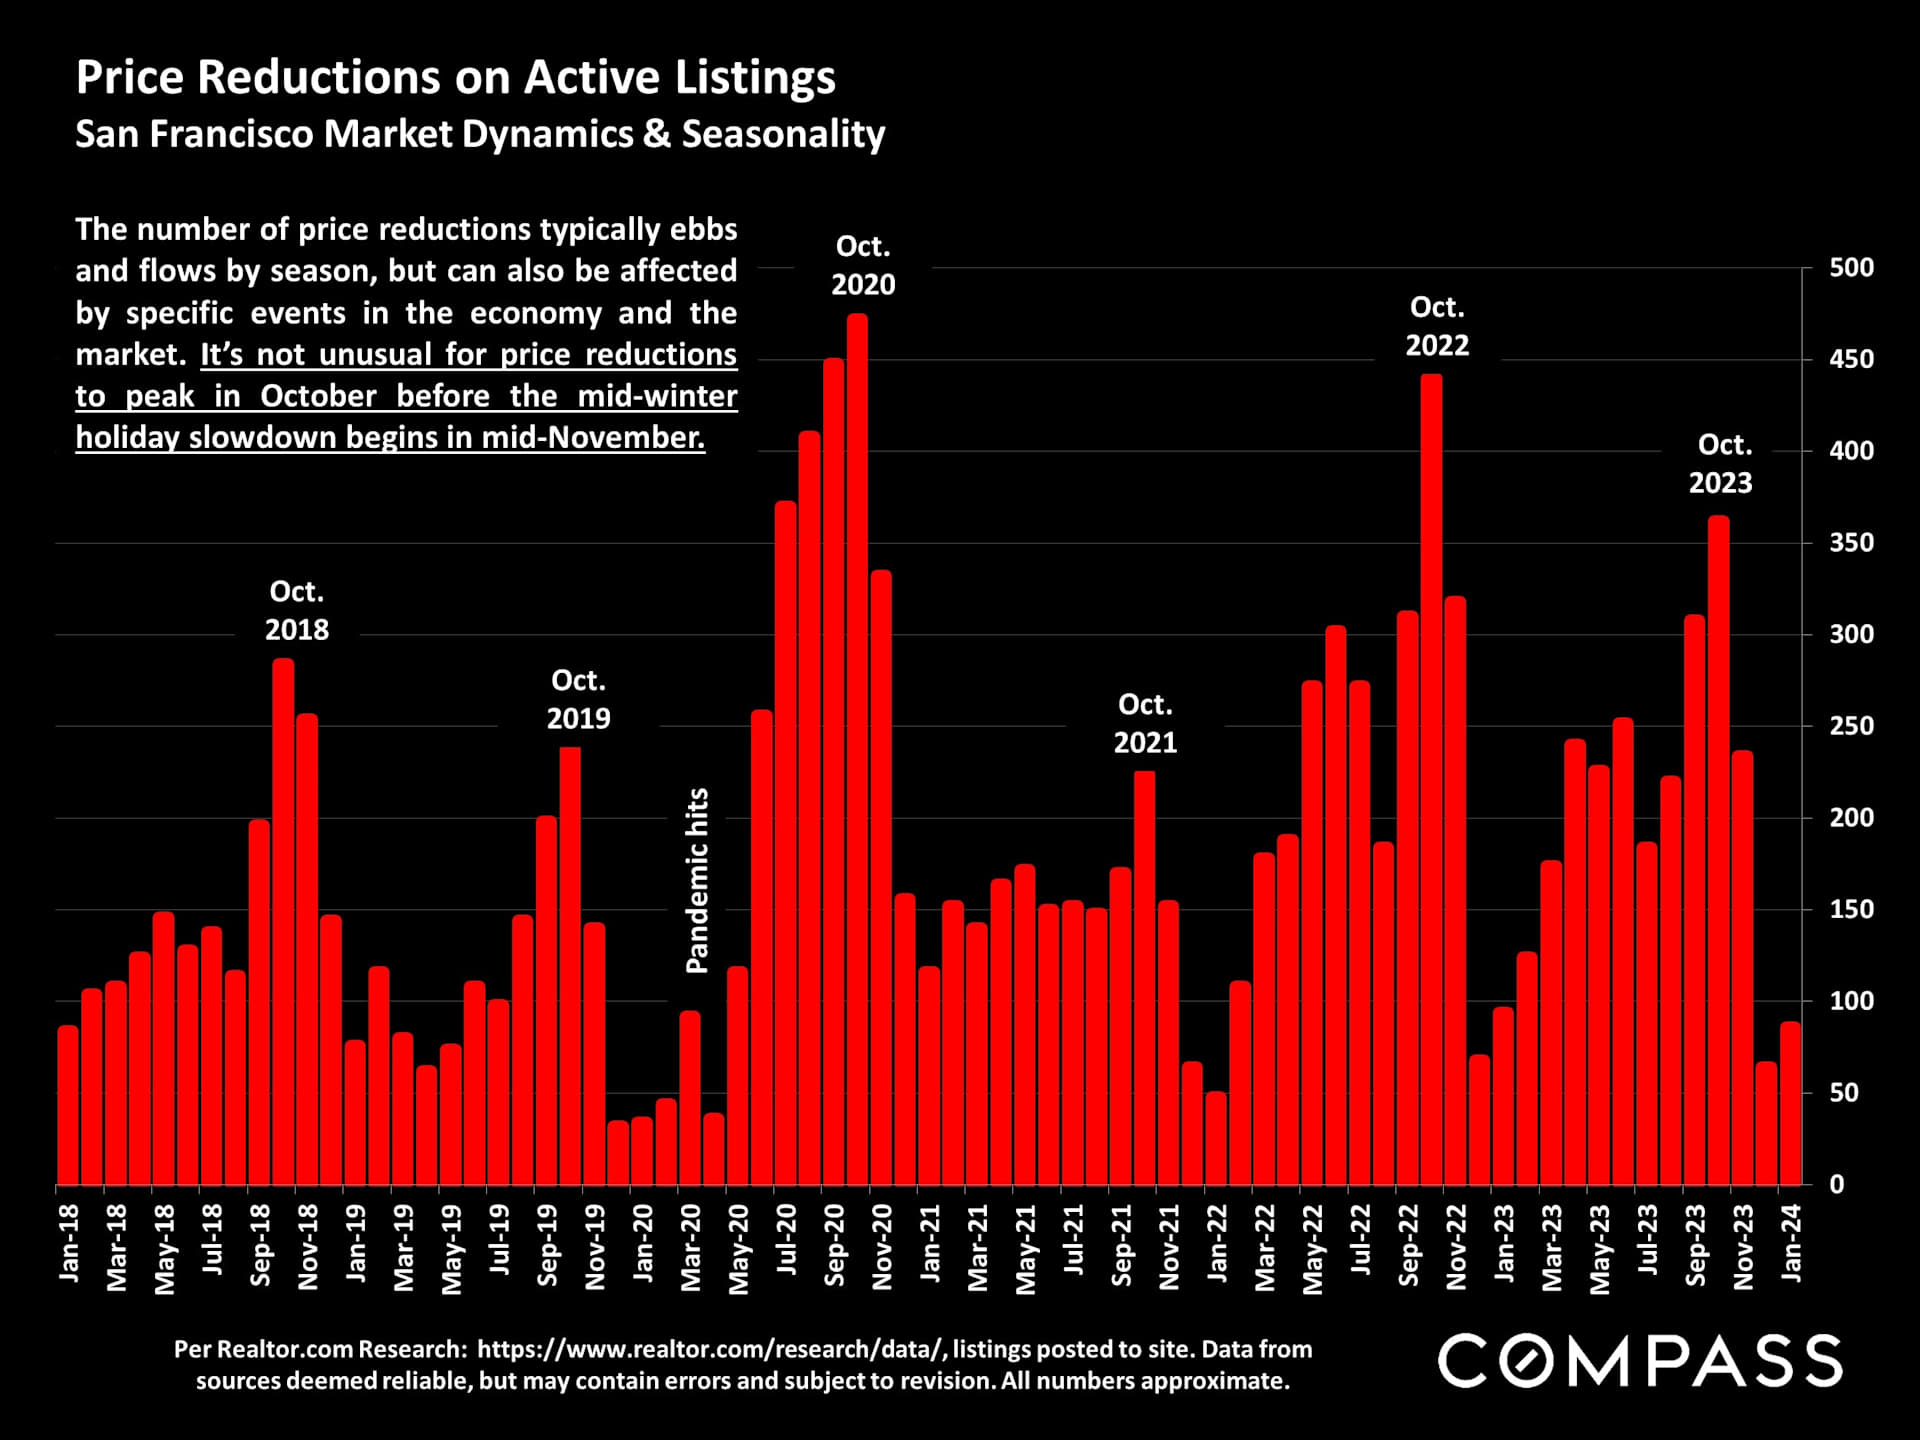
Chart of San Francisco active-listing price reductions, with monthly red bars and October peaks from 2018 to 2024.

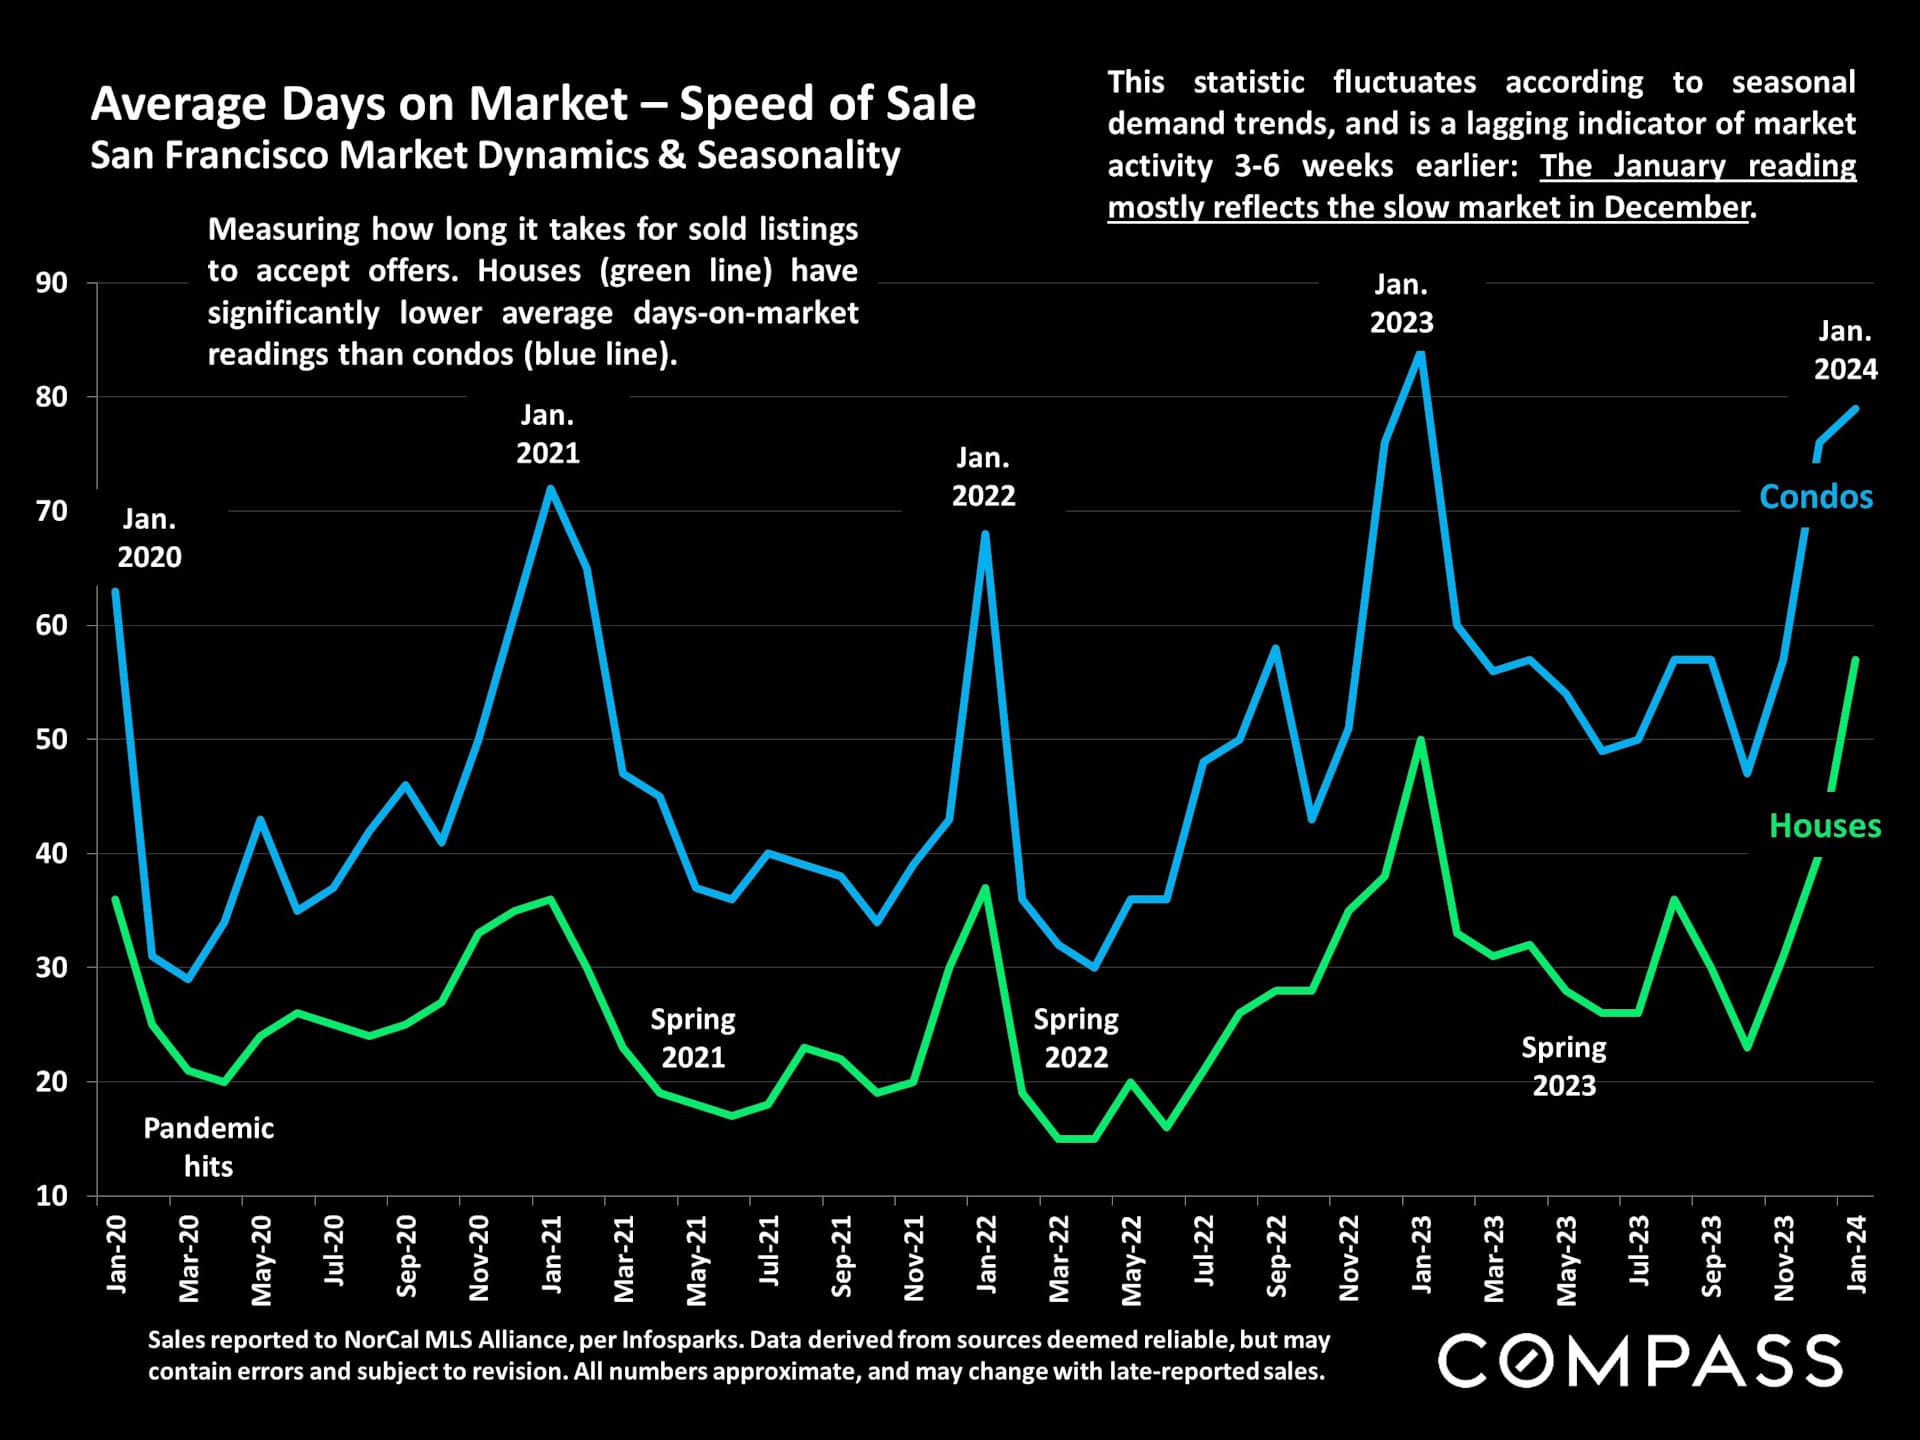
Line chart of San Francisco days on market, 2020–2024, with condos generally taking longer to sell than houses.

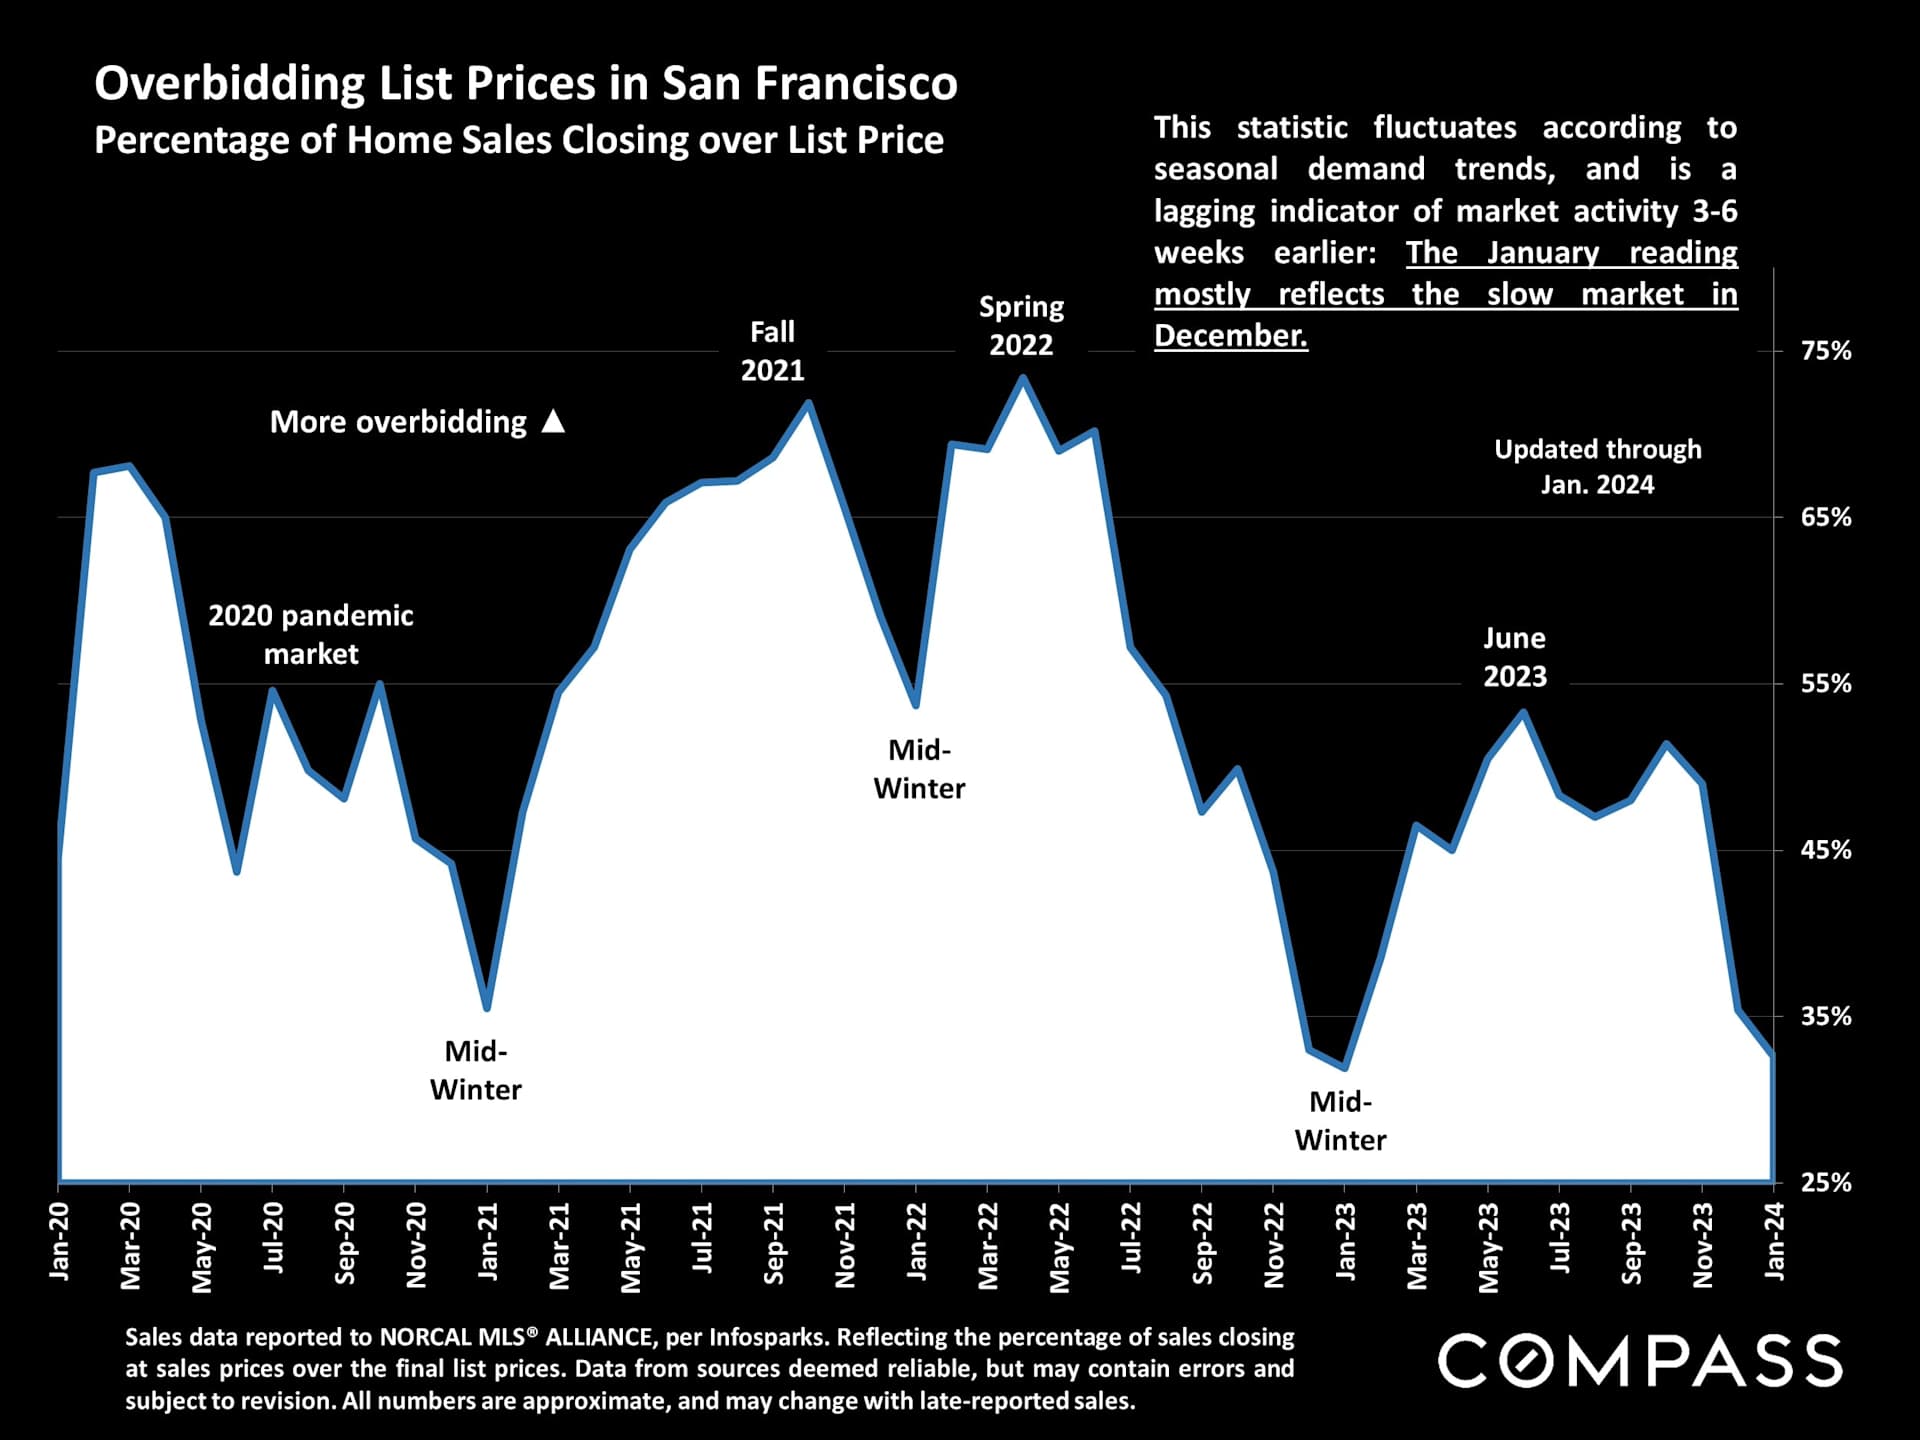
Chart of San Francisco home sales closing over list price, peaking near 70% in 2021–22 and falling to 33% by January 2024.

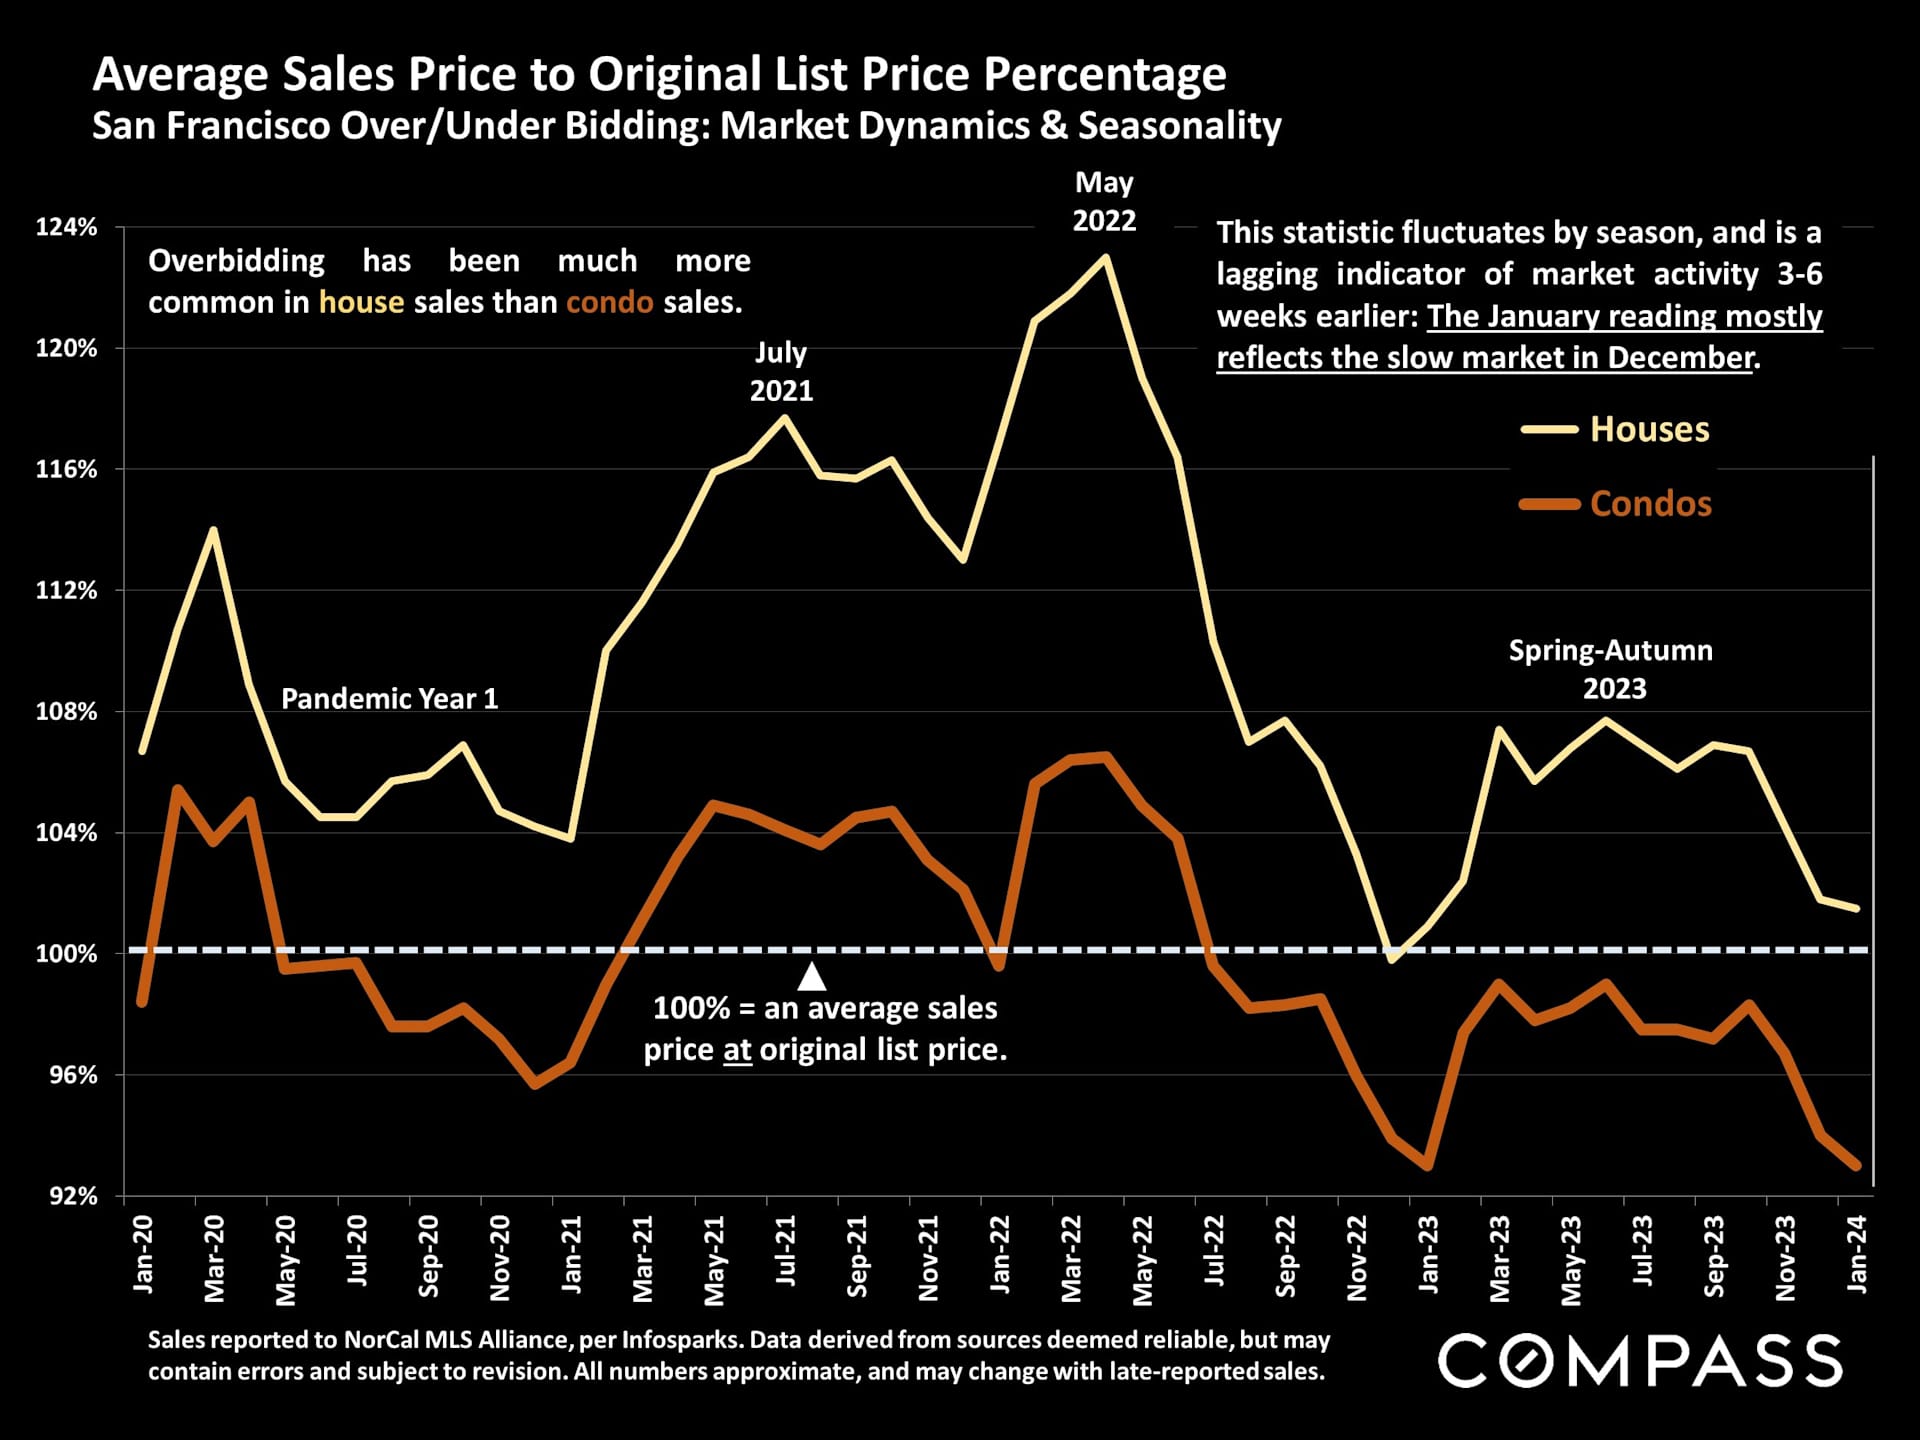
San Francisco home and condo sale-to-list price trends from 2020 to 2024, with houses generally outperforming condos.

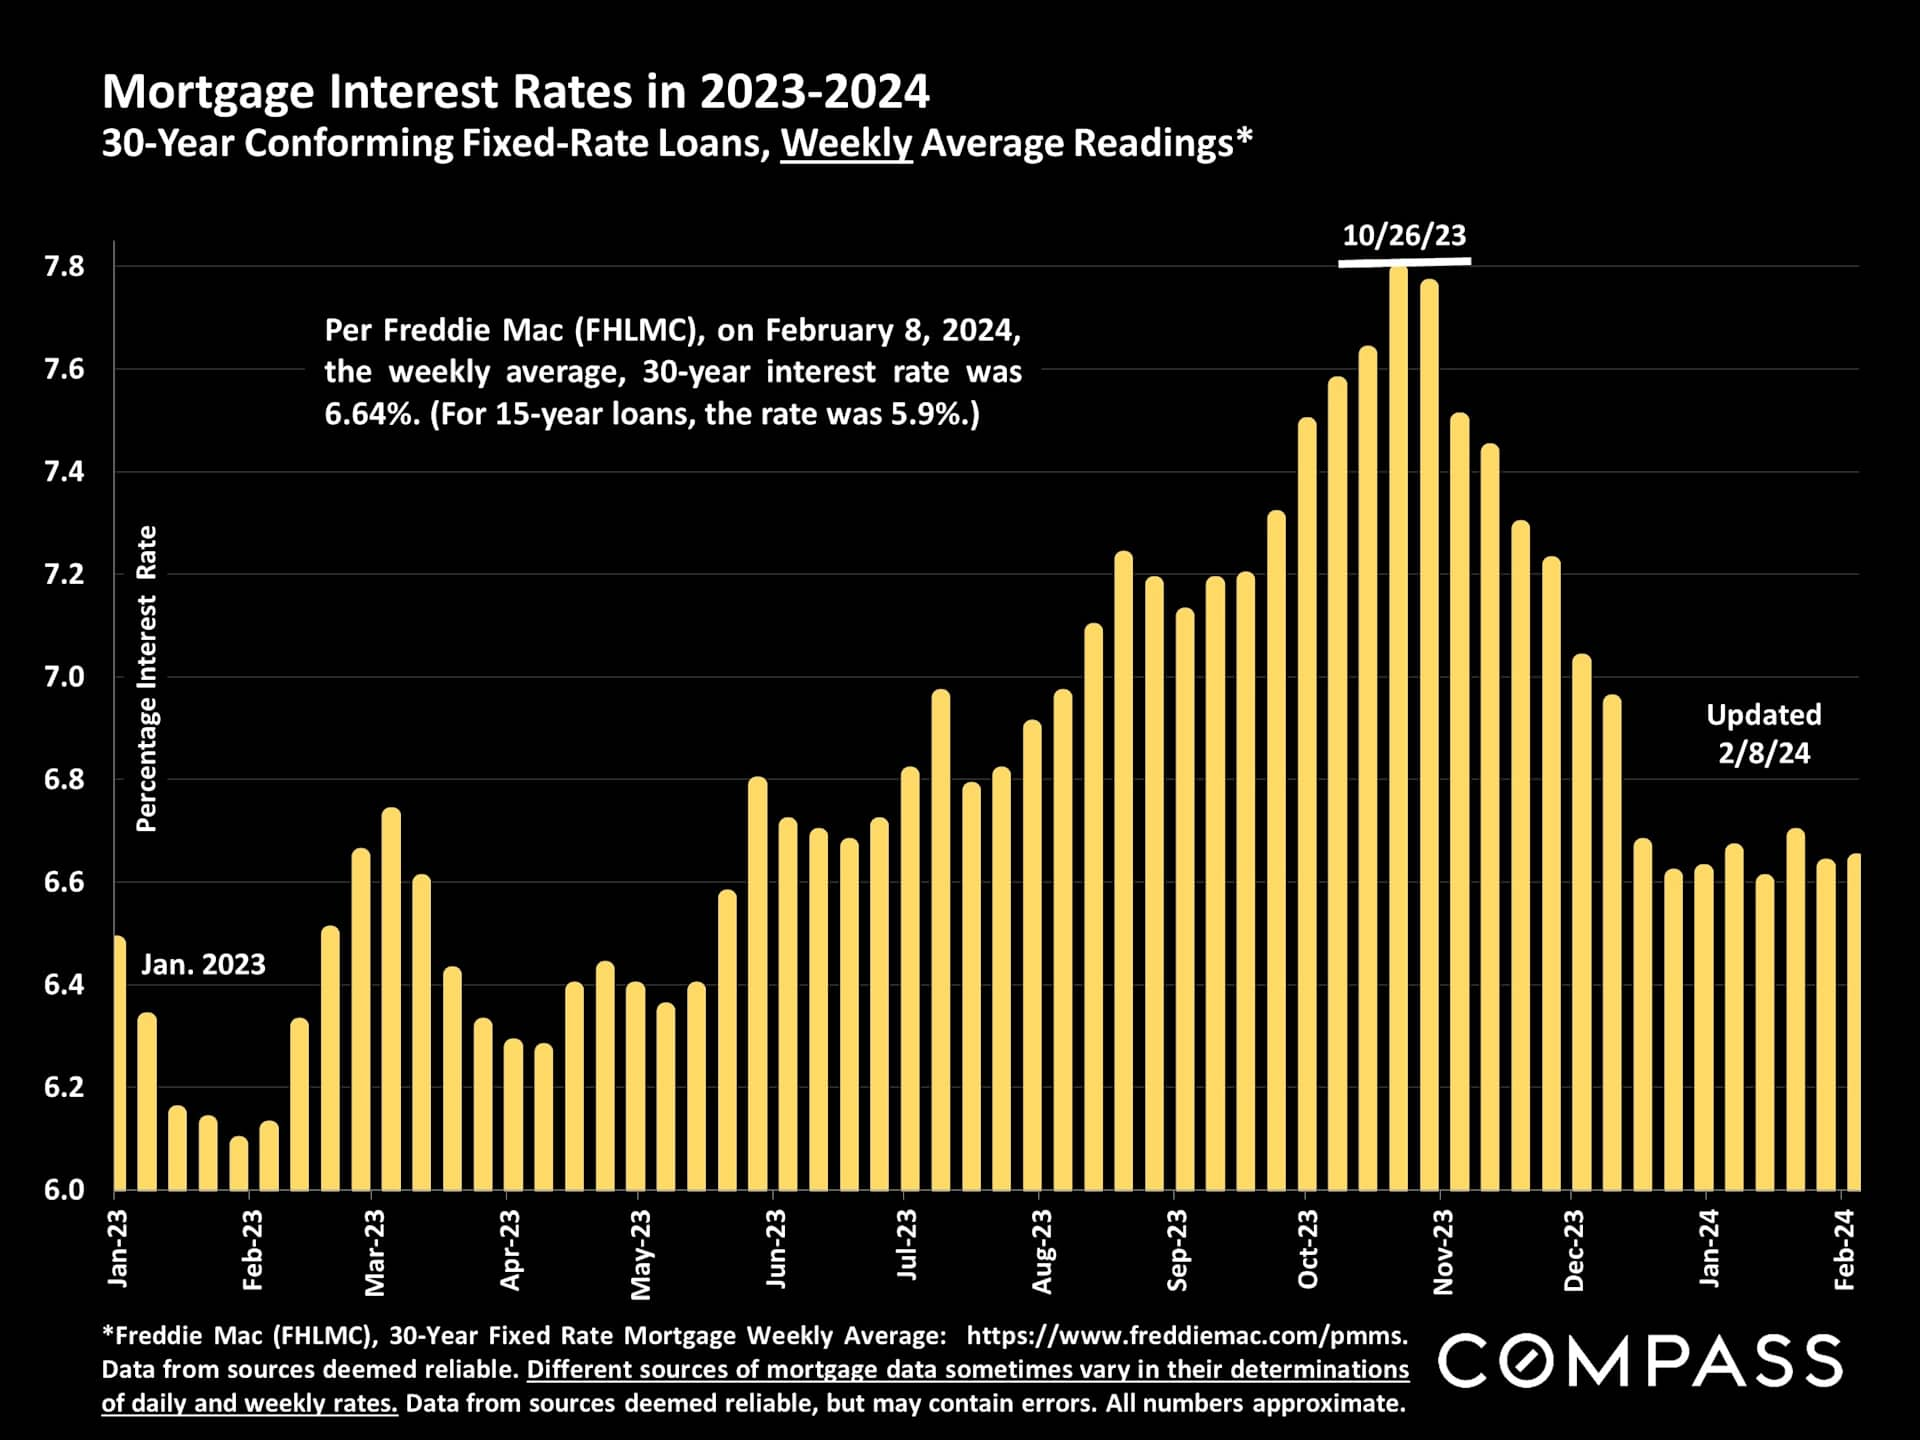
Chart of 30-year mortgage rates, peaking near 7.8% in October 2023 and easing to 6.6% by February 2024.

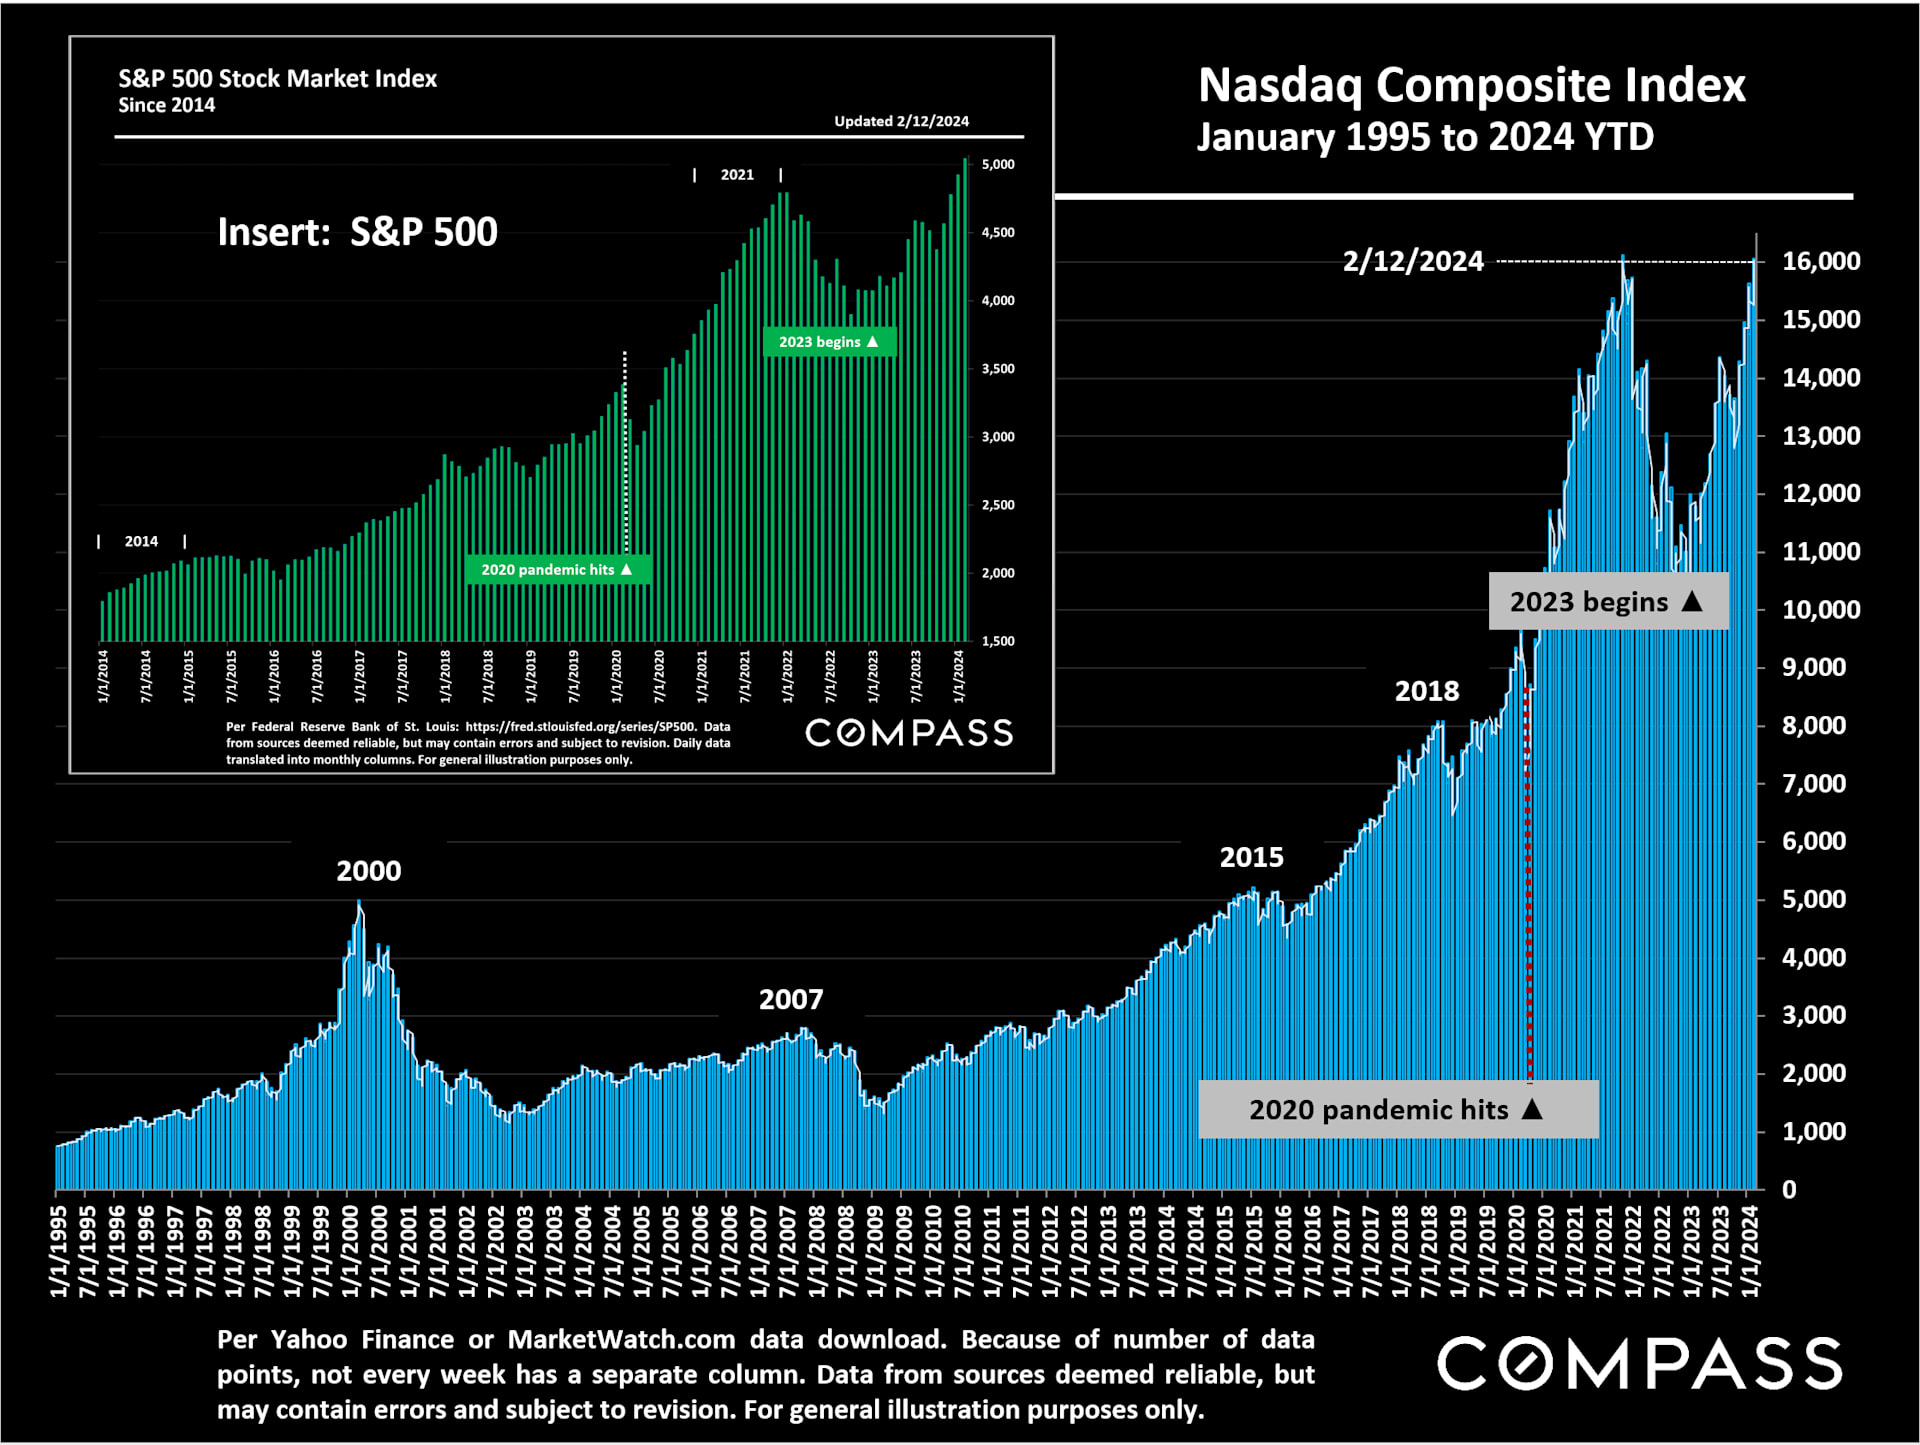
Stock markets continued their staggering rebound through yesterday. The S&P passed 5000 for the first time, but fell back slightly below this morning; the Nasdaq remains within a whisker of its all-time high in 2021.

Infographic charts Nasdaq Composite and S&P 500 indexes through February 2024, marking major market events.

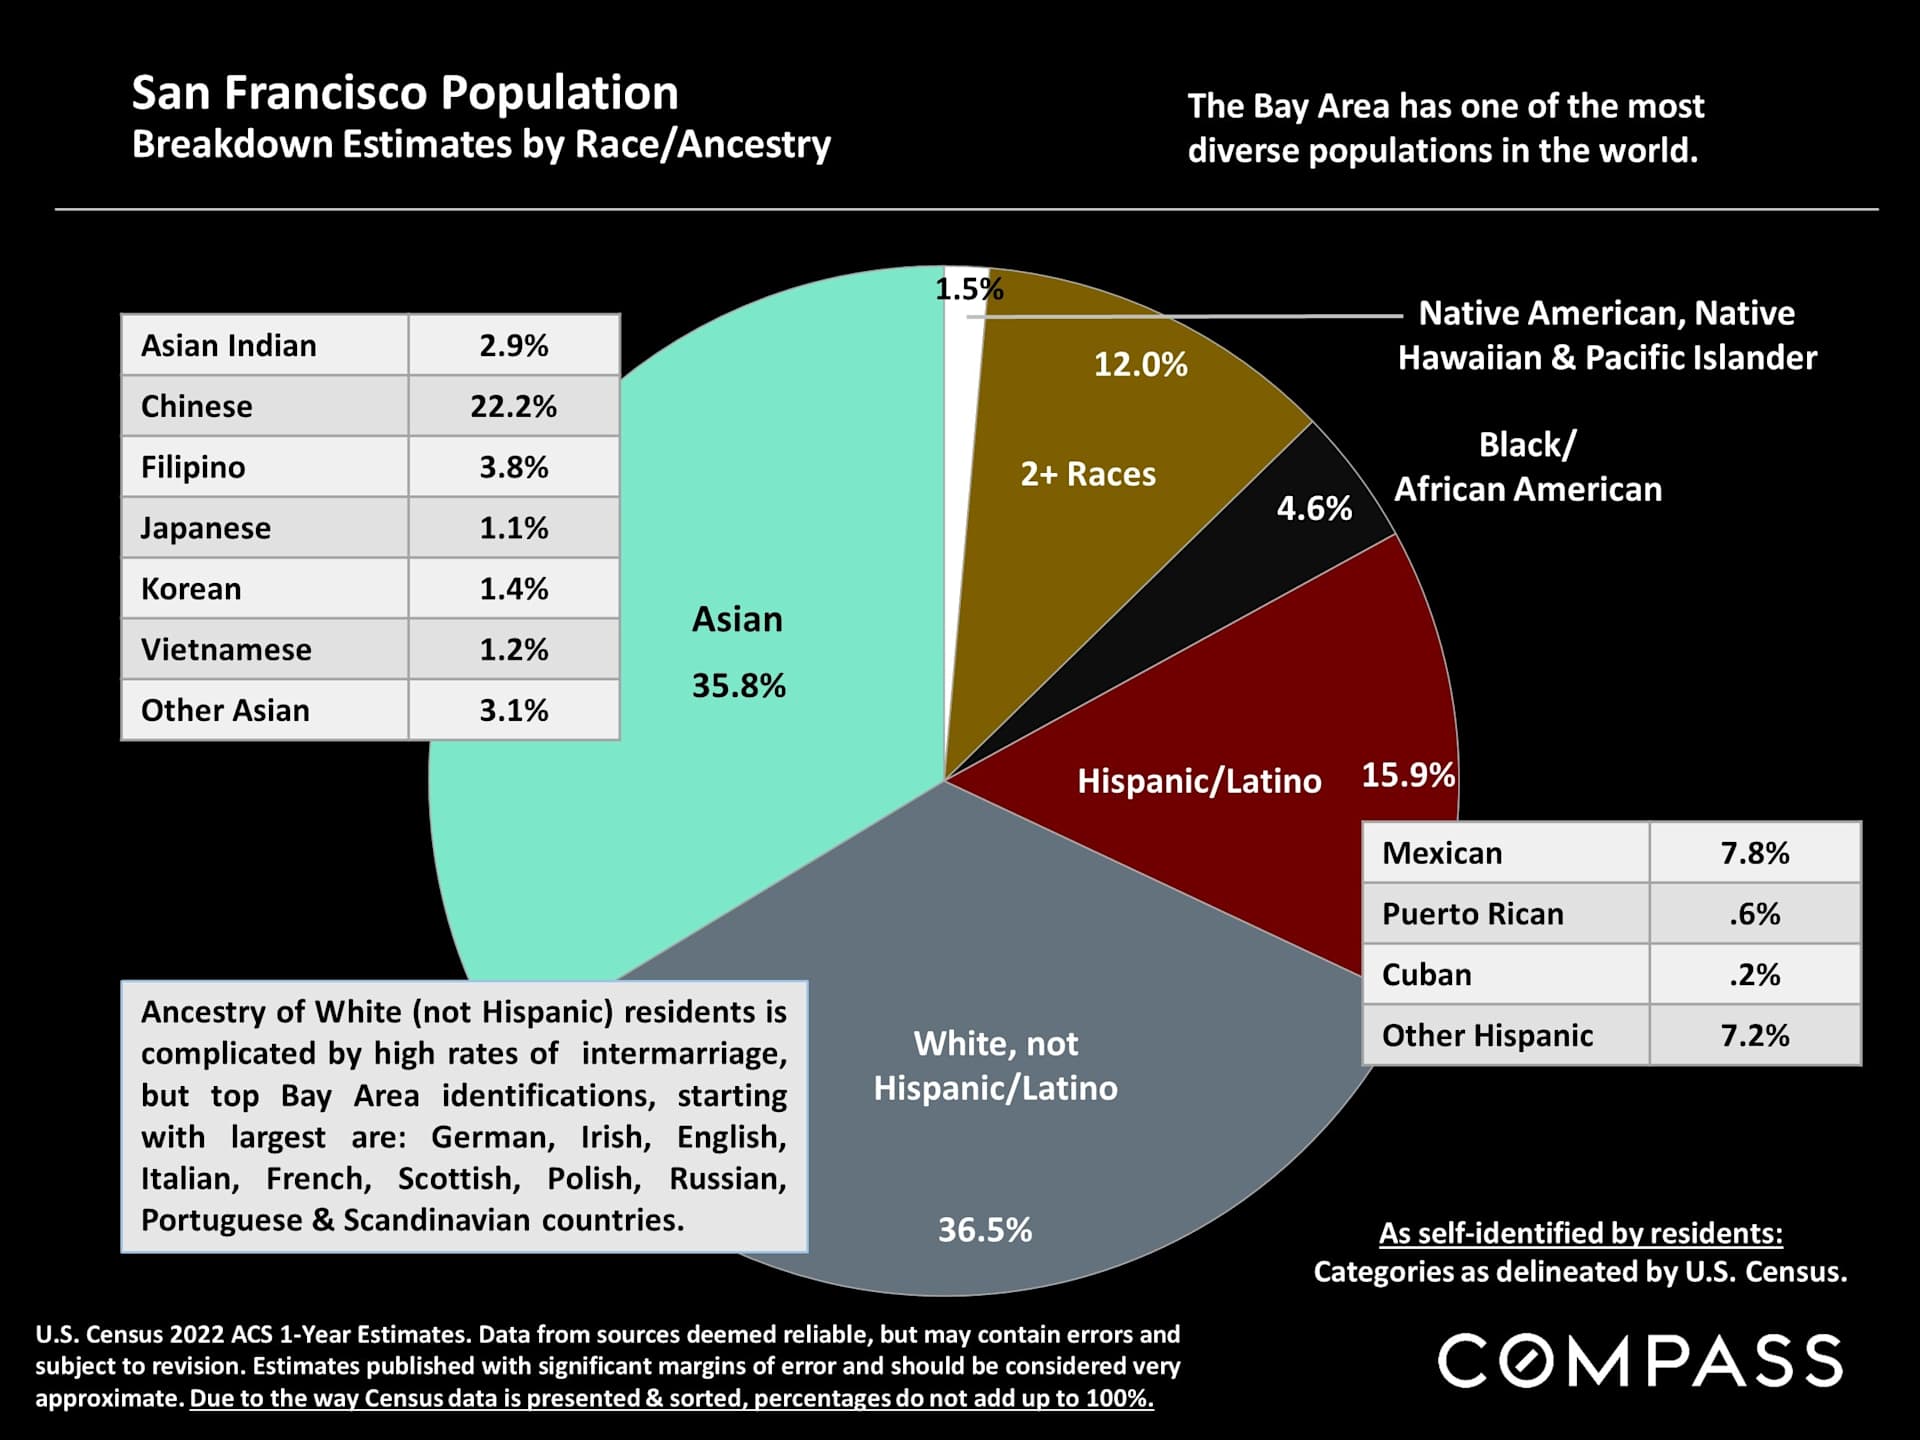
San Francisco population breakdown infographic with race and ancestry estimates, including 36.5% White and 35.8% Asian.

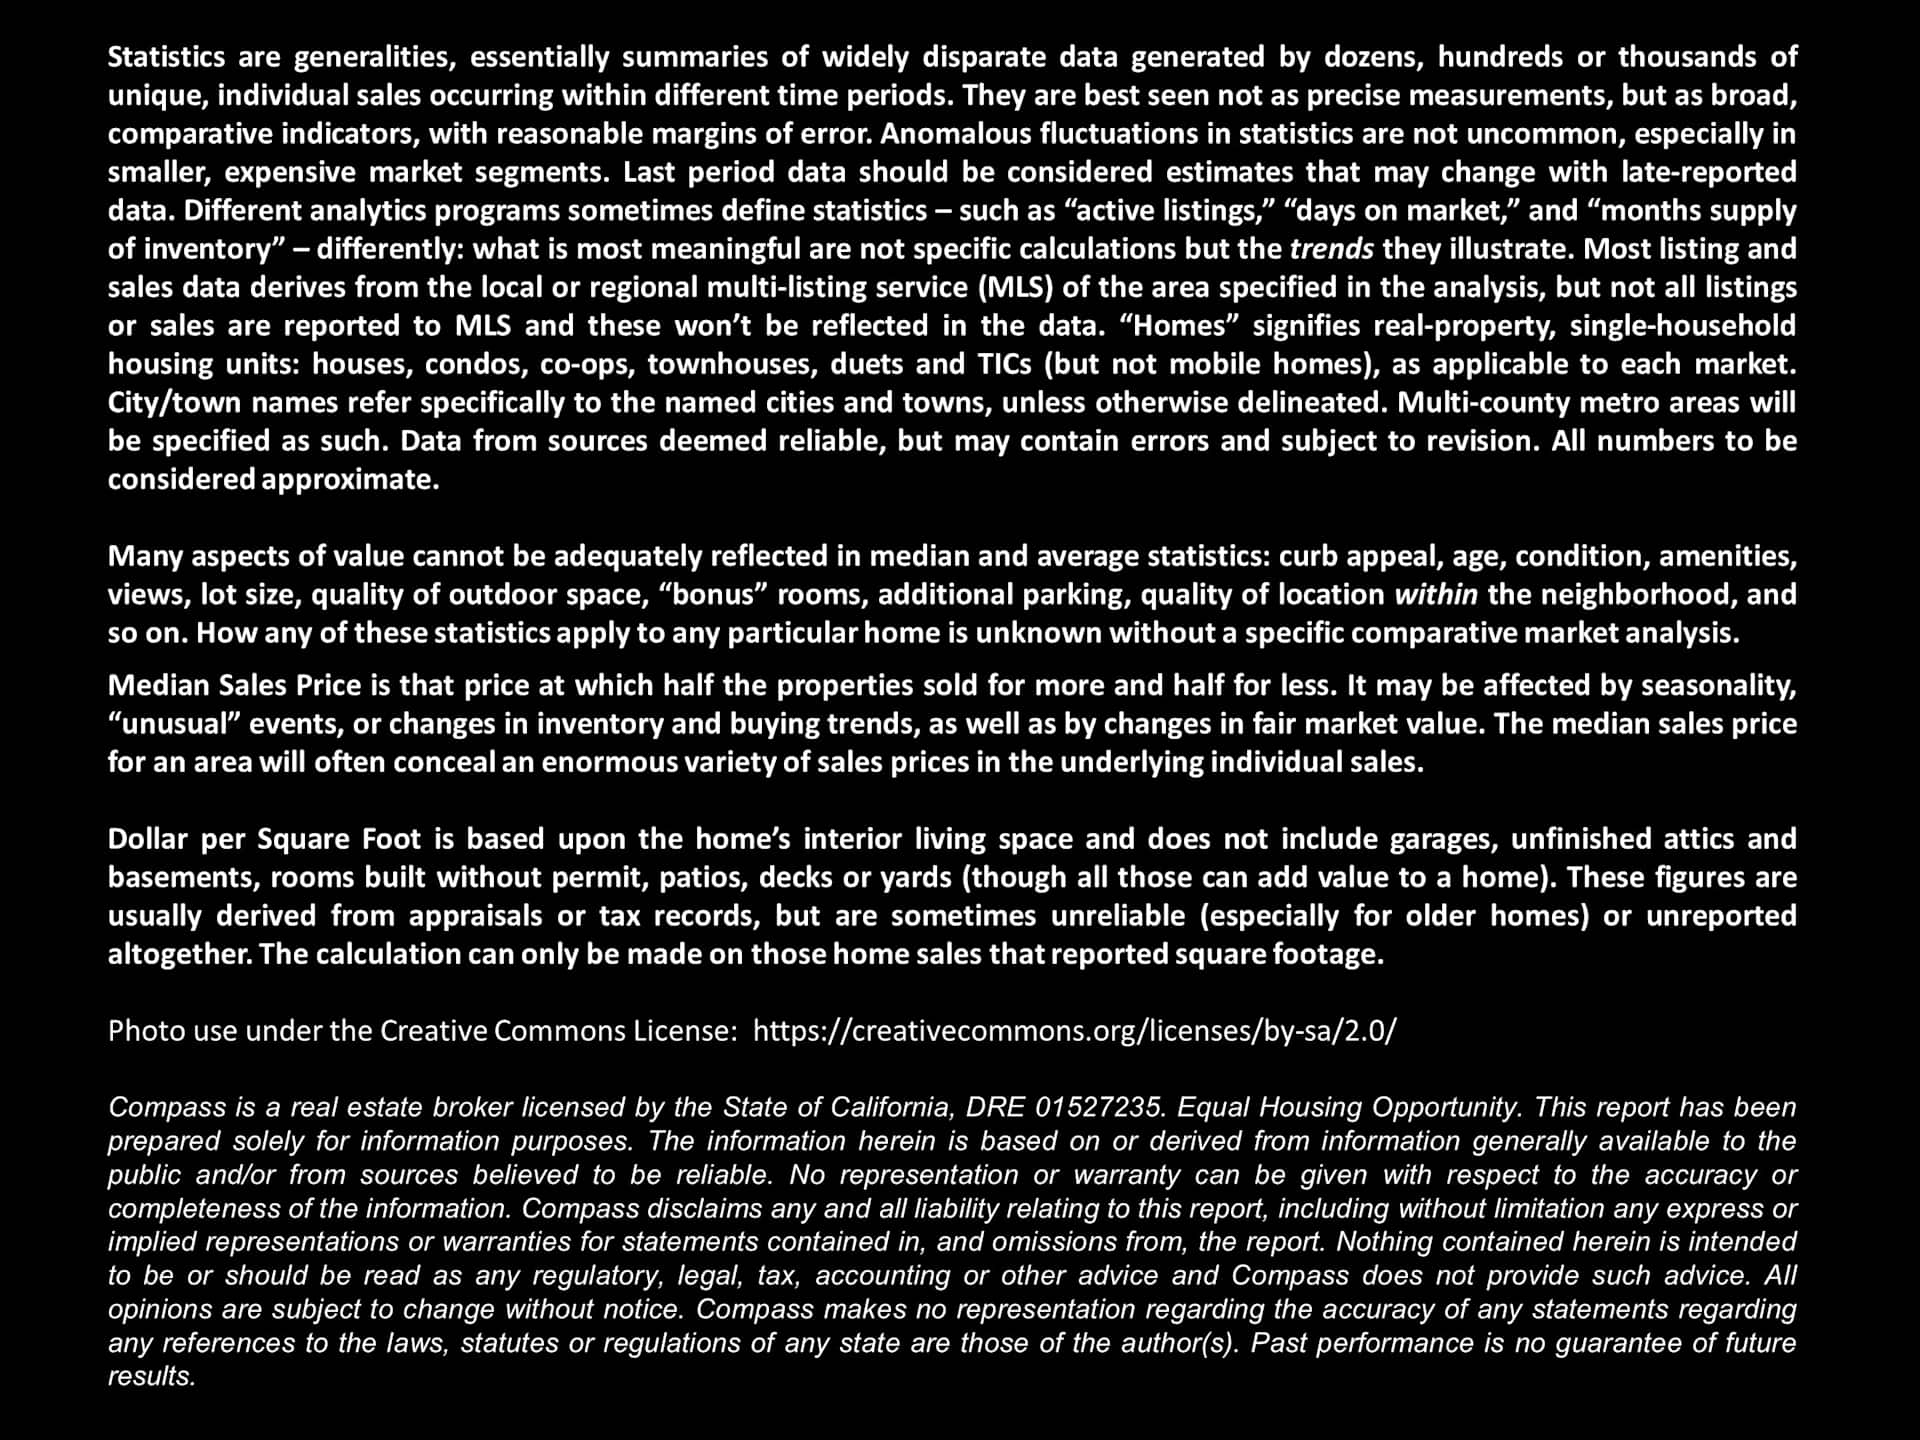
Real estate report notes explaining market statistics, home-value metrics, photo licensing, and Compass disclaimers.

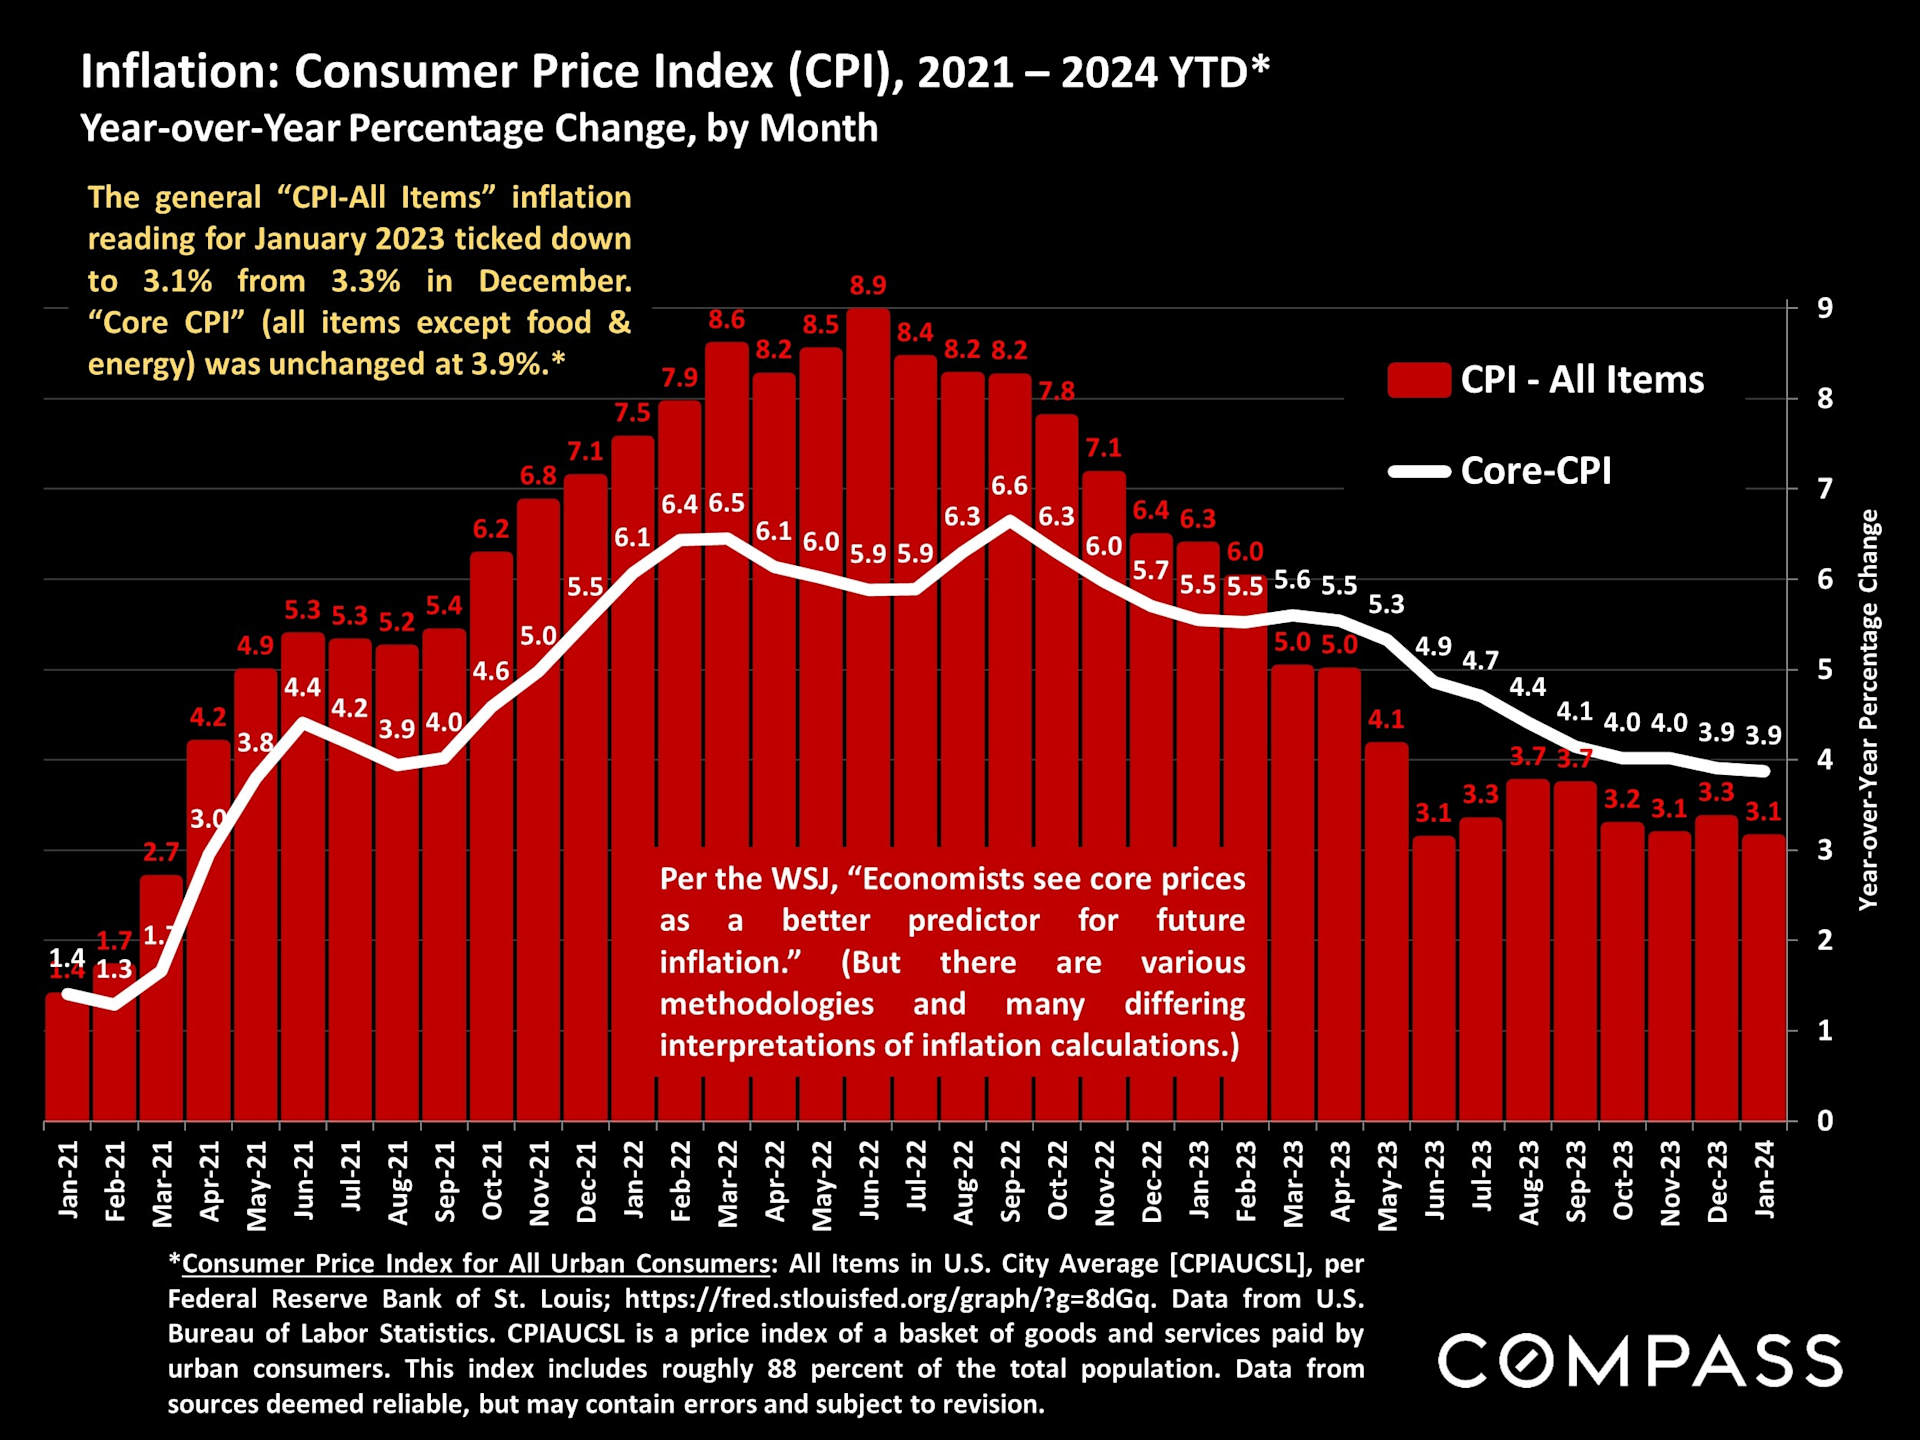
The latest inflation report was just released: Both financial and bond markets were hoping for more significant declines. As of late morning (ET), stock markets were down a little over 1%, and the 10-year Treasury bill yield rate was up. According to the WSJ, the new reading implies that while the Fed had been expected to begin cutting its benchmark rate earlier, now "a June start date is more likely." Of course, guessing what the Fed will do is a very iffy game, to which analysts and economists are addicted.

Chart of U.S. CPI and core inflation from January 2021 to January 2024, with red bars and a white line.

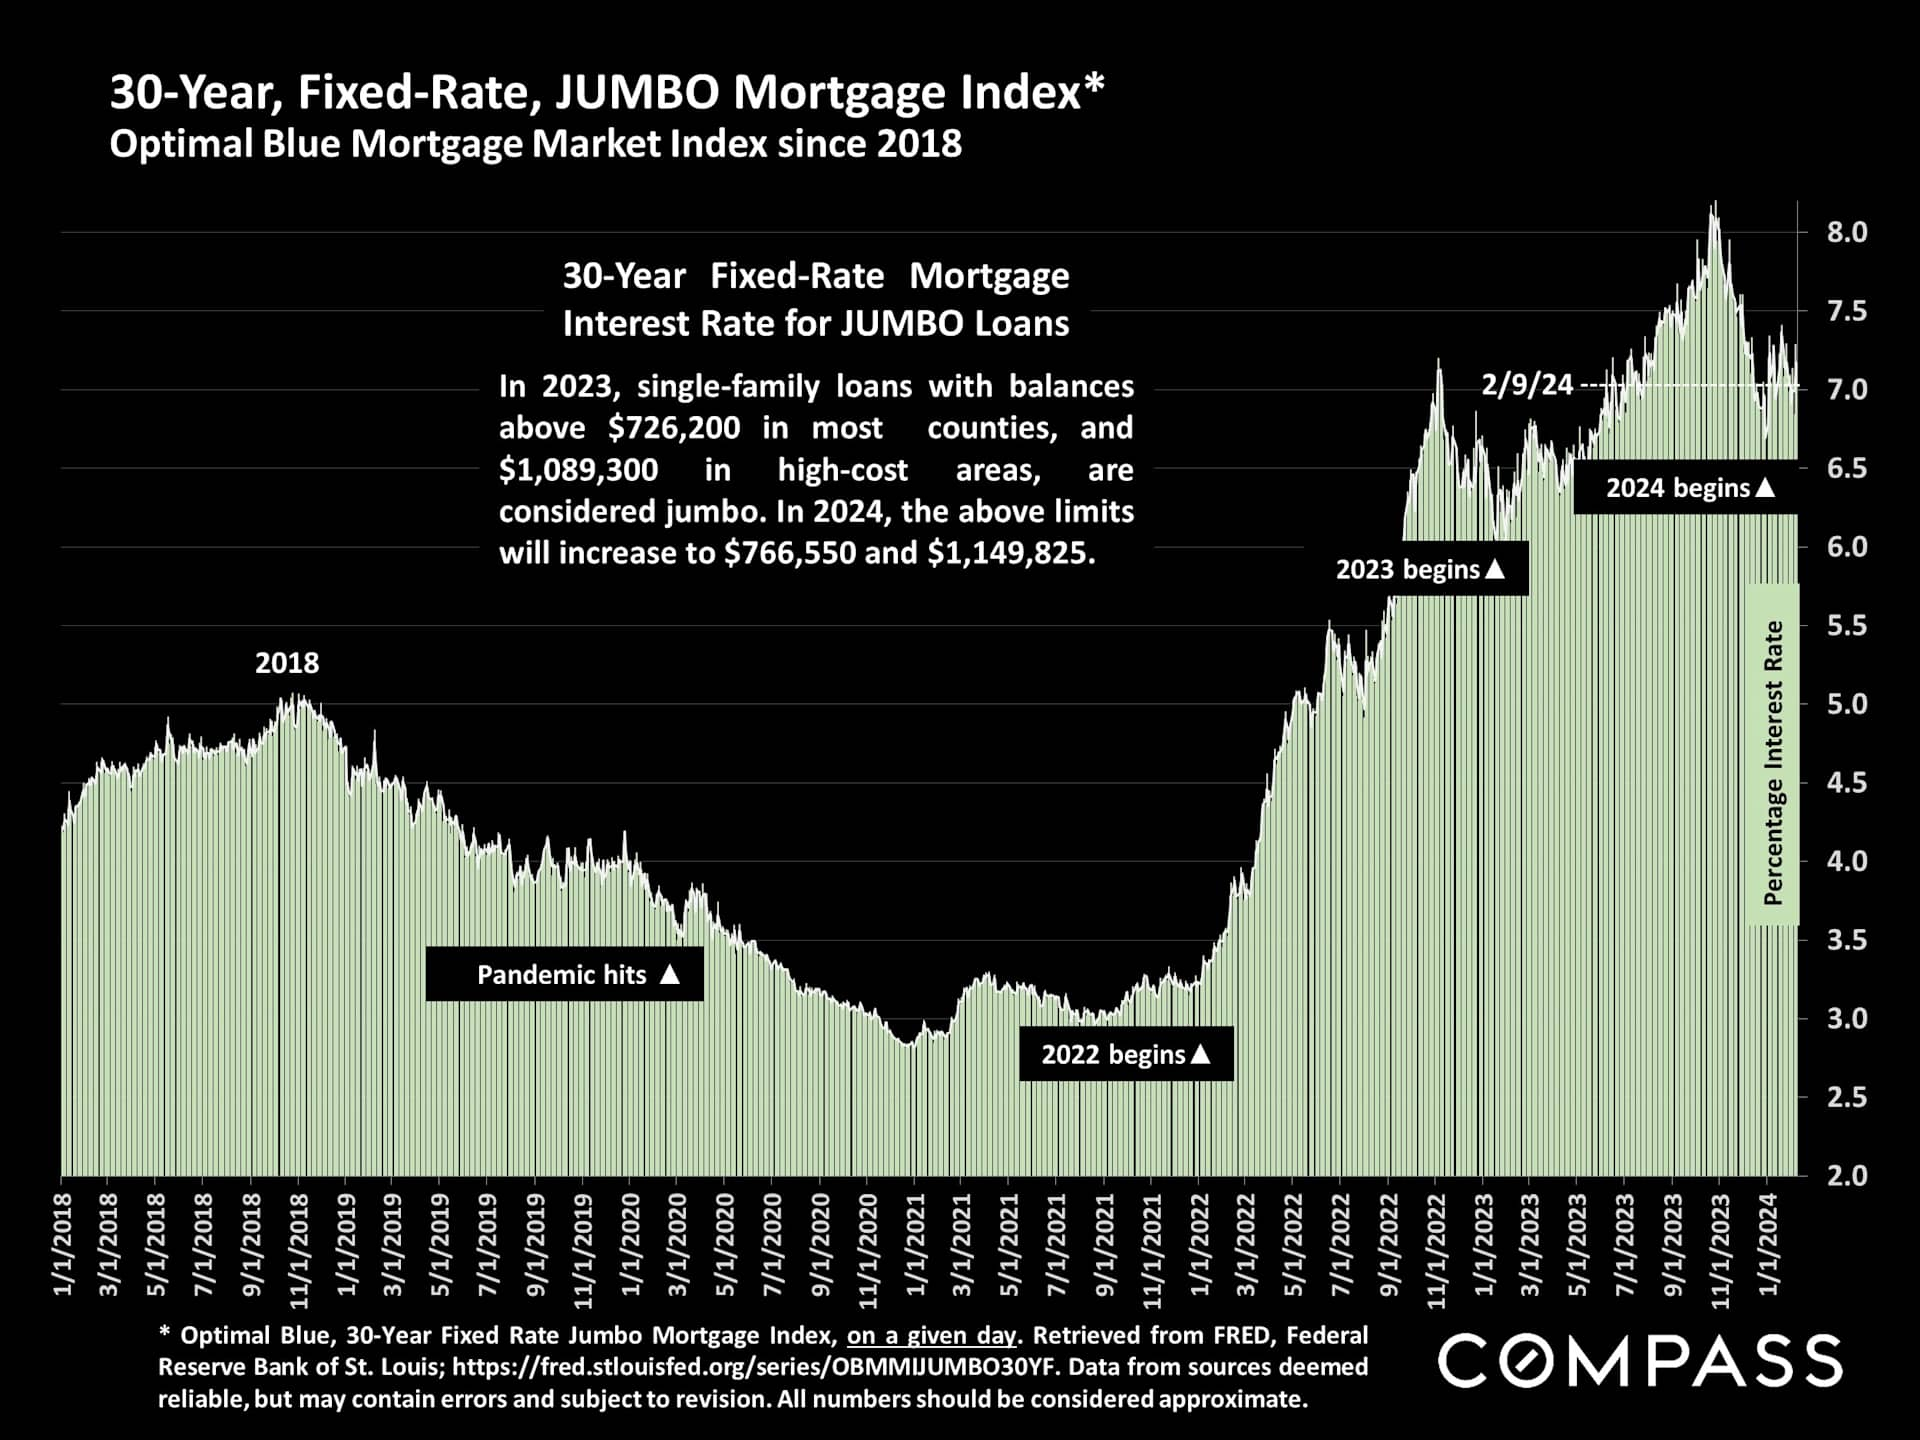
Interest rates, 30-year jumbo Mortgage. 

Chart of jumbo 30-year fixed mortgage rates from 2018 to February 2024, peaking above 8% in 2023.

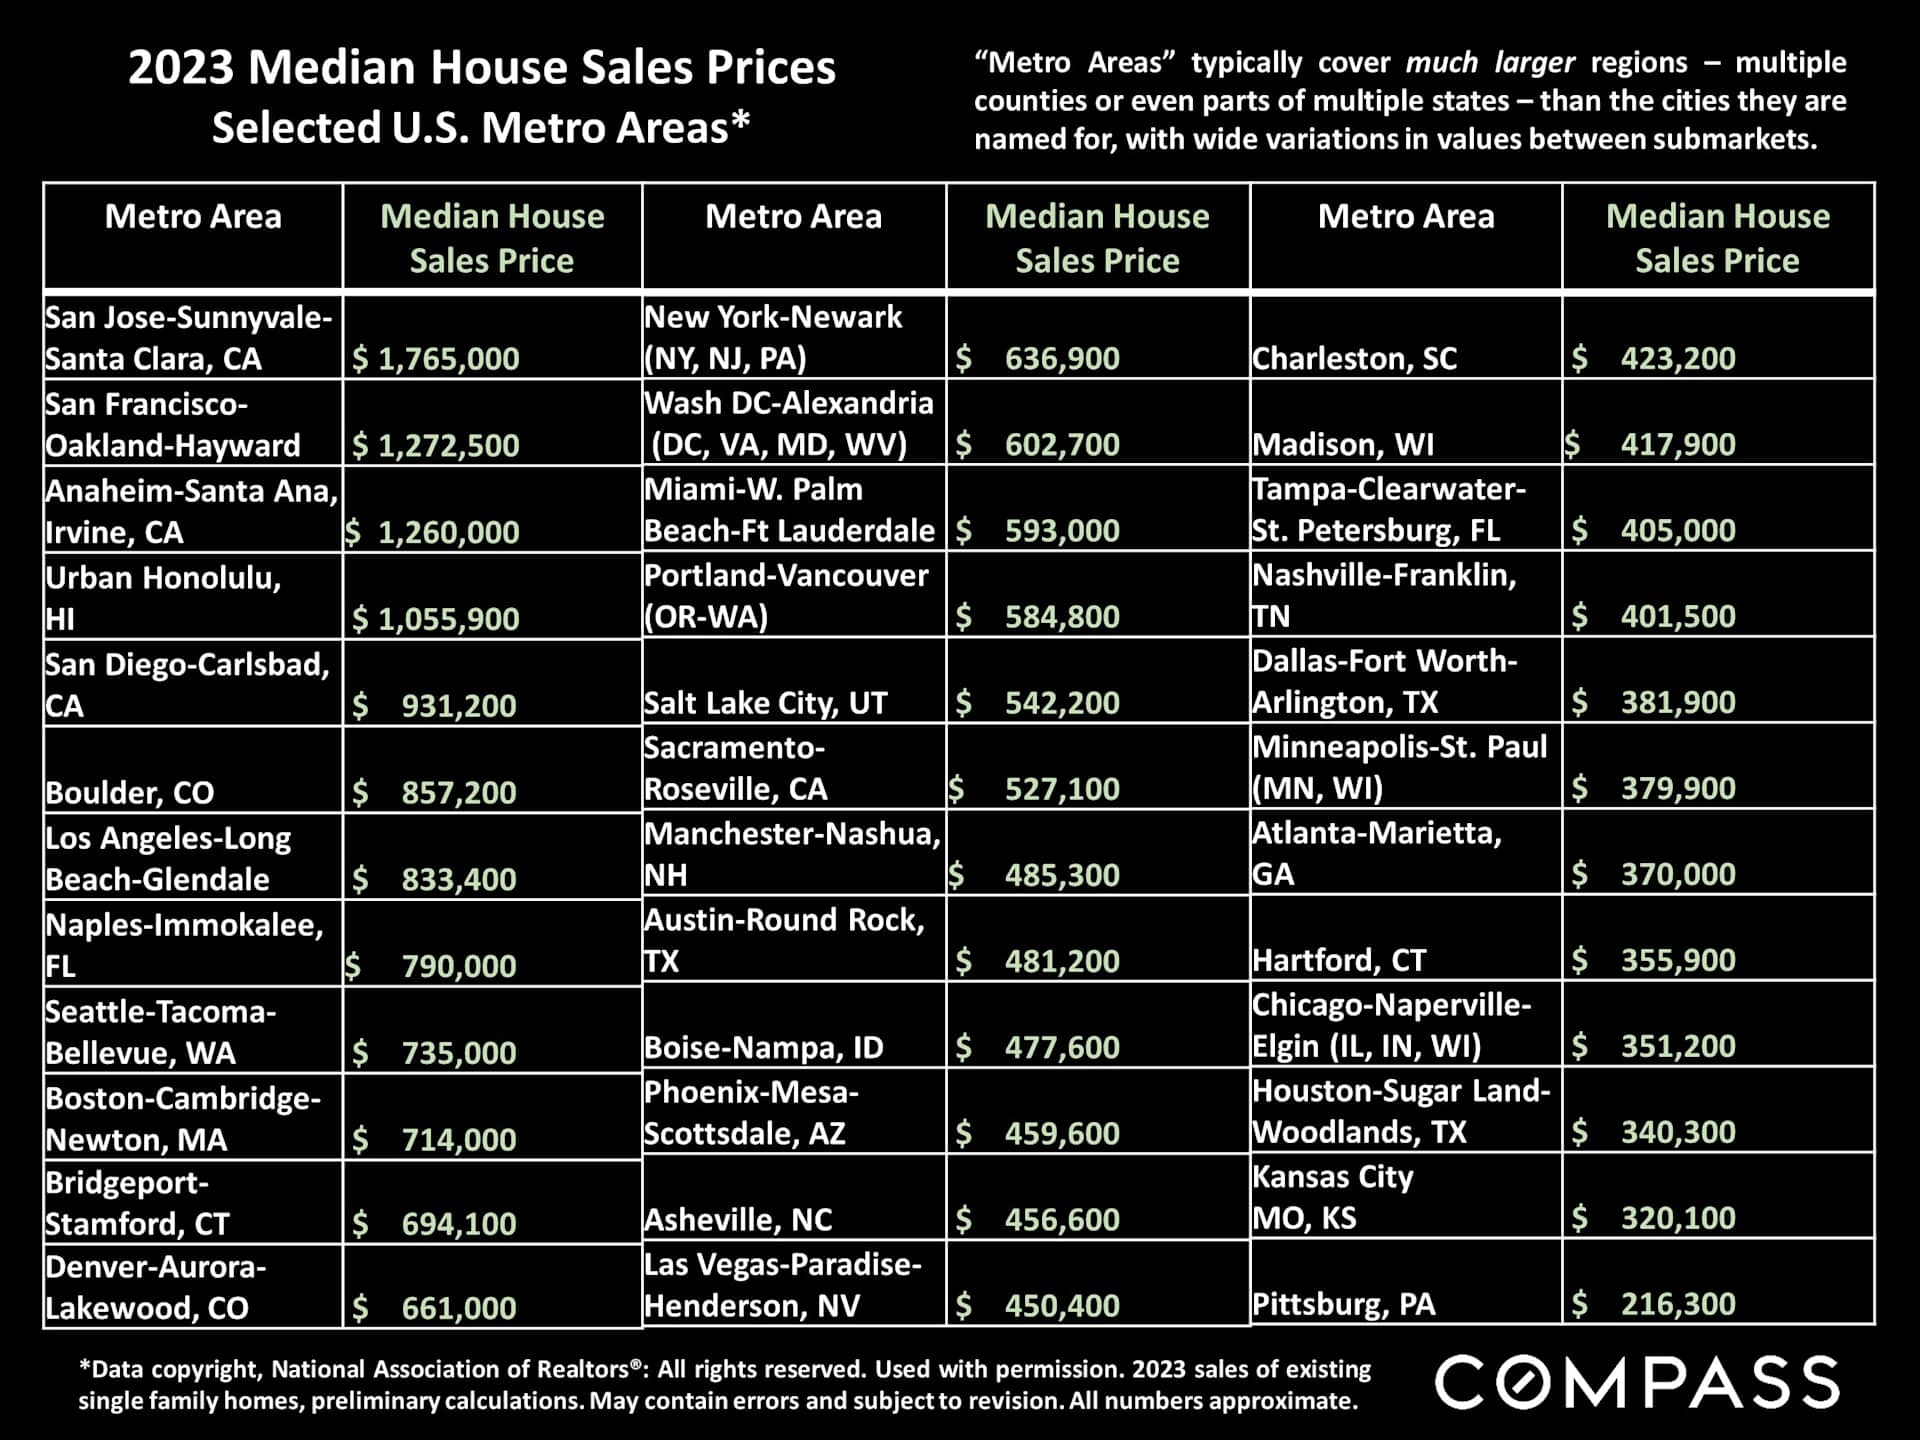
NAR 2023 median house sales prices in selected metro-areas: Metro areas typically cover multi-county and sometimes multi-state regions. The SF metro area includes Marin, Alameda, Contra Costa and San Mateo Counties;  The San Jose metro area comprises Santa Clara and San Benito Counties (utterly dominated by the Santa Clara County real estate market).
Infographic comparing 2023 median house sales prices across selected U.S. metro areas, from San Jose to Pittsburg.

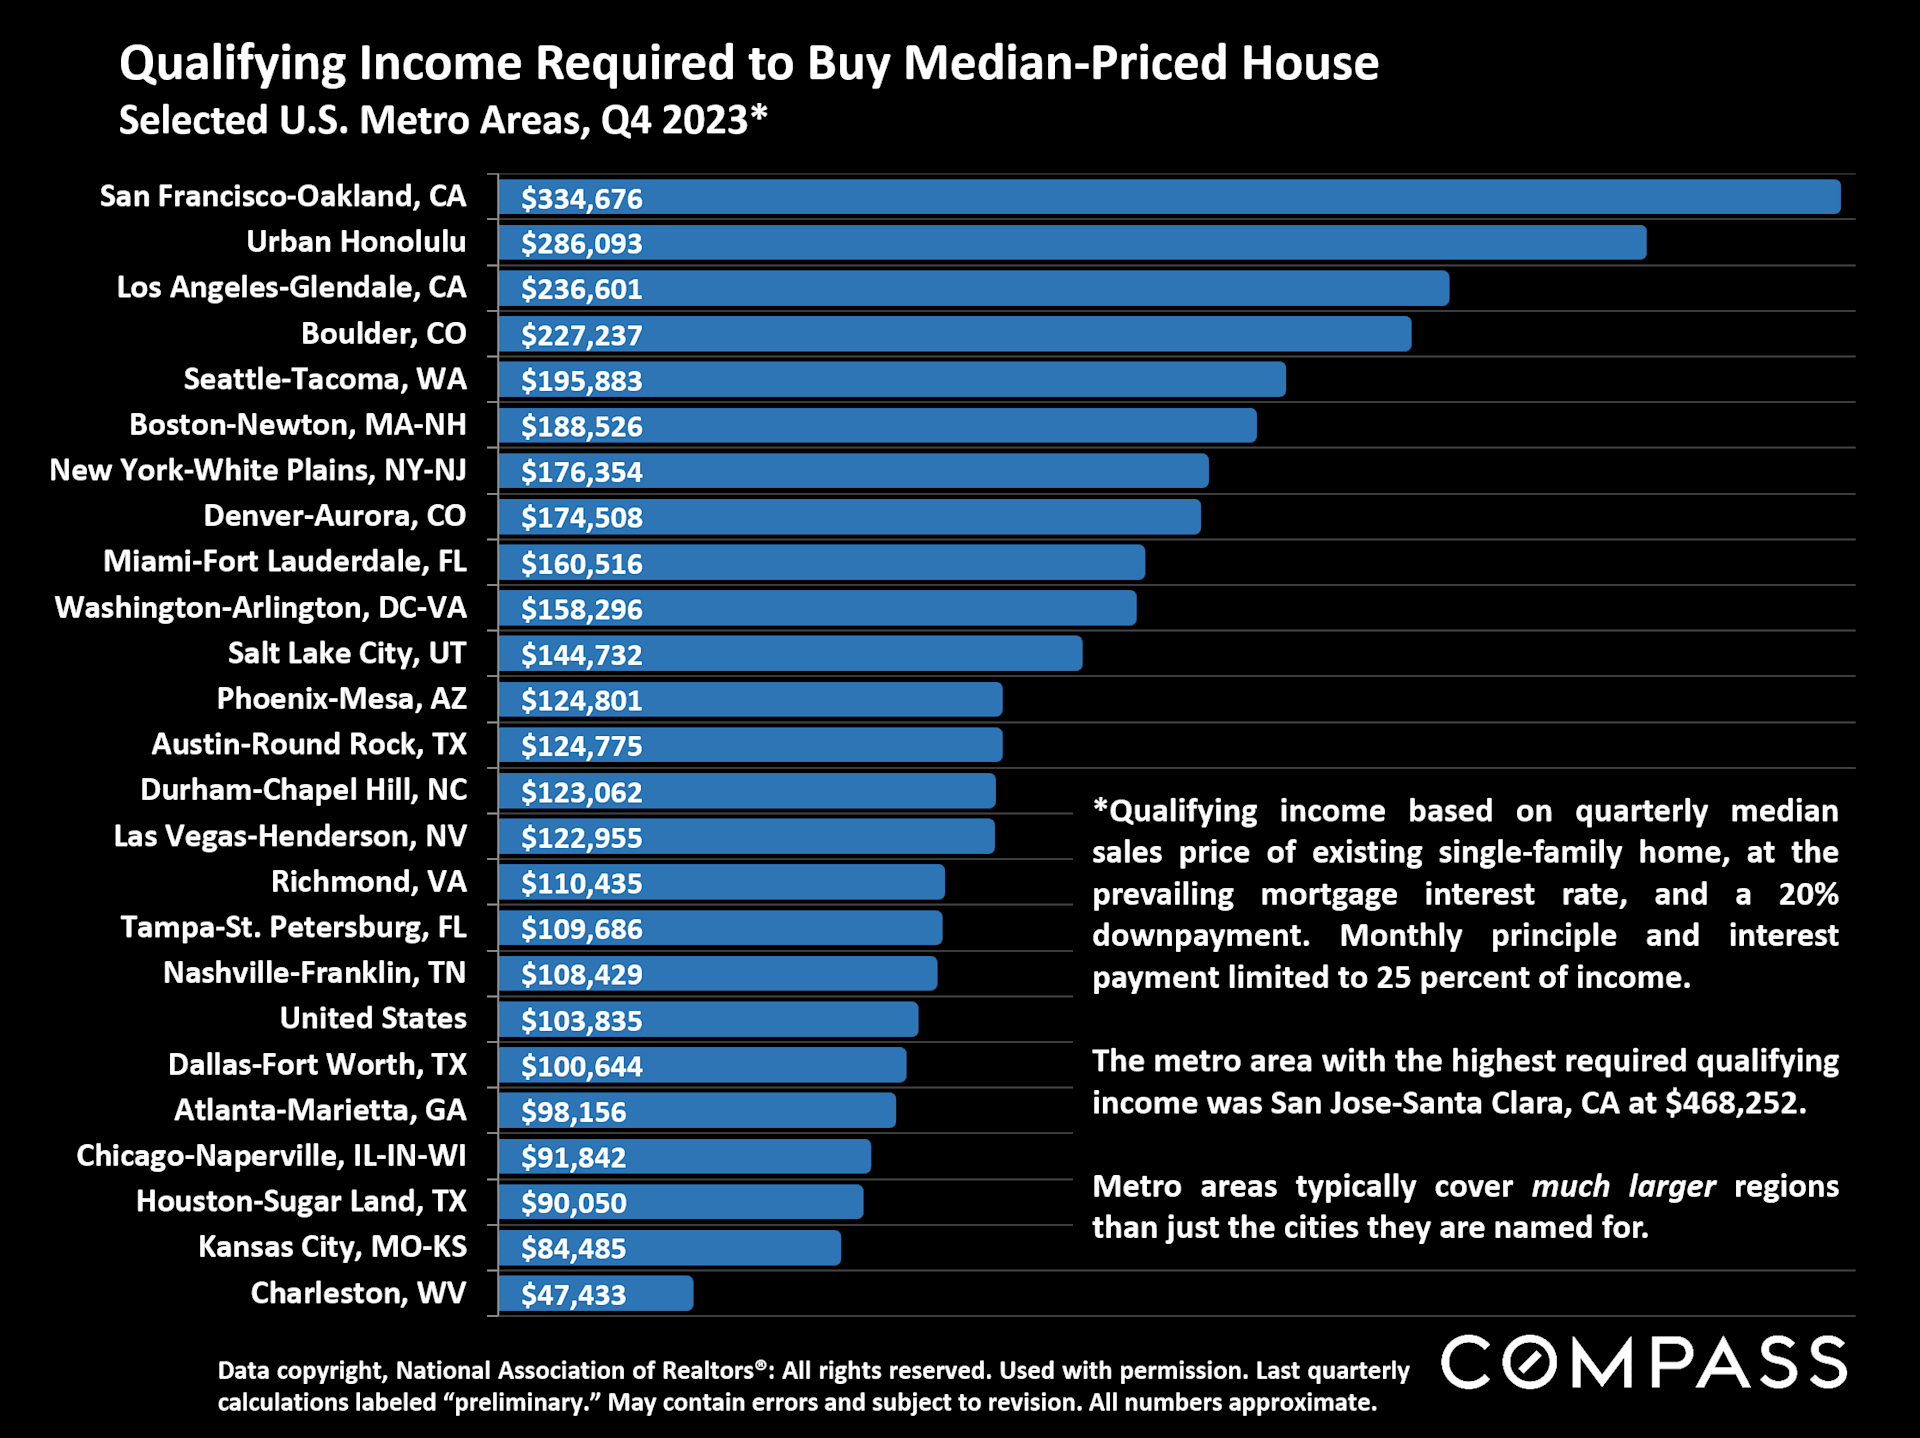
Income required to buy a median single-family home in Q4 2023 in selected metro areas, at prevailing Q4 interest rate and a 20% downpayment. The San Jose-Santa Clara metro area (Santa Clara & San Benito Counties, home to Apple, Google and Nvidia), had the highest qualifying income at $468,000. 
 
Bar chart of qualifying income for a median-priced home, led by San Francisco-Oakland at $334,676.
 
This folder has updated, Compass-branded, long-term metro-area annual price trend charts for about 60 U.S. metro areas. 

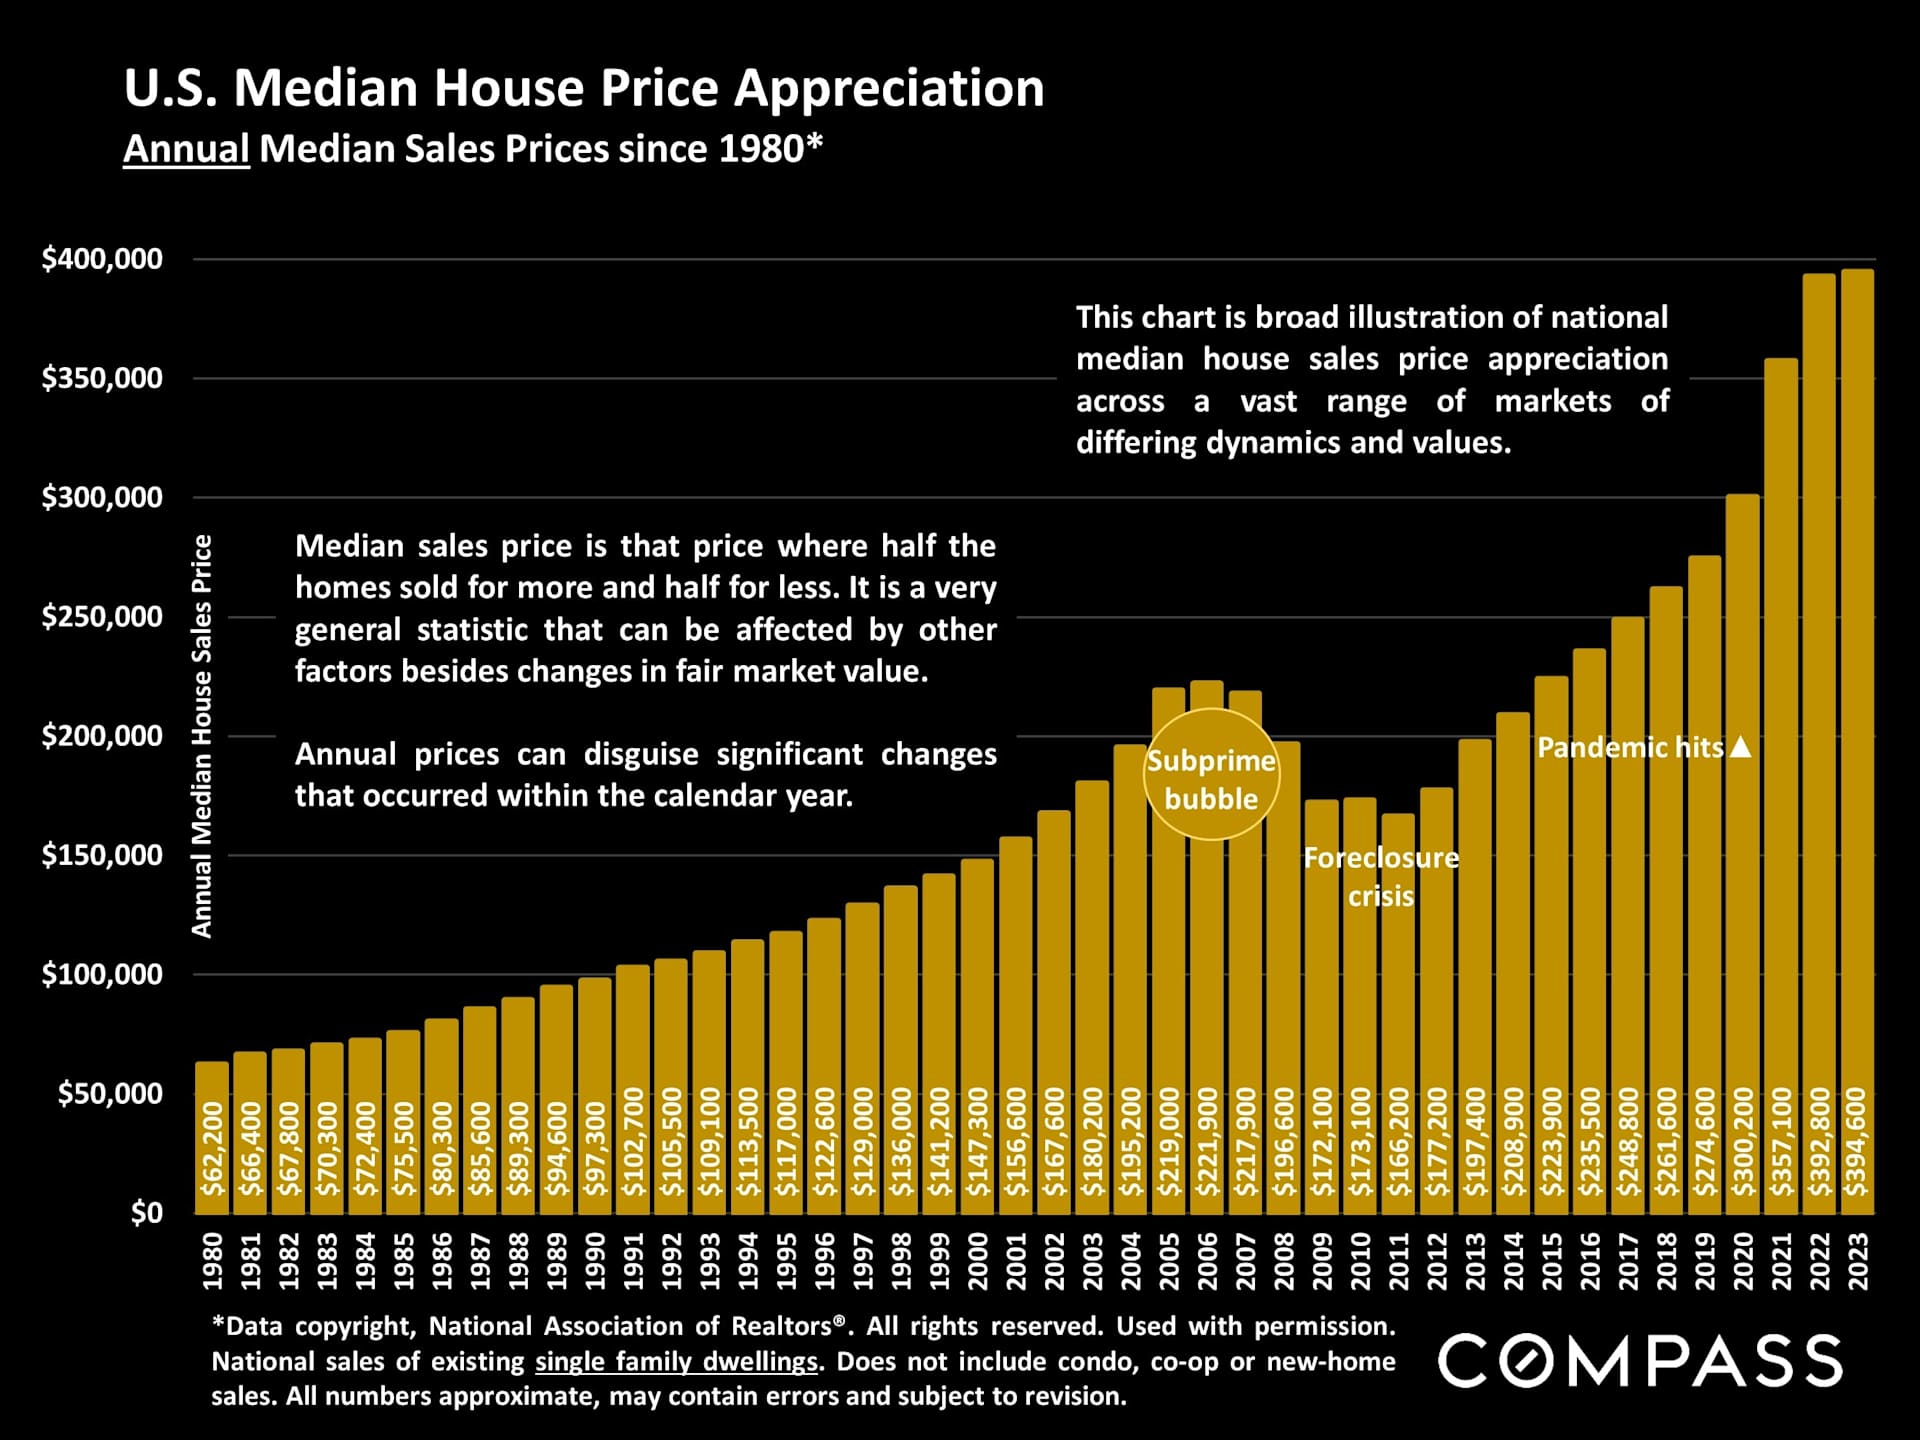
U.S. median house sales prices by year since 1980: The country as a whole hit a slight, new high in 2023, though most Bay Area markets remain somewhat down from 2022 - Sonoma and Monterey are the exceptions with year-over-year gains. 

Chart of U.S. median house prices from 1980 to 2023, with gold bars and marked housing-market events.

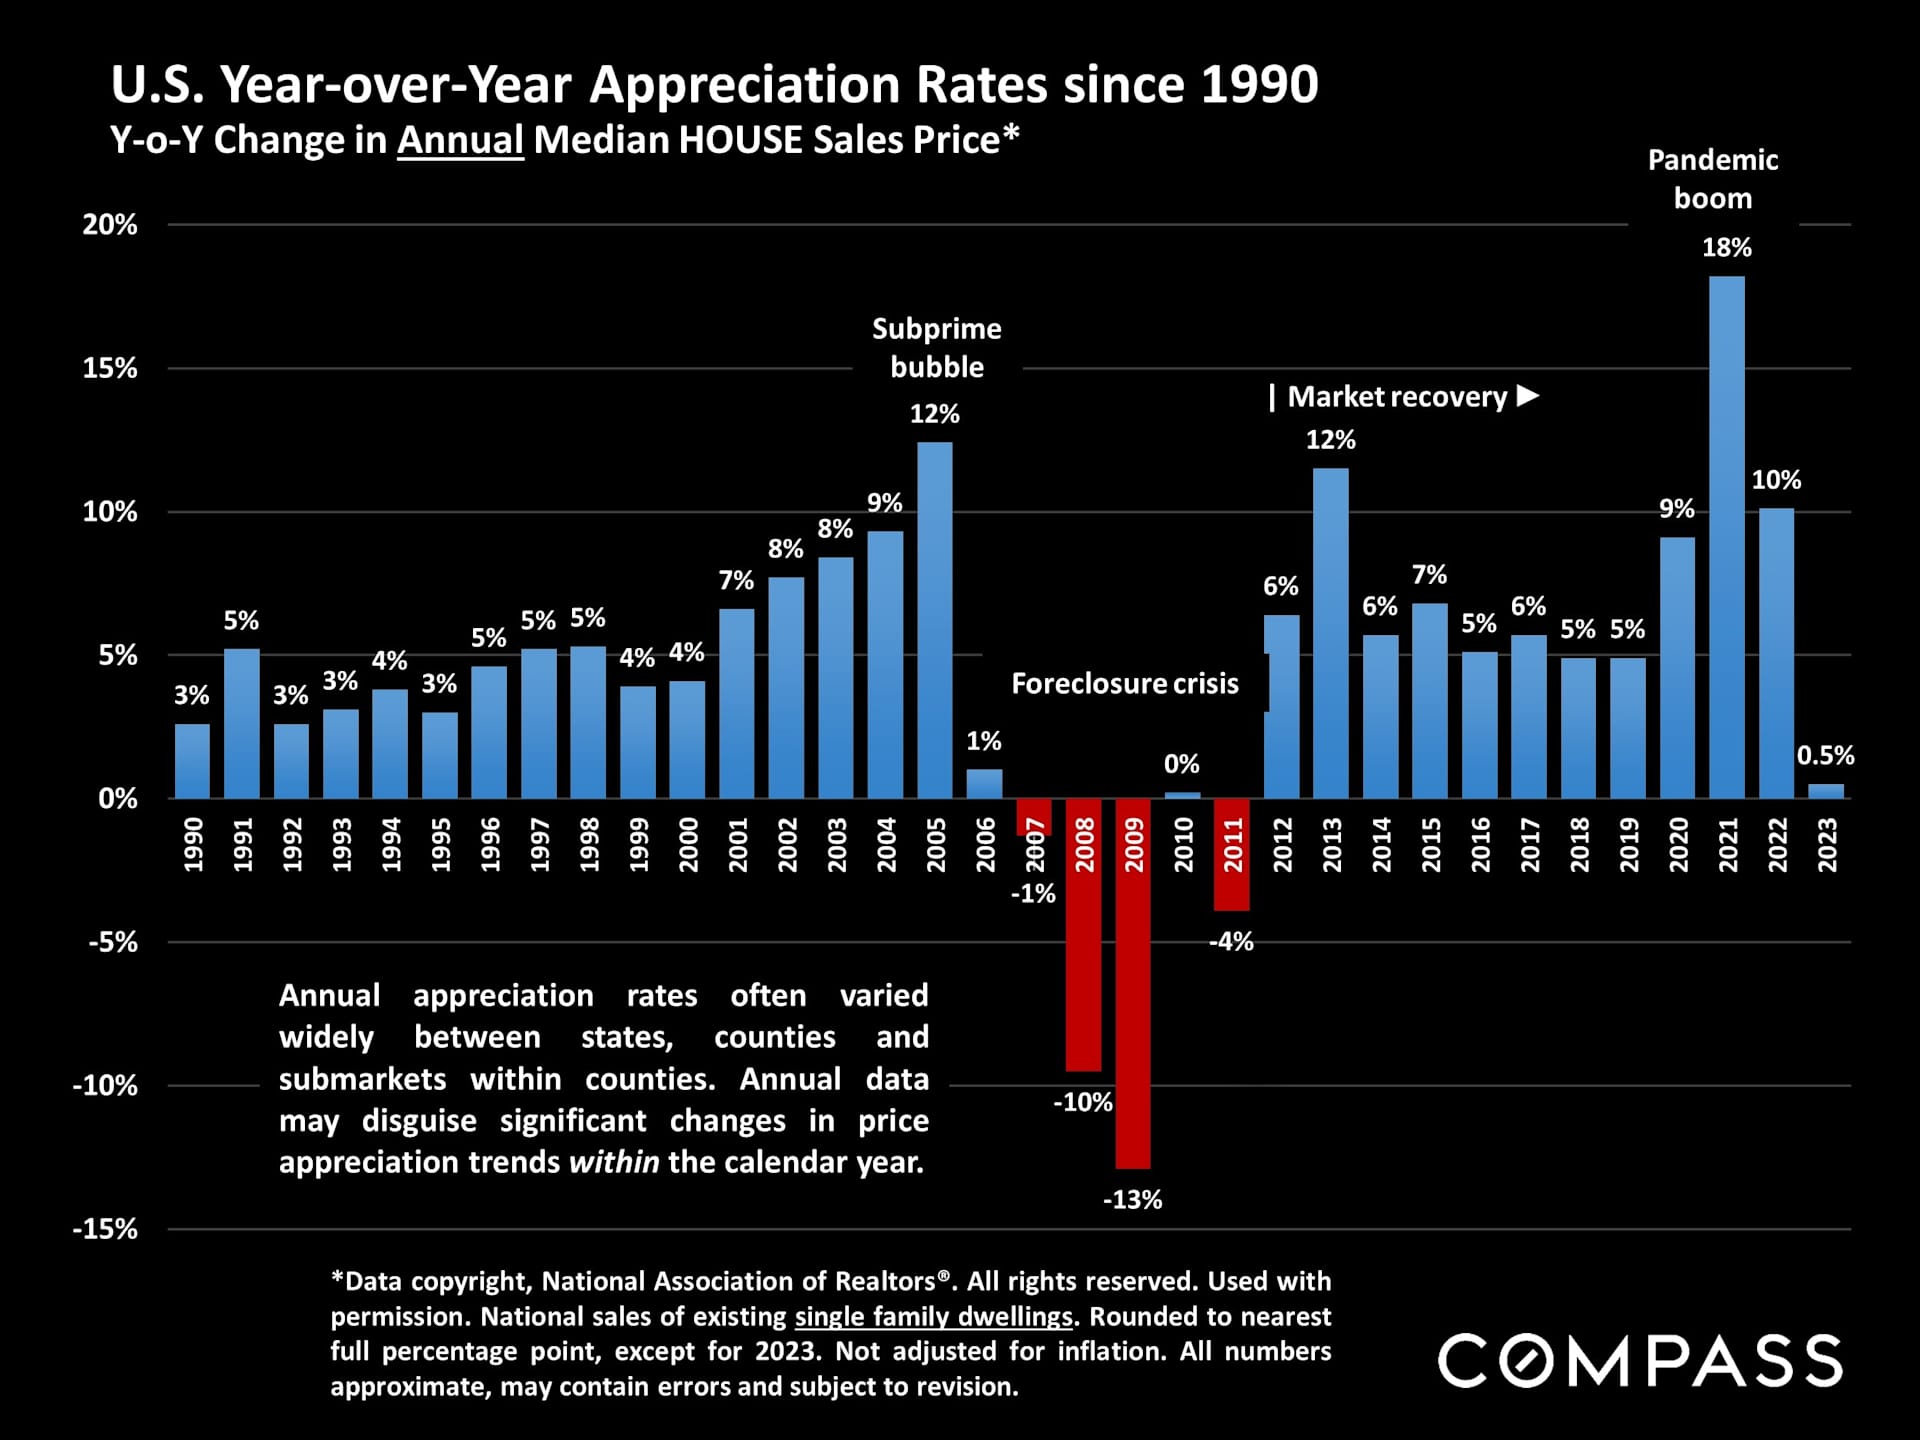
Chart of U.S. annual home price appreciation, 1990–2023, highlighting the foreclosure crisis and pandemic boom.
Alexander Lurie smiling in a dark blazer and striped shirt.

Meet Alexander

Meet Alexander Lurie

Alexander Fromm Lurie is a highly accomplished San Francisco real estate professional and the leader of The Lurie Group, a top-performing team recognized among the top 1% of agents in the city. With over a decade of experience in the real estate industry and California DRE License #01952347, Alexander has built a reputation for delivering exceptional results, with hundreds of homes sold and over $1 billion in total sales volume. Born and raised in San Francisco, he brings deep local expertise, generational knowledge of the Bay Area, and a strong connection to the community into every client relationship. His approach goes beyond transactions—focusing on helping clients build meaningful connections to neighborhoods, schools, and local culture while navigating the buying or selling process with confidence.

Alexander’s background in management consulting and entrepreneurship further strengthens his strategic approach to real estate, allowing him to provide clients with a competitive edge in pricing, negotiation, and marketing. Known for his integrity, discretion, and client-first mindset, he continues to be a trusted advisor for buyers, sellers, and investors across San Francisco’s dynamic real estate market.

Alexander Lurie

Founder | Real Estate Advisor
LICENSE NUMBER
01952347
ADDRESS
629 Divisadero Ave, San Francisco, CA 94117

Let's Work Together

Our passion is supporting clients who value exceptional results and client care. We look forward to the opportunity to work together.
Modern condo living and dining area with a geometric chandelier and Bay Bridge views through large windows.
link
Follow Us