
The Lurie Group
Interest Rates, Inflation, National & Bay Area Market Trends

Interest Rates, Inflation, National & Bay Area Market Trends

  • Alexander Lurie
  • October 24, 2024
"Following the release of a stronger-than-expected September jobs report, the 30-year fixed rate mortgage saw the largest one-week increase since April. However, the rise in rates is largely due to shifts in expectations and not the underlying economy, which has been strong for most of the year. Although higher rates make affordability more challenging, it shows the economic strength that should continue to support the recovery of the housing market." FHLMC, 10/10/24 
 
Interest rates have continued to tick up slightly in the past weeks. Weekly and daily averages (from sources that use different methodologies): 

Chart of weekly 30-year mortgage rates from January 2023 to October 2024, peaking near 7.8% in October 2023.

Chart of daily 30-year fixed mortgage rates from February 2023 to October 17, 2024, peaking above 8% in October 2023.

Latest inflation report released this morning: General CPI declined again, to the lowest reading since February 2021. "Core" CPI was unchanged at 3.3%. So far today, the response in stock and bond markets has been relatively muted.

Chart of U.S. inflation from 2021 to September 2024, with red CPI bars and a white core CPI line.

NATIONAL supply and demand indicators:  The basic reality since spring is that sales activity has been increasingly outpaced by the increase in active listings for sale, which offers more choice and lessens the competitive environment for buyers. The recent drop in interest rates through very early October - before the latest spike up in rates on 10/4 - did not precipitate the substantial rebound in buyer demand that many had expected in September. It may have been that prior to the jump in rates  buyers were holding back in expectation of further declines (as forecast by most analysts). October is typically the last major month of market activity before heading into the big mid-winter holiday slowdown, which usually starts in mid-November and lasts until mid-January. 
 
Generally speaking, the overall national market is seeing similar trends to the general Bay Area market.
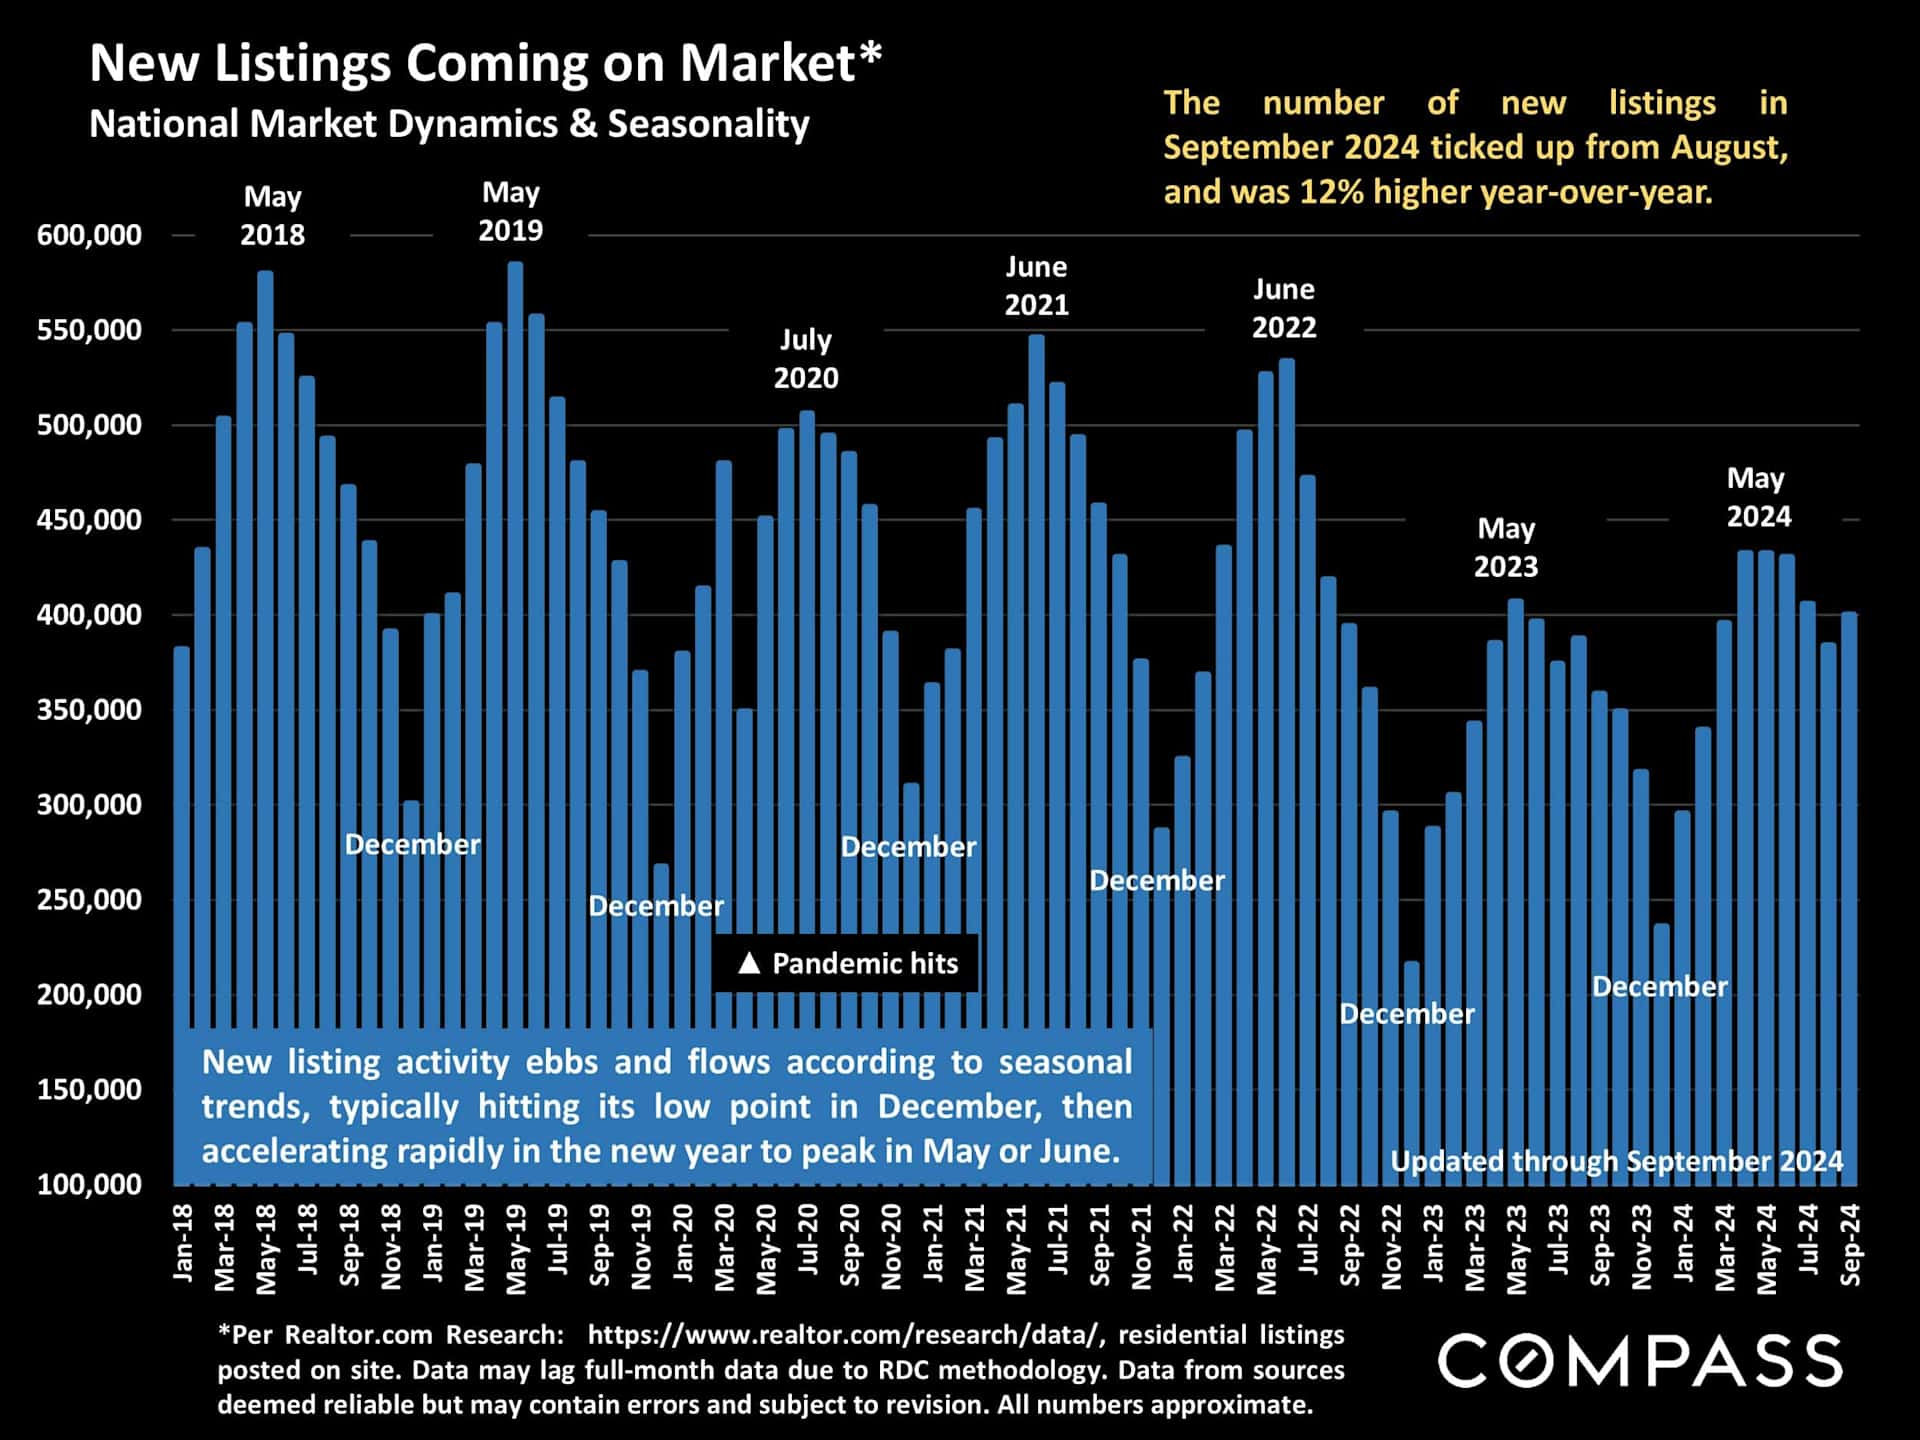
Bar chart of national new listings from 2018 to September 2024, showing seasonal peaks and a 12% year-over-year increase.

Chart of U.S. active home listings from 2017 to 2024, with a pandemic-era boom and rising listings in 2024.

Chart of U.S. monthly pending listings from 2018 to September 2024, highlighting the pandemic boom and September 2024 trend.

The pending-sale ratio - a version of the absorption rate - has been falling as the increase in inventory outpaced sales activity. In September, it was as low as last December, and December typically sees the lowest pending-sale ratio of the year.

Chart of the U.S. pending-sale ratio from 2016 to September 2024, with the pandemic-era peak and recent decline highlighted.

Inventory outpacing buyer demand has led to a significant increase in price reductions, comparable to levels seen right after interest rates soared in the first half of 2022.

Chart of U.S. active-listing price reductions from 2018 to September 2024, with seasonal peaks and market annotations.

New Census data was recently released, and I created some updated demographic snapshots if you want to post a few or ping your clients with something different.

Here are some SAMPLES of the snapshots, and all of them can be downloaded from here. 

Pie chart comparing Bay Area county land areas in square miles; Monterey is largest and San Francisco smallest.

Chart comparing population density across Bay Area counties, with San Francisco far highest.

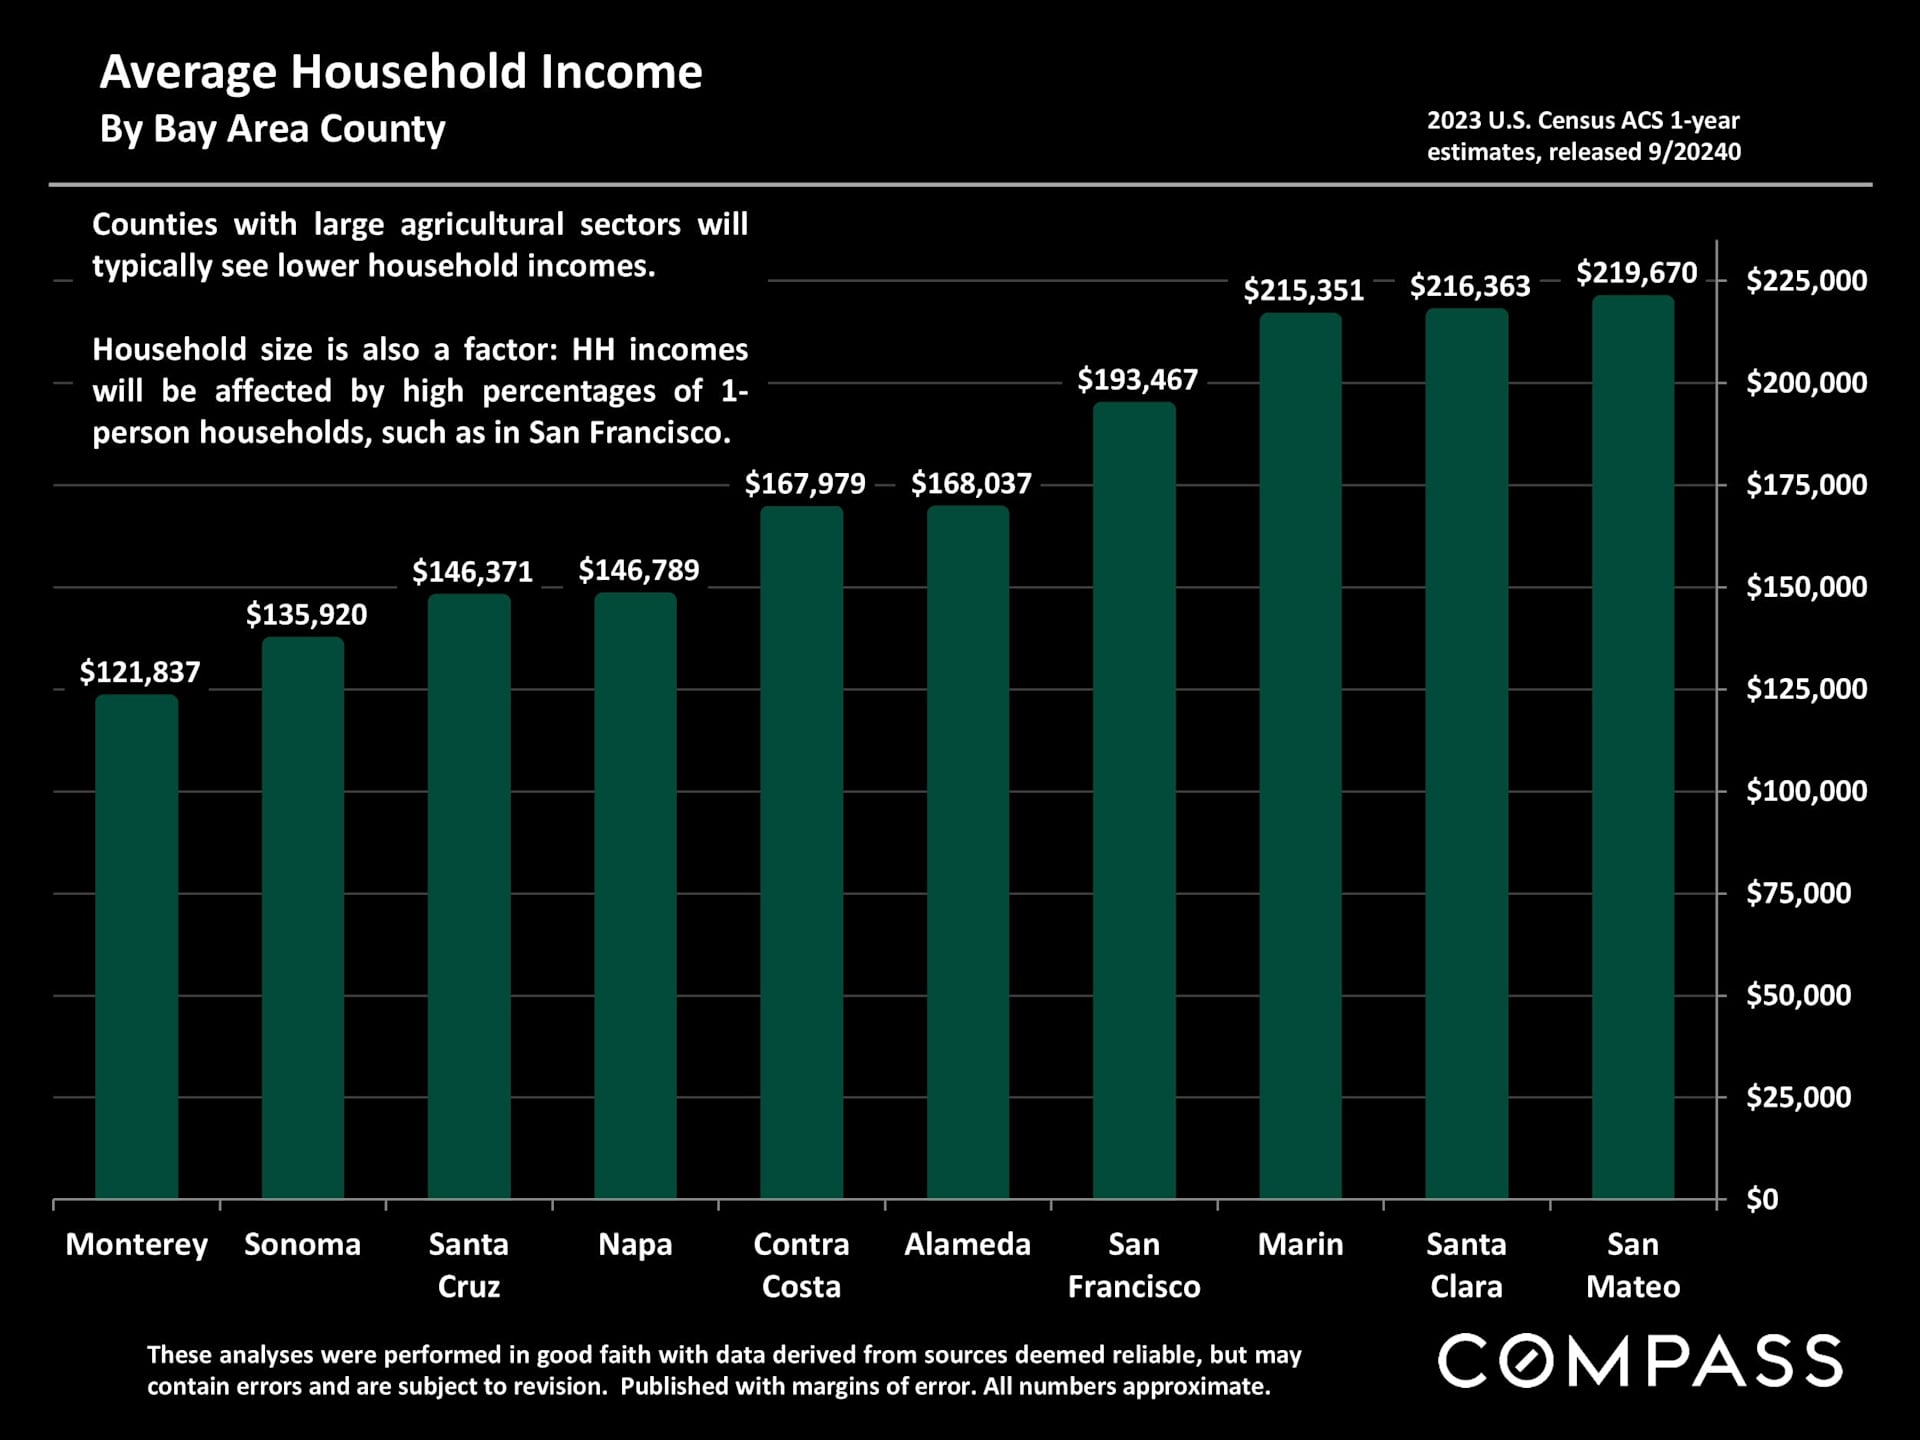
Bar chart of average household incomes by Bay Area county; San Mateo is highest at $219,670 and Monterey lowest at $121,837.

Bar chart comparing bachelor's and graduate degree attainment across ten Bay Area counties.

Bar chart compares foreign-born population shares across 11 Bay Area counties; Santa Clara leads at 42%, Sonoma is lowest at 17%.

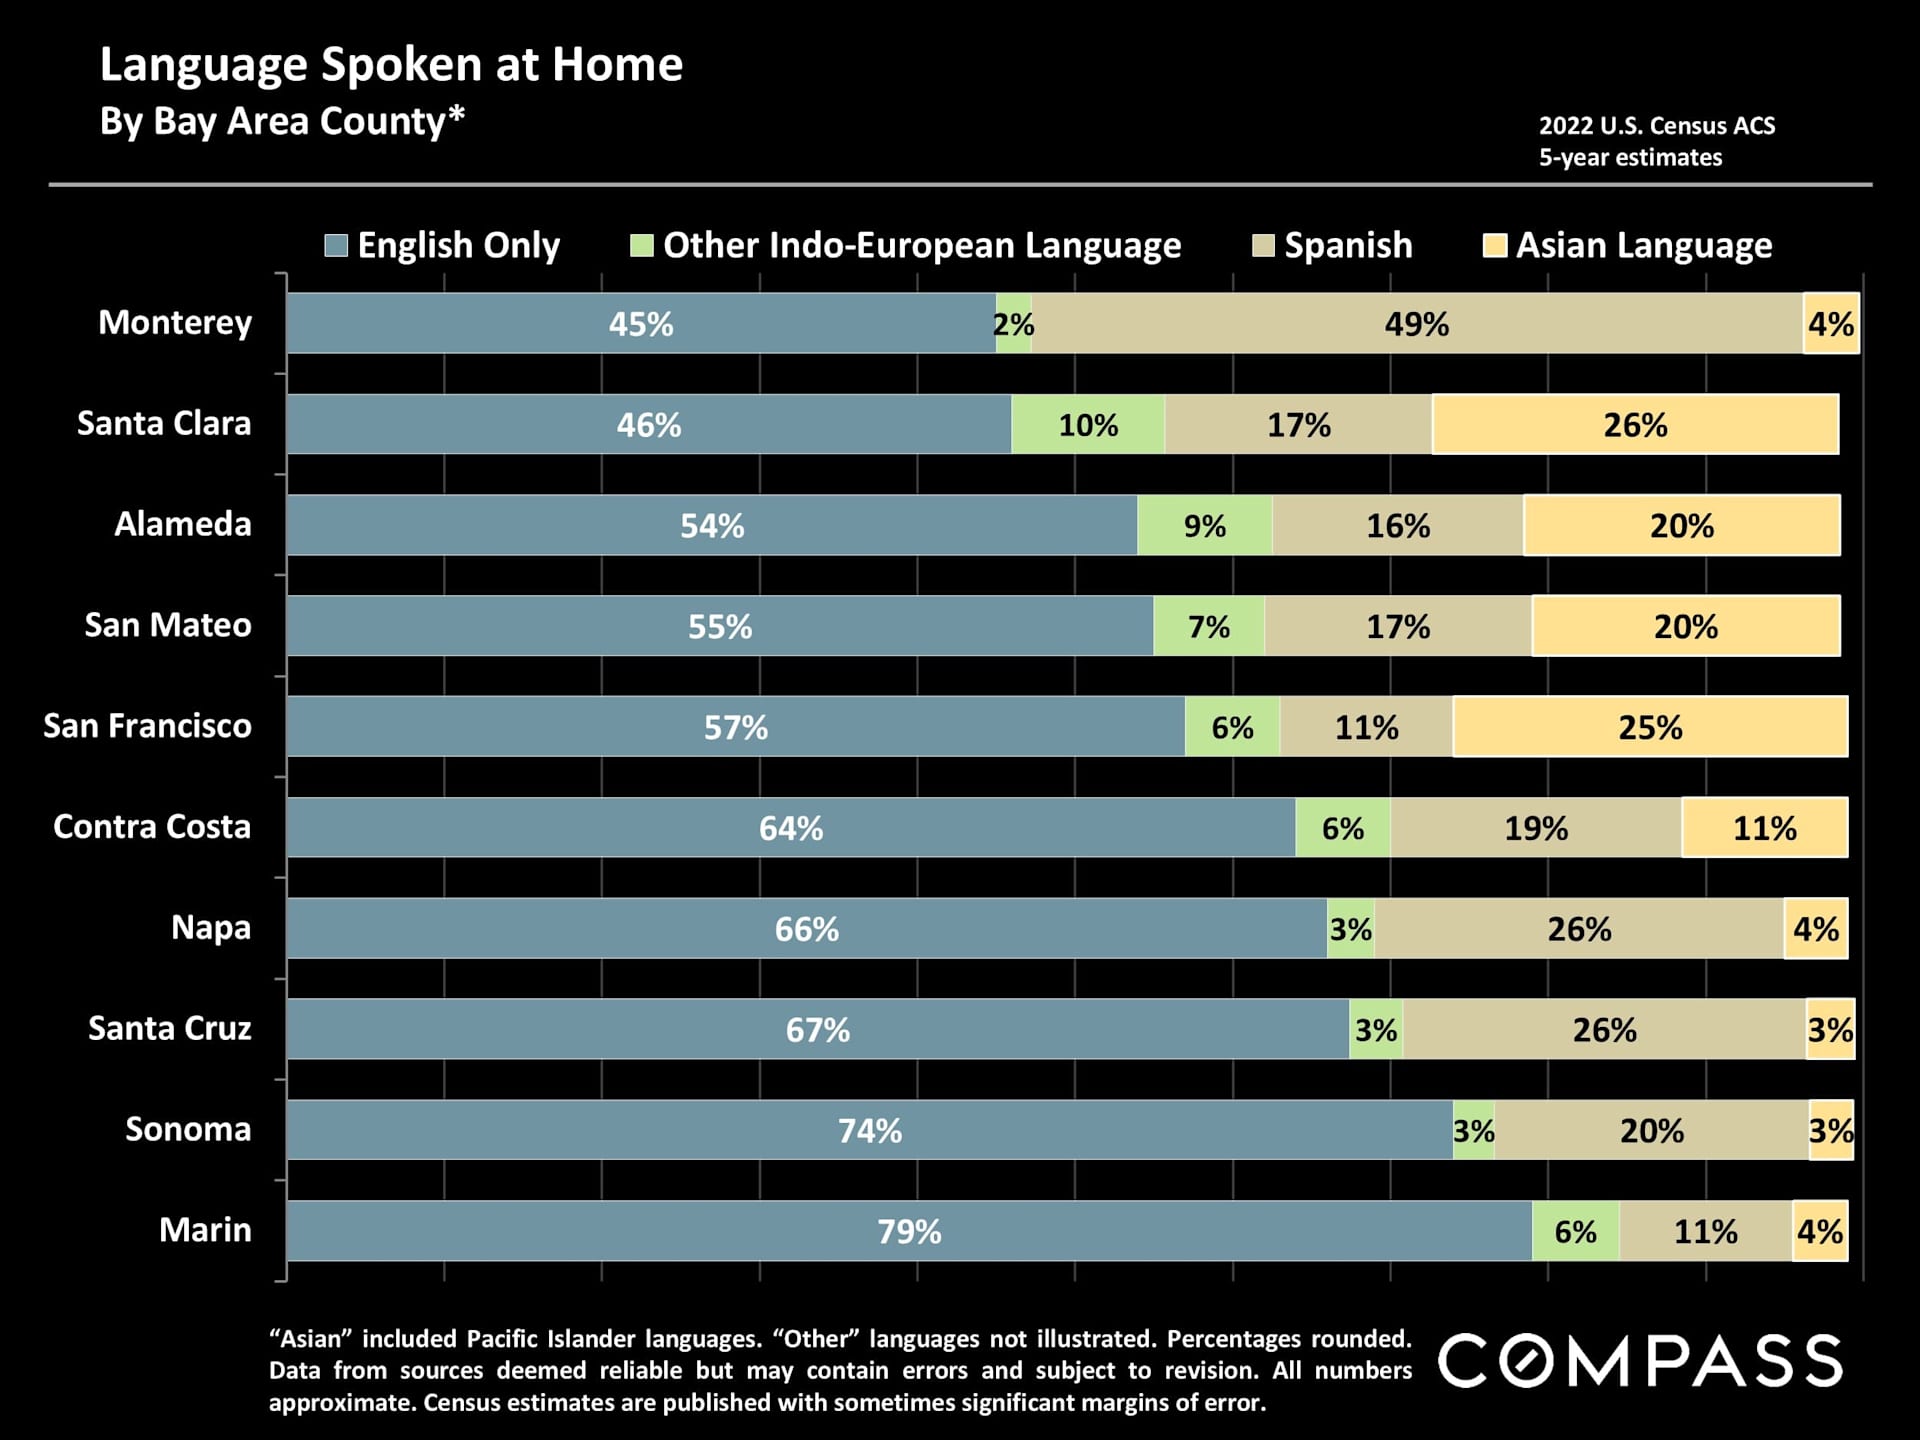
Chart comparing home languages across ten Bay Area counties, with English-only, Indo-European, Spanish, and Asian-language percentages.


Alexander Lurie smiling in a dark blazer and striped shirt.

Meet Alexander

Meet Alexander Lurie

Alexander Fromm Lurie is a highly accomplished San Francisco real estate professional and the leader of The Lurie Group, a top-performing team recognized among the top 1% of agents in the city. With over a decade of experience in the real estate industry and California DRE License #01952347, Alexander has built a reputation for delivering exceptional results, with hundreds of homes sold and over $1 billion in total sales volume. Born and raised in San Francisco, he brings deep local expertise, generational knowledge of the Bay Area, and a strong connection to the community into every client relationship. His approach goes beyond transactions—focusing on helping clients build meaningful connections to neighborhoods, schools, and local culture while navigating the buying or selling process with confidence.

Alexander’s background in management consulting and entrepreneurship further strengthens his strategic approach to real estate, allowing him to provide clients with a competitive edge in pricing, negotiation, and marketing. Known for his integrity, discretion, and client-first mindset, he continues to be a trusted advisor for buyers, sellers, and investors across San Francisco’s dynamic real estate market.

Alexander Lurie

Founder | Real Estate Advisor
LICENSE NUMBER
01952347
ADDRESS
629 Divisadero Ave, San Francisco, CA 94117

Let's Work Together

Our passion is supporting clients who value exceptional results and client care. We look forward to the opportunity to work together.
Modern condo living and dining area with a geometric chandelier and Bay Bridge views through large windows.
link
Follow Us